
London renovation statistics 2026
How old London's homes are, what moving costs and how often councils approve home improvements.
London's homes are older than England's, they cost almost twice as much, and moving between them carries a far bigger tax bill. One in five London homes was built before 1900, stamp duty on the average London home comes to £17,721, and London councils refuse householder planning applications more often than the England average.
Fewer Londoners are asking. London's planning authorities decided 23,973 householder applications in the year to June 2026, the lowest total since 1999, while spending on repairing and maintaining London's homes reached £6.8 billion in 2025. For the national picture, see our UK renovation statistics.
Every figure comes from an official source or a named survey and is dated. The sources are numbered in brackets and listed in full at the end of the page.
Key statistics
- Homes built before 1900: 20.8% of London's 3,863,700 homes (England 14.9%) [1]
- Homes built before 1945: 51.0% (England 34.6%) [1]
- Borough with the oldest homes: Kensington and Chelsea, 62.2% built before 1900 [1]
- Average London home, August 2026: £554,430, down 2.2% on a year earlier [2] [3]
- Stamp duty on the average London home: £17,721, against £4,676 on the average home in England [4] [2]
- Householder planning decisions, year to June 2026: 23,973 in London, the lowest since 1999 [5]
- Householder applications refused: 14.2% in London, 9.5% in England [5]
- Prior approvals for larger home extensions: London made 36.0% of England's decisions in April to June 2026 [5]
- Conservation areas: 1,056, holding 20.3% of London's domestic premises [6]
- Households living in a flat: 54.0% in London, 22.2% in England [7]
- Overcrowded households: 11.1% in London, 4.4% in England [9]
- Housing repair and maintenance output, 2025: £6,818 million in London, around £1,765 per home [10] [1]
How old are London's homes?
London's housing is older than England's. Of the 3,863,700 homes on the Valuation Office Agency's list in March 2026, 20.8% were built before 1900, against 14.9% across England, and 51.0% were built before 1945, against 34.6% [1].
London has 14.9% of England's homes but 20.8% of its pre-1900 homes, some 802,000 properties [1]. The capital also has more interwar housing: 22.0% of London homes date from 1919 to 1939, against 14.7% nationally.
The gap runs the other way after the war. Only 16.8% of London homes were built between 1945 and 1972 and 12.9% between 1973 and 1999, against 25.3% and 20.5% for England. Homes built since 2000 make up a similar share in both, 18.5% in London and 18.8% in England [1].
Older homes bring their own jobs: solid walls, timber floors, original sash windows and roofs that were never designed for an extra room. Our Kensington housing statistics show what that looks like in the oldest part of the capital.
Which London boroughs have the oldest homes?
Kensington and Chelsea has the oldest homes in London, with 62.2% built before 1900. Hammersmith and Fulham follows at 47.5%, then Camden at 44.5% and Westminster at 44.1%, all more than twice the London share of 20.8% [1].
Lambeth (36.4%), Haringey (36.3%), Islington (35.8%), Wandsworth (31.9%), Hackney (29.3%) and Lewisham (27.6%) complete the ten oldest boroughs [1].
Outer London was built later. In Harrow 51.3% of homes date from 1919 to 1939, and in Barking and Dagenham 49.4%, while only 1.2% of Barking and Dagenham's homes predate 1900 [1]. Tower Hamlets has the newest stock, with 45.4% of homes built since 2000. The Barking and Dagenham housing statistics page breaks down that borough's interwar estates.
What does it cost to move up the London property ladder?
The average London home cost £554,430 in August 2026, 2.2% less than a year earlier and about 1.9 times the England average of £293,525 [2] [3]. A terraced house averaged £648,650, which is £221,340 more than the average flat or maisonette at £427,310 [2].
The next rung is smaller but still large. A semi-detached house averaged £730,580, £81,930 more than a terrace, and a detached house £1,164,439 [2]. Flats fell fastest over the year, down 5.0%, while terraced prices were almost flat at 0.1% [2].
First-time buyers in London paid an average of £473,051 in August 2026 and former owner occupiers £695,762 [3]. Prices have edged back since 2022: the August 2026 average is 4.6% below August 2022's £581,320, but 9.7% above August 2016's £505,256 [2].
Those gaps are why many owners compare the cost of moving with the cost of adding space. For a family already in a terrace, a house extension adds room without paying the £81,930 step to a semi, or the stamp duty that comes with it. What an extension costs depends on its size, structure, access and finish.
How much stamp duty would you pay on an average London home?
A buyer replacing their main home would pay around £17,721 in stamp duty on London's average price of £554,430, almost four times the £4,676 due on England's average home. We worked this out from HMRC's current residential rates and the August 2026 prices [4] [2].
Stamp duty is charged at 0% up to £125,000, 2% to £250,000, 5% to £925,000, 10% to £1.5 million and 12% above that [4]. On London's average home mover price of £695,762 the bill rises to £24,788, and on the average detached house, £1,164,439, it is £60,193 [3] [2] [4].
First-time buyers pay 0% on the first £300,000 and 5% up to £500,000, with no relief above £500,000 [4]. That puts the bill on London's average first-time buyer price of £473,051 at £8,652 [3]. Buyers who will own more than one home usually pay a further 5% on top [4].
None of that money stays in the home. Stamp duty is only one cost of moving, alongside legal, survey and agent fees. For what owners spend on improving instead, see our home improvement statistics.
How many householder planning applications do London boroughs decide?
London's planning authorities decided 23,973 householder applications in the year to June 2026, the lowest annual total since the year to June 1999. That is 36.5% fewer than the 37,761 decided in the year to June 2016 and 38.7% below the 2008 peak of 39,076 [5].
Householder applications cover work to an existing house, such as extensions, loft dormers, conservatories and outbuildings. London made 16.5% of England's 145,609 householder decisions over the same year, and England's total was the lowest of any full year in a series that starts in 1979, down 39.4% on the year to June 2022 [5].
Per home, Londoners still apply slightly more often. London's authorities made 6.2 householder decisions for every 1,000 homes, against 5.6 across England [5] [1]. Richmond upon Thames made the most at 15.2 per 1,000 homes, followed by Bromley (11.2) and Kingston upon Thames (10.5). Tower Hamlets made the fewest at 1.3.
These totals do not include prior approvals for larger rear extensions, which are counted separately, or work done under permitted development with no application at all. A rear dormer loft conversion on a house outside a conservation area may be able to go ahead under permitted development.
Which London boroughs refuse the most householder applications?
Barking and Dagenham refused 33.5% of the householder applications it decided in the year to June 2026, 130 out of 388, the highest rate in London. Greenwich refused 22.9%, Hounslow 21.5% and Bromley 21.4%, against 14.2% across London and 9.5% across England [5].
At the other end, Hammersmith and Fulham refused just 2.2% of 506 decisions, Southwark 5.2% of 558 and Bexley 5.4% of 877 [5]. Across London 3,411 householder applications were refused in the year and 20,562 granted.
Larger rear extensions go through a separate prior approval process. In April to June 2026 London's authorities decided 1,231 of these, 36.0% of England's 3,417, even though London has 14.9% of England's homes [5] [1]. Of the London decisions, 77.0% were allowed and 23.0% refused, against 18.1% refused in England. Redbridge (146), Enfield (113) and Ealing (88) handled the most.
There is no official count of basement applications by borough, because the national statistics do not split householder work by type. Anyone planning a basement conversion should check their council's basement policy and any Article 4 directions first.

How much of London is in a conservation area?
London has 1,056 mapped conservation areas, according to Historic England, and they contain about 710,000 domestic premises, 20.3% of London's housing stock. 59% of the homes in them were built before 1929, against 27% in the rest of London [6].
Conservation areas also hold almost all of London's listed homes: 90% of listed domestic premises, 8,511 in total, sit inside one [6]. Interwar housing is less common inside them, with 12% built from 1930 to 1949 against 25% elsewhere.
The same Historic England analysis rated 43% of conservation area homes in EPC Band B or C, close to the 44% for the rest of London, against only 11% of listed homes [6]. Each borough sets its own rules, so the Islington housing statistics page, for example, lists that borough's conservation areas and Article 4 directions.
How do Londoners live: flats, tenure and overcrowding
54.0% of London households lived in a flat at the 2021 Census, against 22.2% across England. 40.3% lived in a purpose-built block and 11.1% in a flat inside a converted or shared house, more than three times England's 3.5% [7].
Fewer Londoners own their home. 45.2% of London households owned outright or with a mortgage, against 61.3% in England, while 30.0% rented privately against 20.5%, and 23.1% rented from a council or housing association [8].
London homes are also more crowded. 11.1% of London households, 379,871 in all, had fewer bedrooms than they needed under the bedroom standard, against 4.4% in England [9]. Only 21.8% had two or more spare bedrooms, against 35.6% nationally.
In a flat or a converted house, the space is usually fixed, so most work happens inside the existing walls: a better layout, more storage or a new kitchen.
How much is spent repairing and maintaining London's homes?
Construction firms carried out £6,818 million of housing repair and maintenance work in London in 2025, according to ONS estimates, around £1,765 for every home in the capital. That is 28.3% more than in 2019 and more than double the £3,160 million of 2010 [10] [1].
These figures are in current prices, so part of the rise reflects higher building costs rather than more work. The 2025 total was slightly below 2024's £6,922 million, the highest in the series [10].
London accounted for 15.4% of all housing repair and maintenance output in Great Britain in 2025, £6,818 million out of £44,156 million [10]. The ONS says these regional estimates are modelled and do not carry National Statistics status, so they are best read as a guide to scale.
Most of that spending goes on the jobs owners put off longest, from roofs and rewiring to tired bathrooms.
Frequently asked questions
References
- Valuation Office Agency, Council Tax: stock of properties 2026. Table CTSOP4.1, properties by build period for London, its boroughs and England at 31 March 2026. Published 24 September 2026
- HM Land Registry, UK House Price Index full file, August 2026. Average prices by property type for London and England, August 2016 to August 2026. Accessed 7 November 2026
- HM Land Registry, UK House Price Index England: August 2026. London annual change and first-time buyer and former owner occupier prices. Published 21 October 2026
- GOV.UK, Stamp Duty Land Tax: residential property rates. Standard rates, first-time buyer relief and the higher rate for additional properties, used for our stamp duty calculations. Accessed 7 November 2026
- MHCLG, Live tables on planning application statistics. PS2 open data for householder decisions by planning authority, July 1979 to June 2026, and Table PDR 1 for prior approvals, April to June 2026. Updated 24 September 2026
- Historic England, London conservation areas energy profile. Heritage Counts analysis by the UCL Energy Institute of conservation area numbers, homes, building age and EPC ratings. Accessed 7 November 2026
- ONS, Census 2021 table TS044: Accommodation type. Households by type of home, London and England. Accessed 7 November 2026
- ONS, Census 2021 table TS054: Tenure. Households by tenure, London and England. Accessed 7 November 2026
- ONS, Census 2021 table TS052: Occupancy rating for bedrooms. Overcrowded and under-occupied households, London and England. Accessed 7 November 2026
- ONS, Output in the construction industry: sub-national and sub-sector. Housing repair and maintenance output by region, current prices, 2010 to 2025. Released 13 August 2026
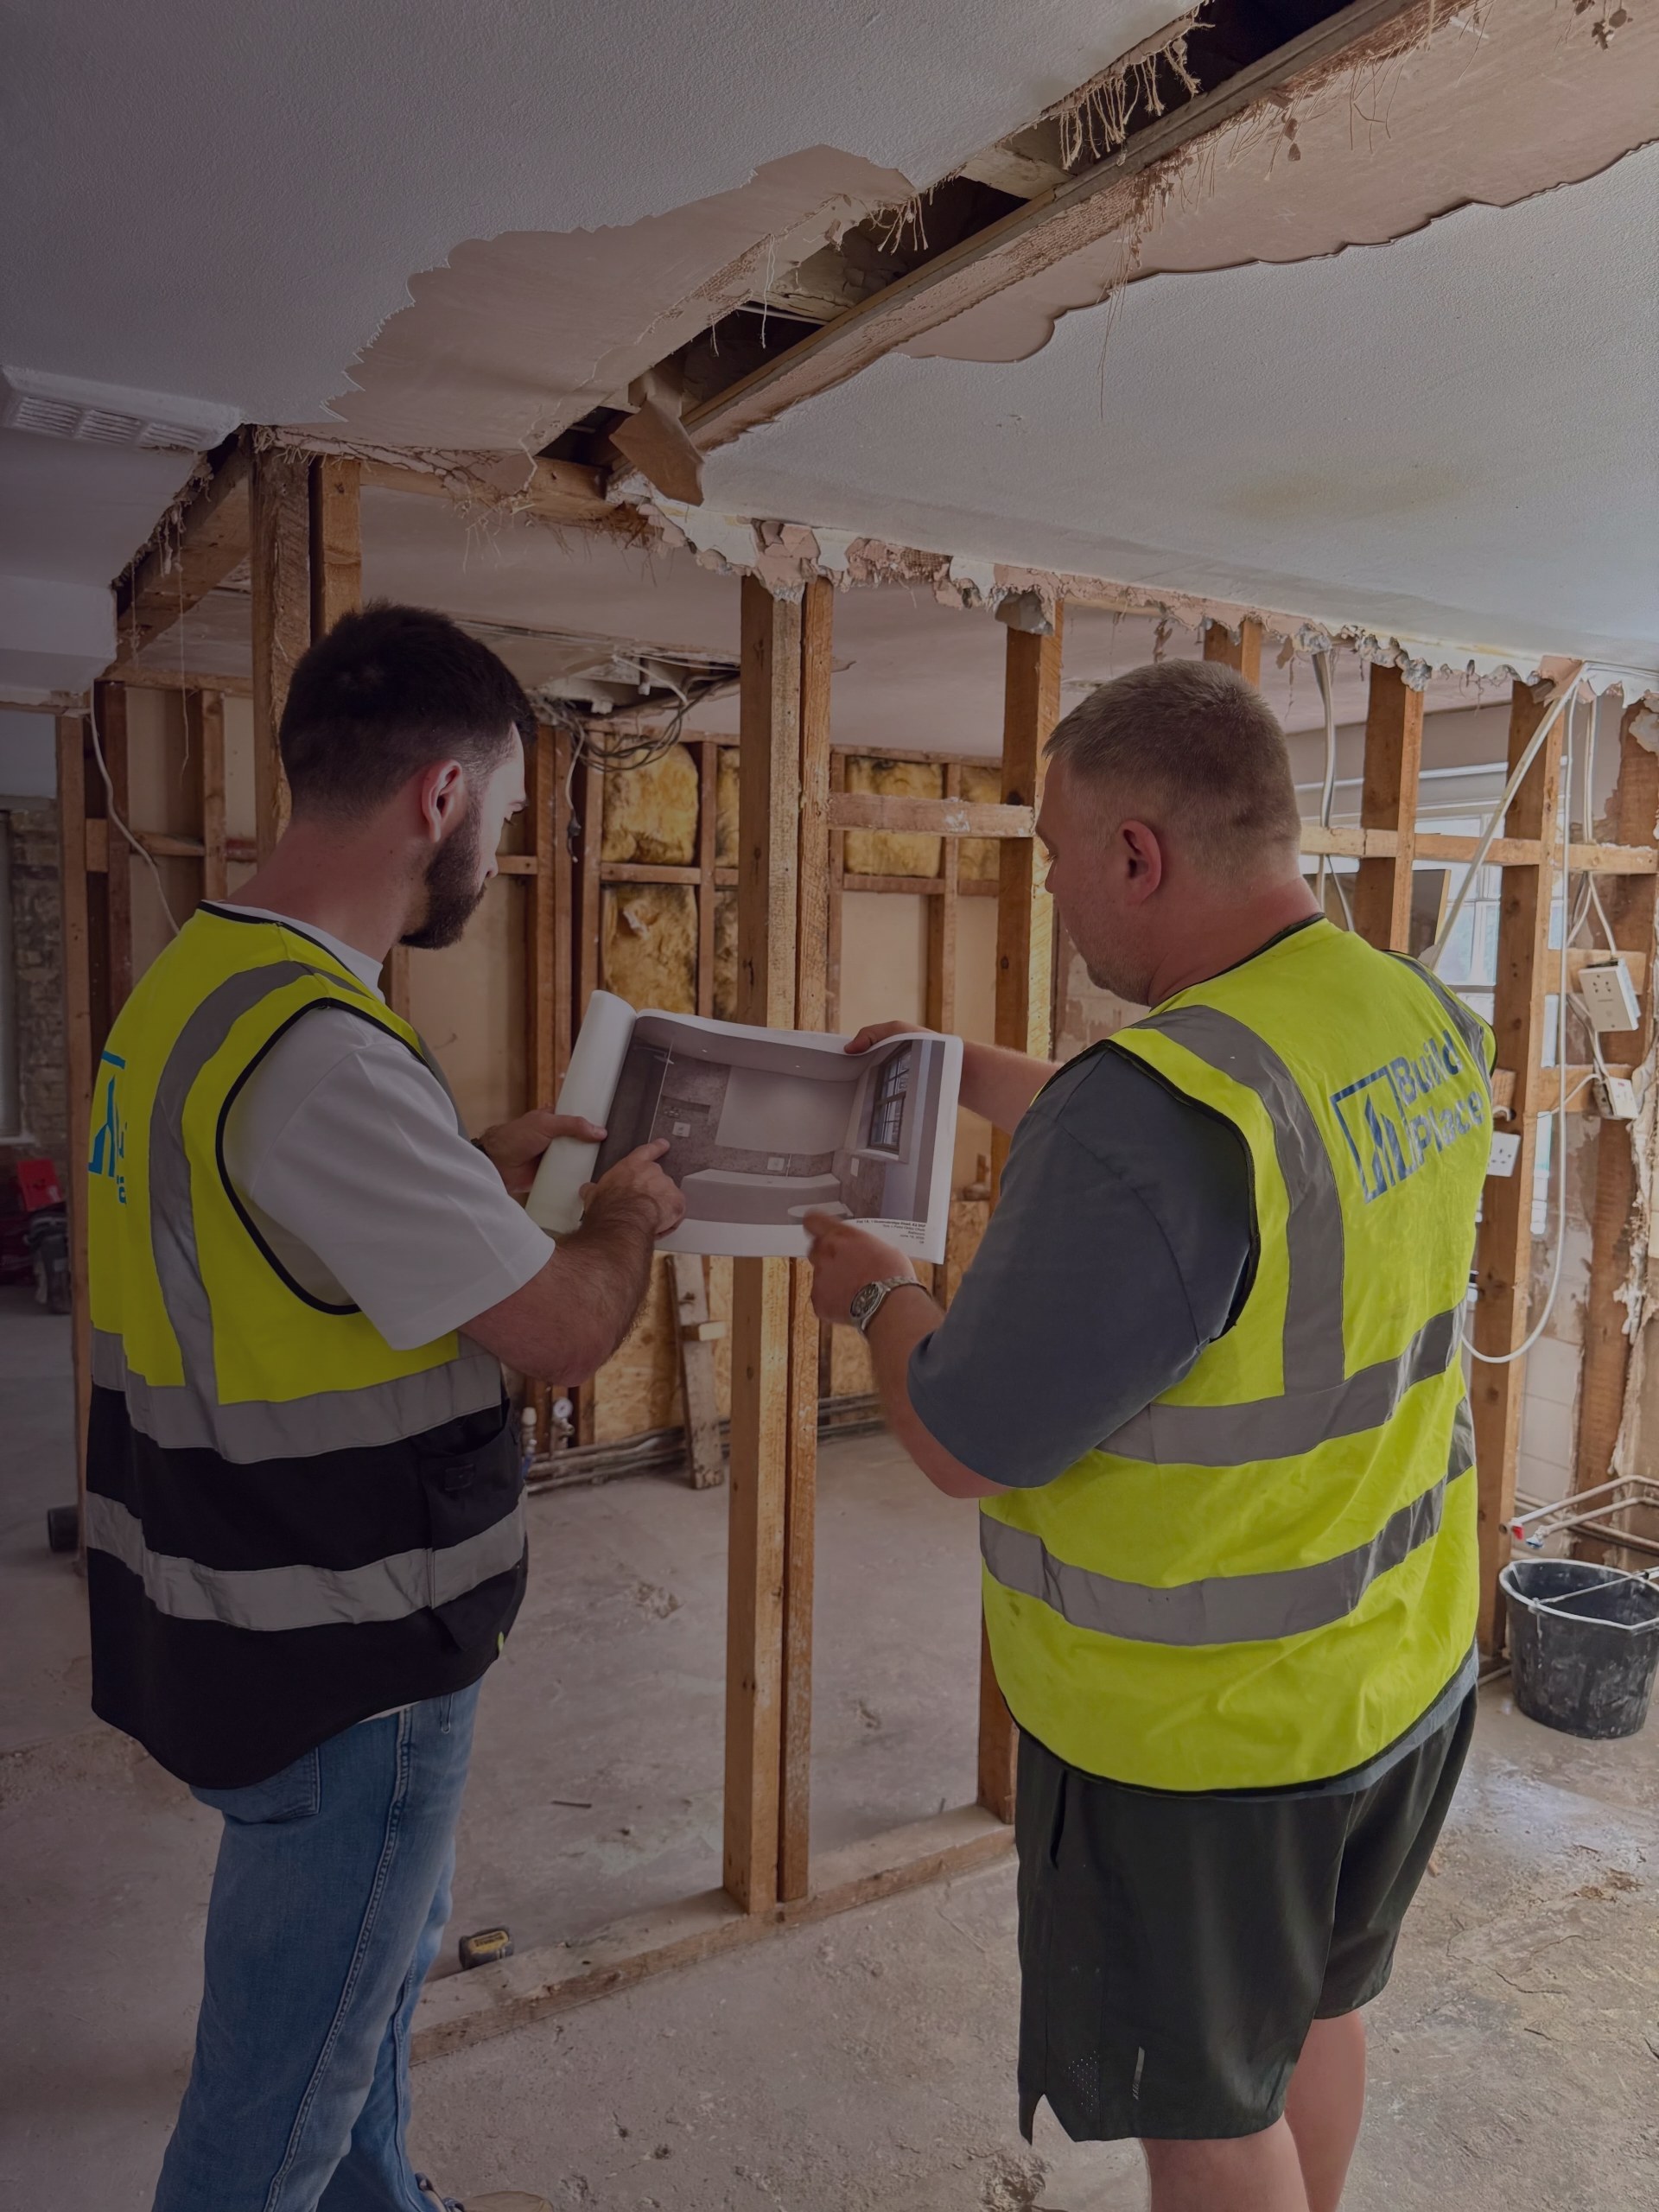
Thinking of renovating your London home?
Tell us about your home and what you want to change. We'll give you a free estimate, then up to three vetted builders quote against the same specification.