
Kensington housing statistics 2026
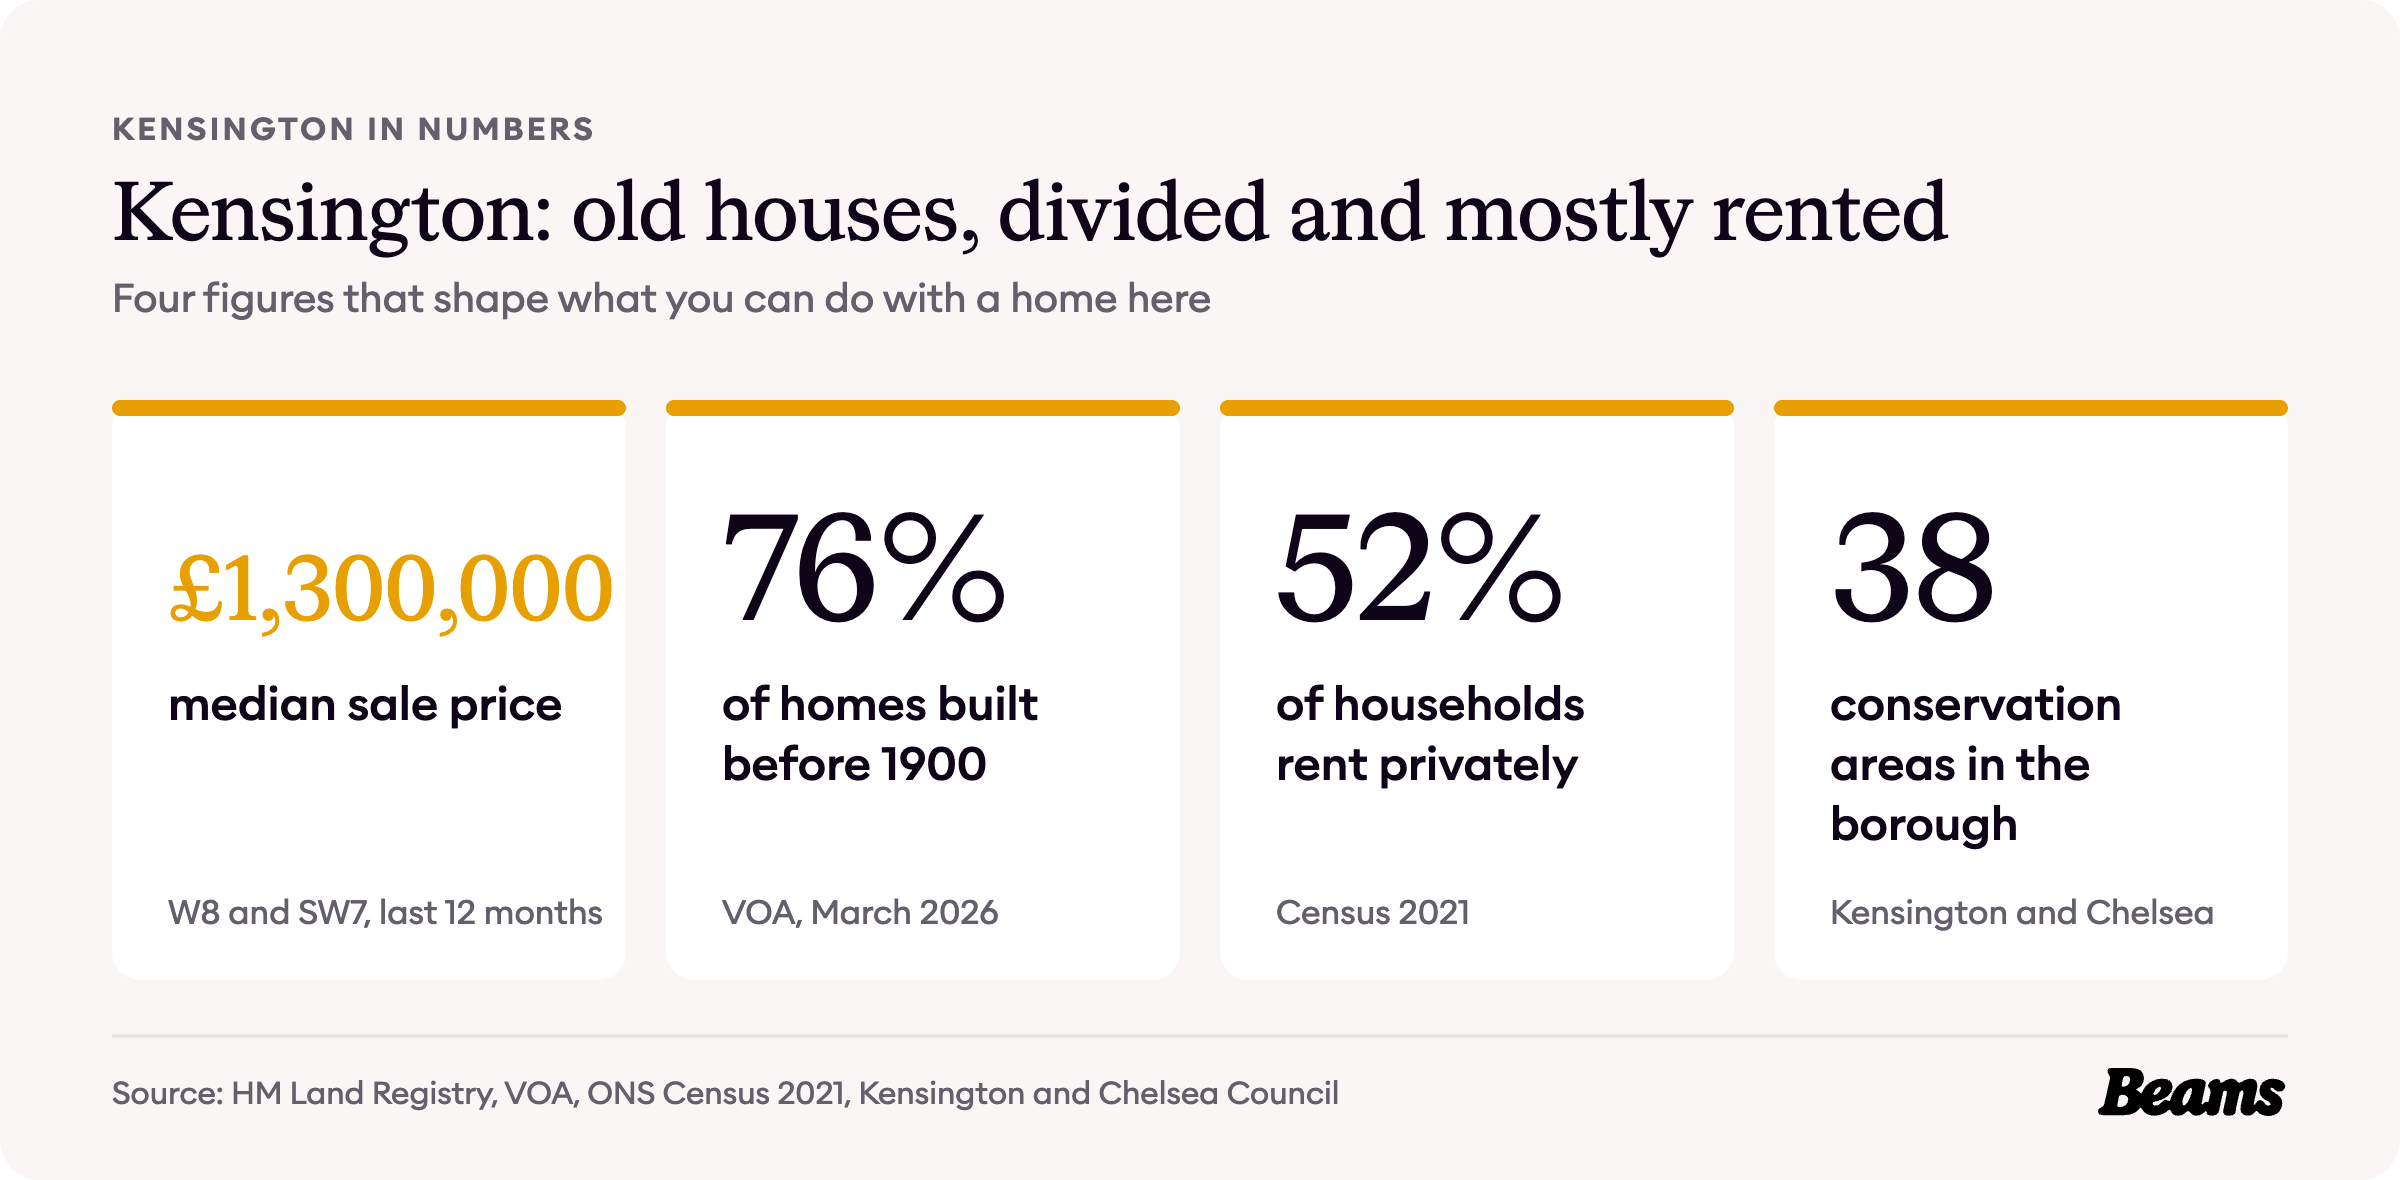
Kensington has been built over for more than three centuries, from a square set out in 1685 to the five-storey stucco houses of Queen's Gate, and three in four of its homes date from before 1900. Most of those houses are now divided, and most households rent. These are the numbers behind that story, through to the £1,300,000 median sale price in W8 and SW7 today.
Each figure below comes from an official source and carries its date, so you know what you are working with before you plan a home renovation in Kensington. The sources are numbered in brackets and listed in full at the end of the page.
How Kensington was built
Kensington Square came first. In 1685 Thomas Young set out a large part of his property to be built into a square, and house-building was under way by that summer, with Young taking on six houses himself. By about 1690 the north, east and south sides were largely complete, but the last two houses on the west side were not put up until 1736 to 1737 [1].
After 1851 came the stucco. Around Queen's Gate the essential house type was five storeys above a basement and three windows wide, sometimes with a garret storey in the roof, and the service rooms were kept in the basement [2]. Nos. 11 to 41 Queen's Gate Terrace went up in about 1857 [2].
These houses were built for big households. At the 1871 census, 297 houses in the area were occupied and none had yet been subdivided. In the 235 in normal occupation, the average house held 10.9 people, 6.2 of them servants. The Survey of London calls the later division of most of these houses into separate occupation the greatest change since, and says it has continued [3].
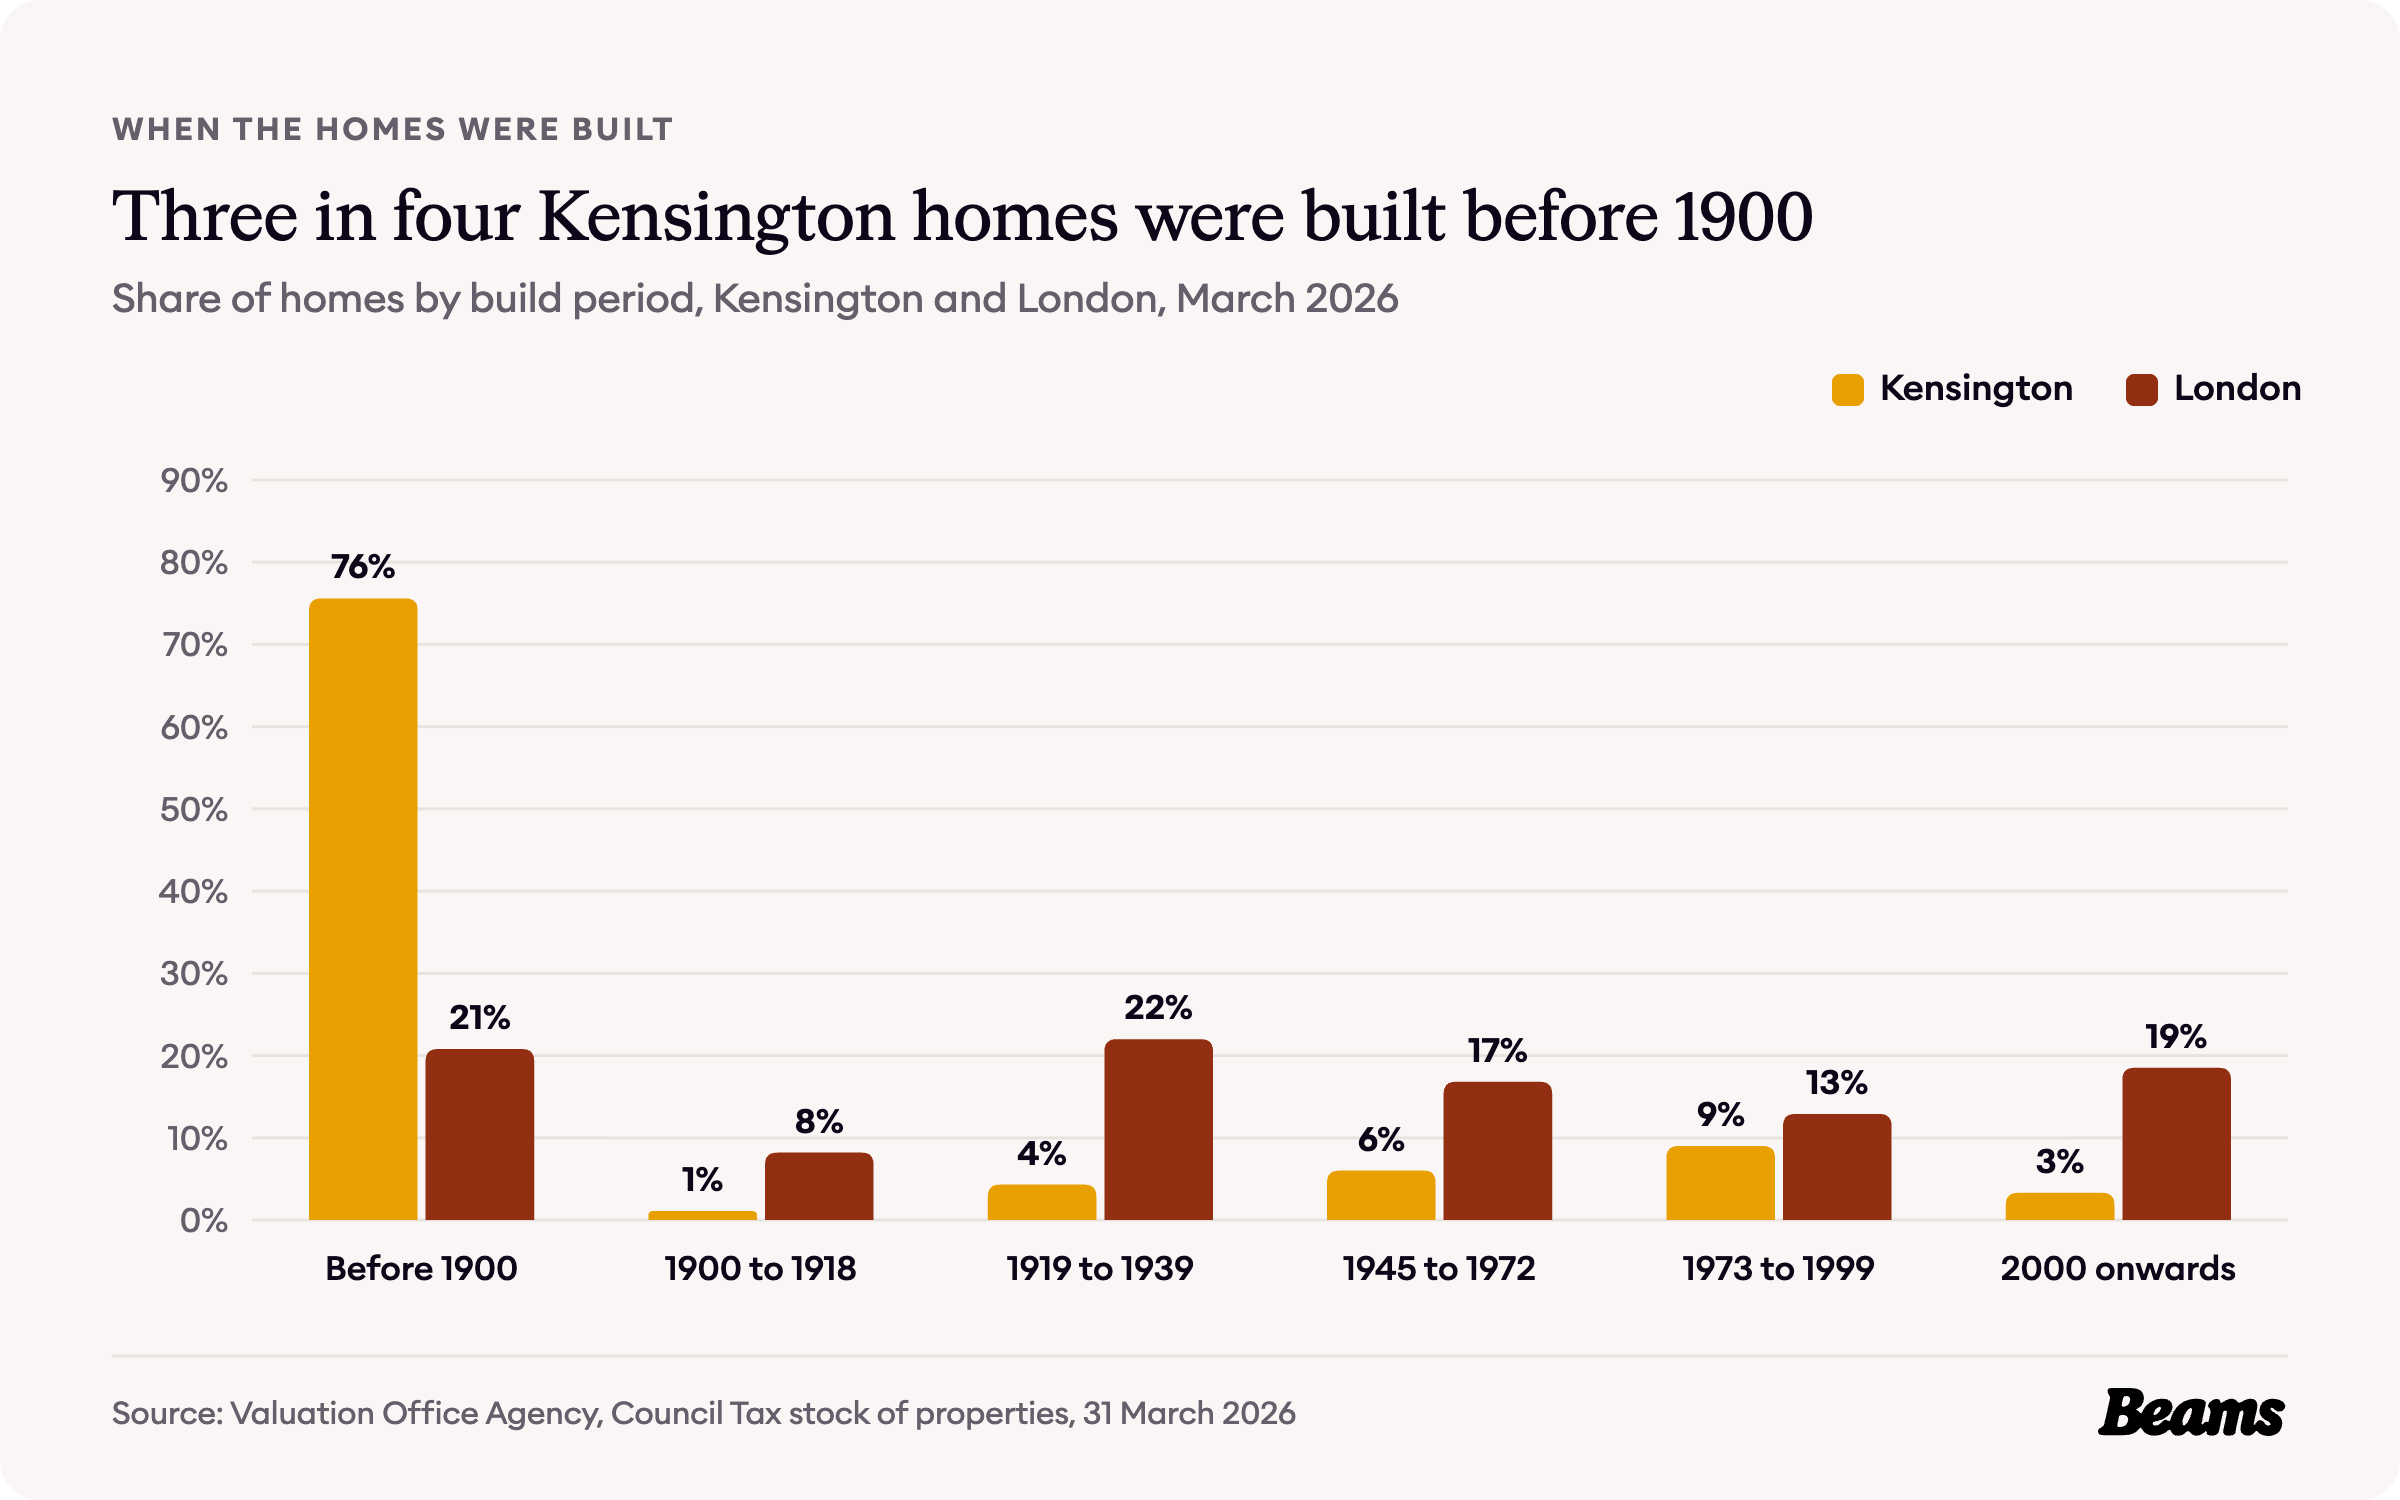
That history shows in the figures. The Valuation Office Agency counts 75.6% of the 22,180 homes in the Holland Park, Queen's Gate, Kensington Abingdon, Kensington Gardens and South Kensington areas as built before 1900, more than three and a half times London's 20.8%. Only 4.3% went up between the wars and 3.3% since 2000, against 22.0% and 18.5% for London [4].
Tall houses with a garret or unused roof space above the top floor are where a loft conversion in Kensington can add a room, if the conservation area rules allow a change to the roof.
How Kensington households live
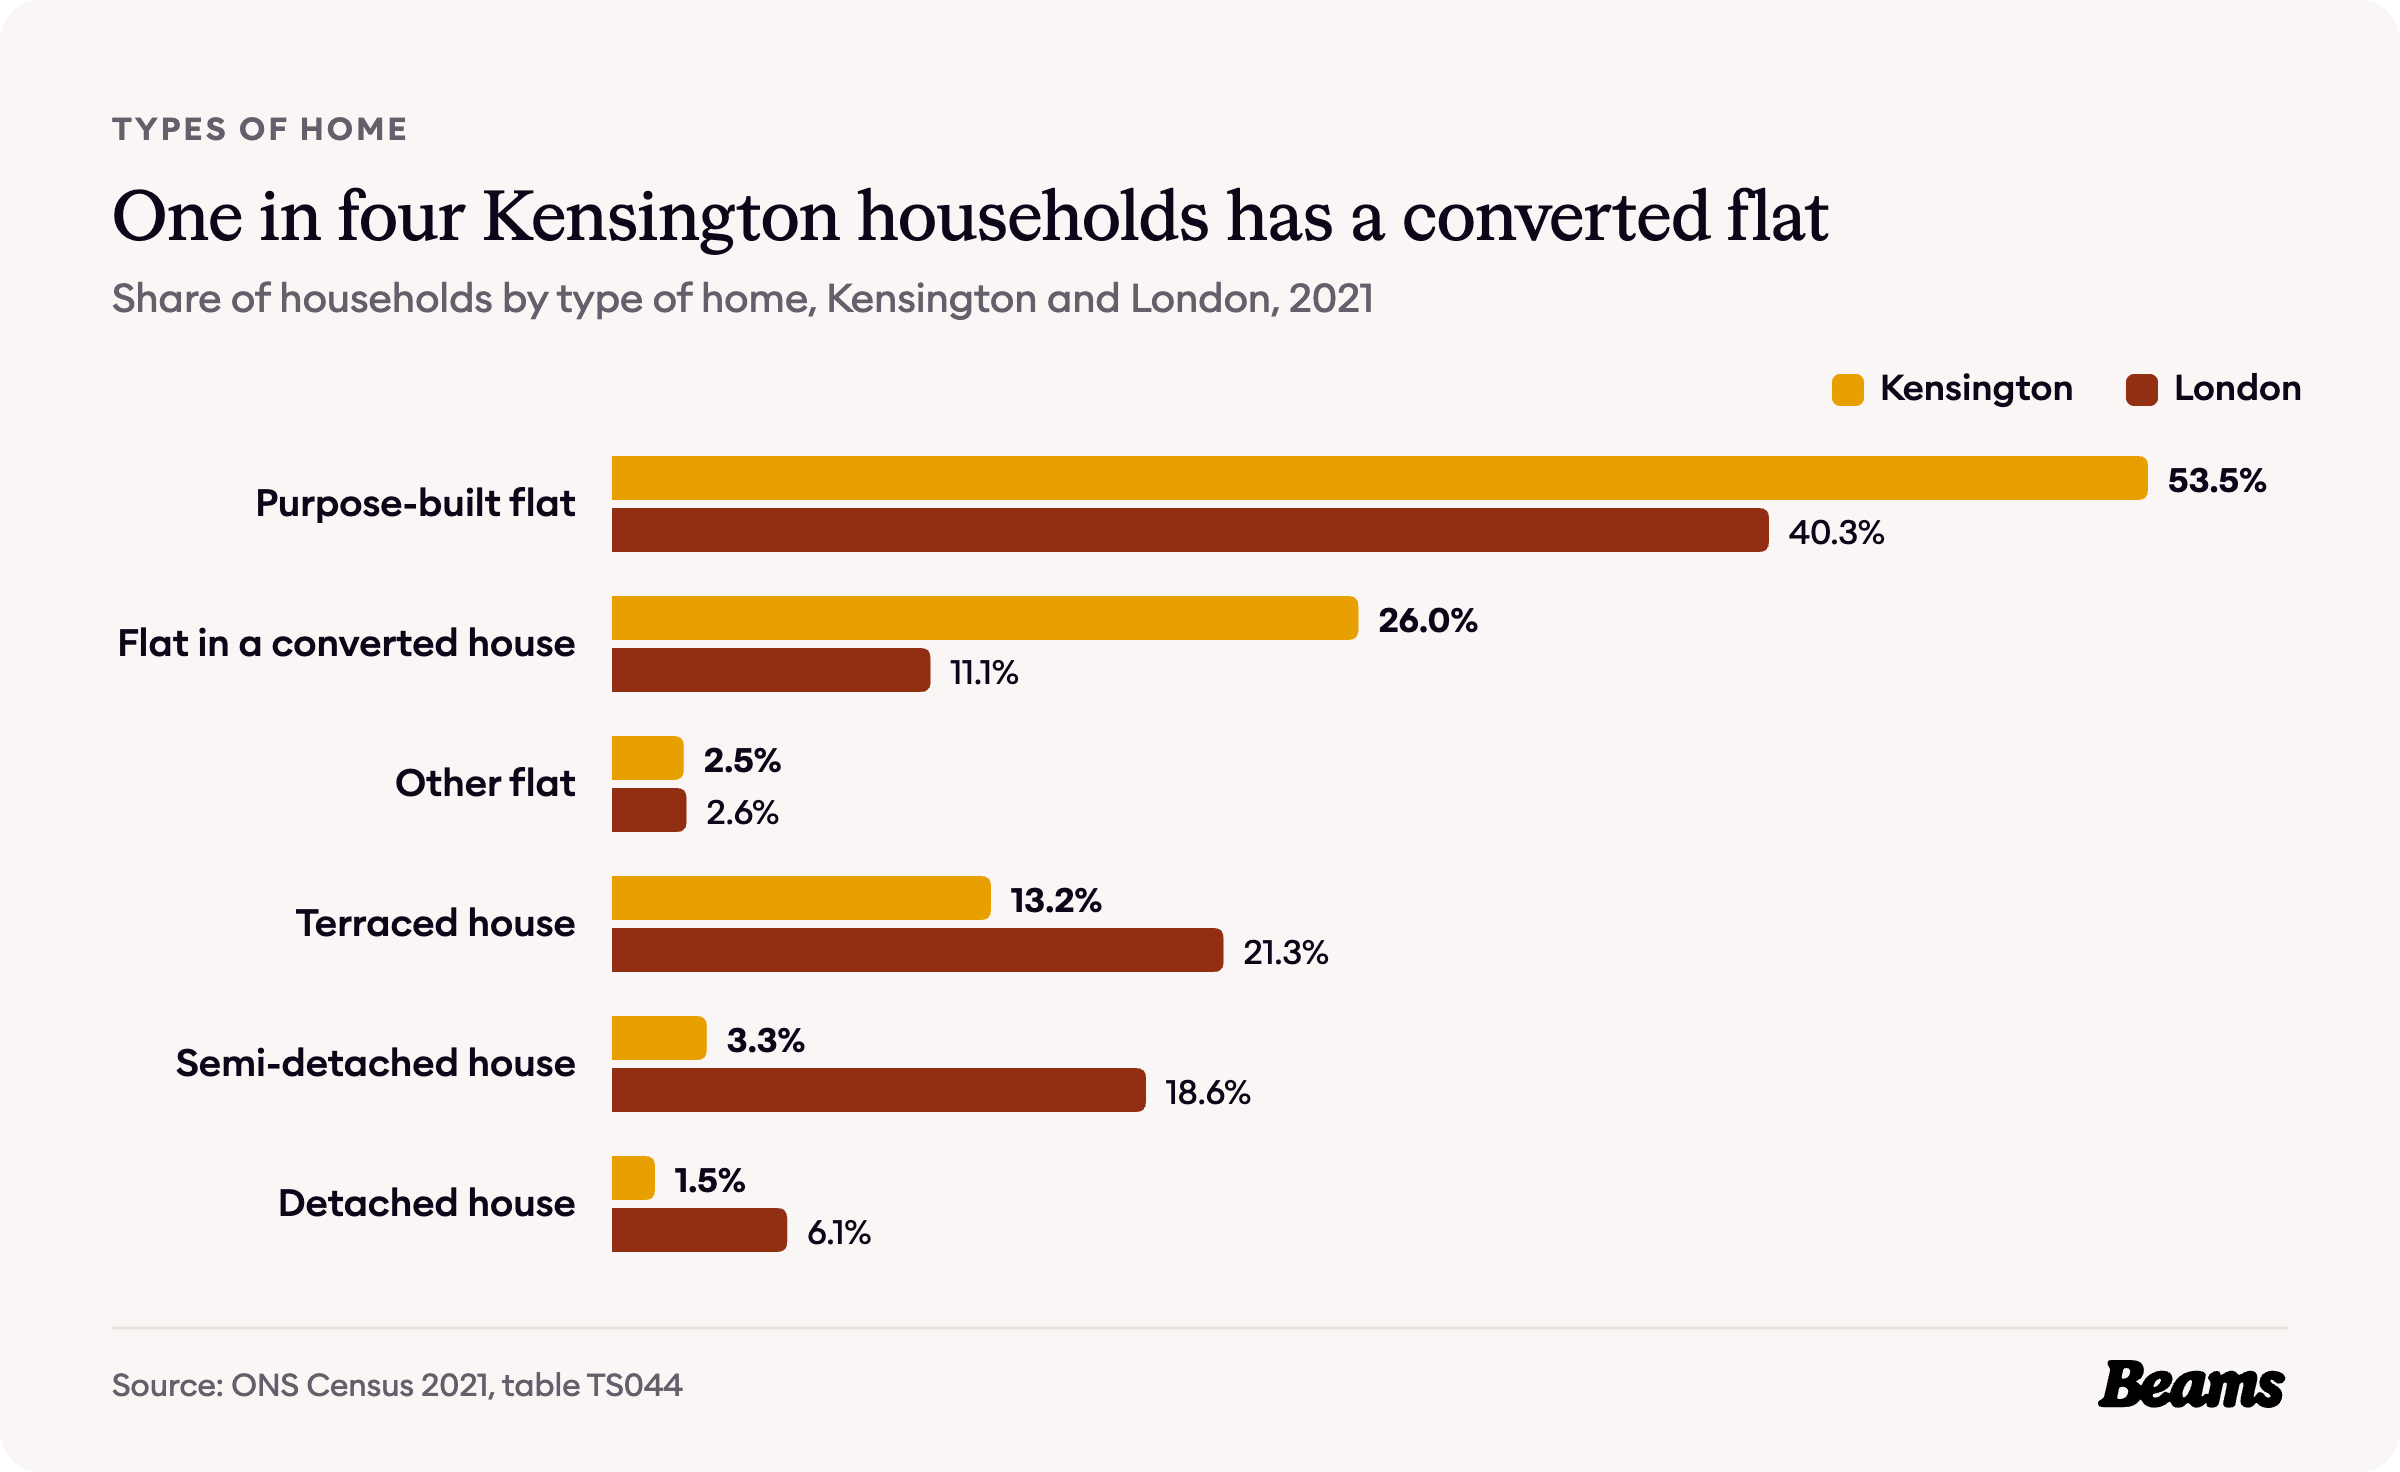
The 2021 Census counted 15,791 households in the five Kensington areas. 53.5% live in a purpose-built flat and 26.0% in a flat inside a converted house, more than twice the London share of 11.1% [5].
In all, 82.0% of households live in a flat, against 54.0% across London. Only 18.0% live in a house, most of them terraced: 13.2% in a terrace, 3.3% in a semi-detached house and 1.5% in a detached one [5].
A flat on one floor of a house built for a family and its servants seldom has the kitchen in the obvious place, so a kitchen renovation in Kensington often starts with deciding where the kitchen should go.
Who owns Kensington's homes
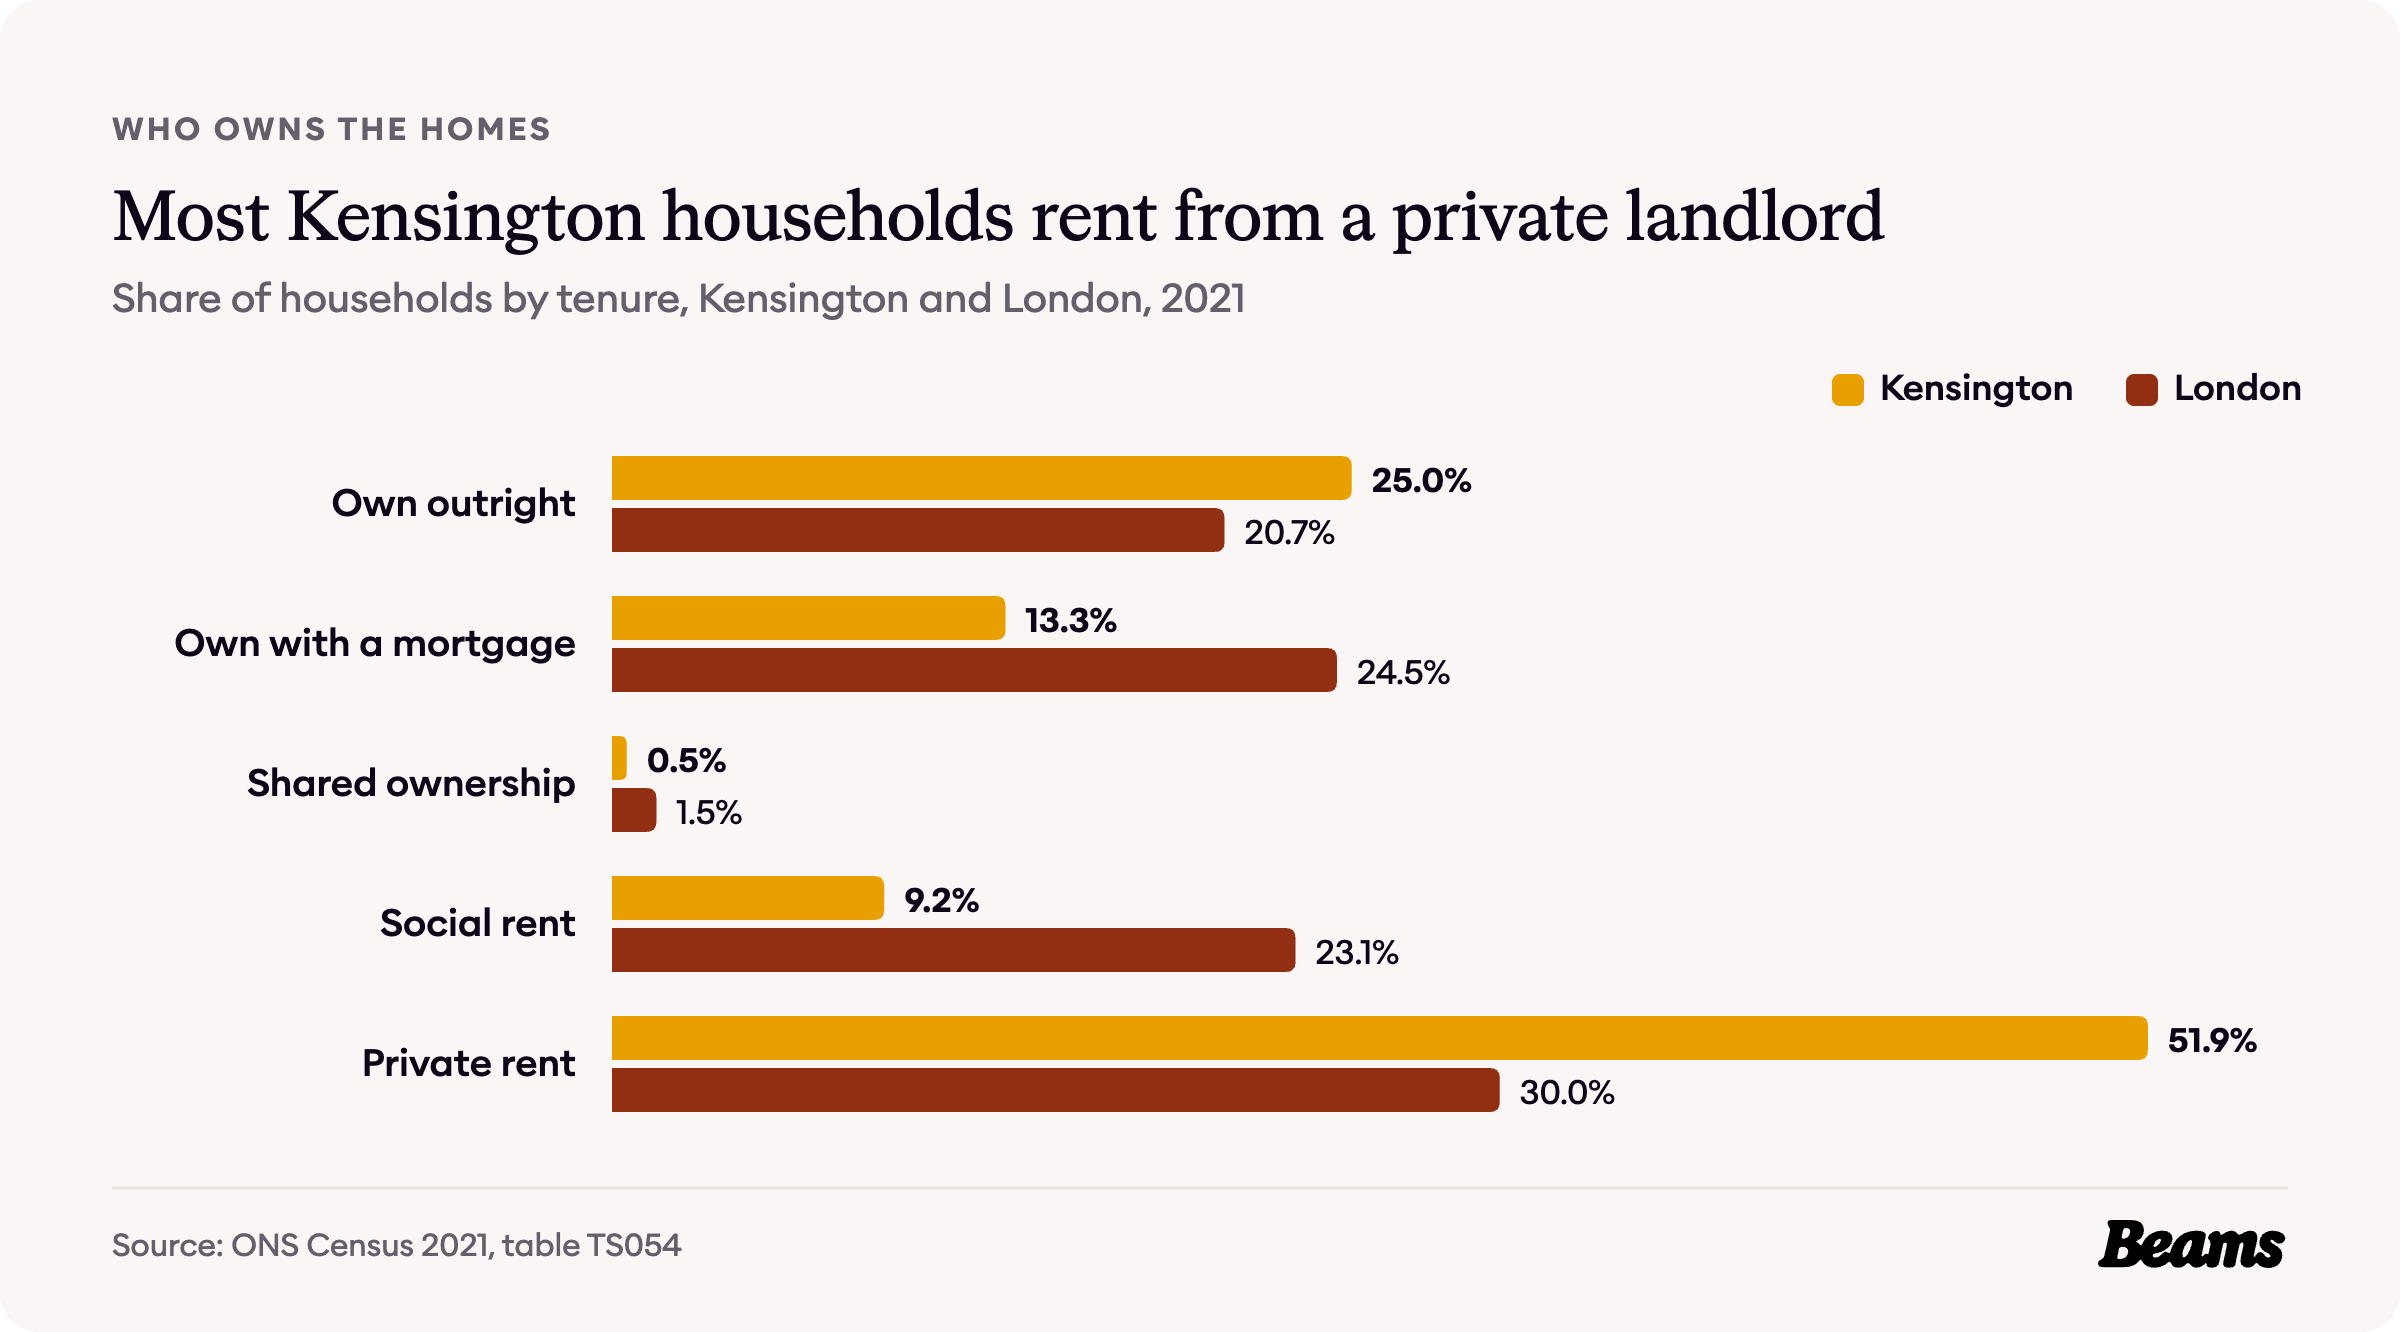
In Kensington, most households rent from a private landlord: 51.9%, against 30.0% across London [6].
Owners make up 38.3% of households, 25.0% outright and 13.3% with a mortgage, against 45.2% for London. Social renting covers 9.2%, less than half the London figure of 23.1% [6].
What a Kensington home costs
The figures on this page cover three different areas, so it helps to know which is which. The UK House Price Index and the rent figures cover the whole Royal Borough of Kensington and Chelsea. The census and Valuation Office figures cover the Holland Park, Queen's Gate, Kensington Abingdon, Kensington Gardens and South Kensington areas, and the sale prices cover the W8 and SW7 postcode districts.
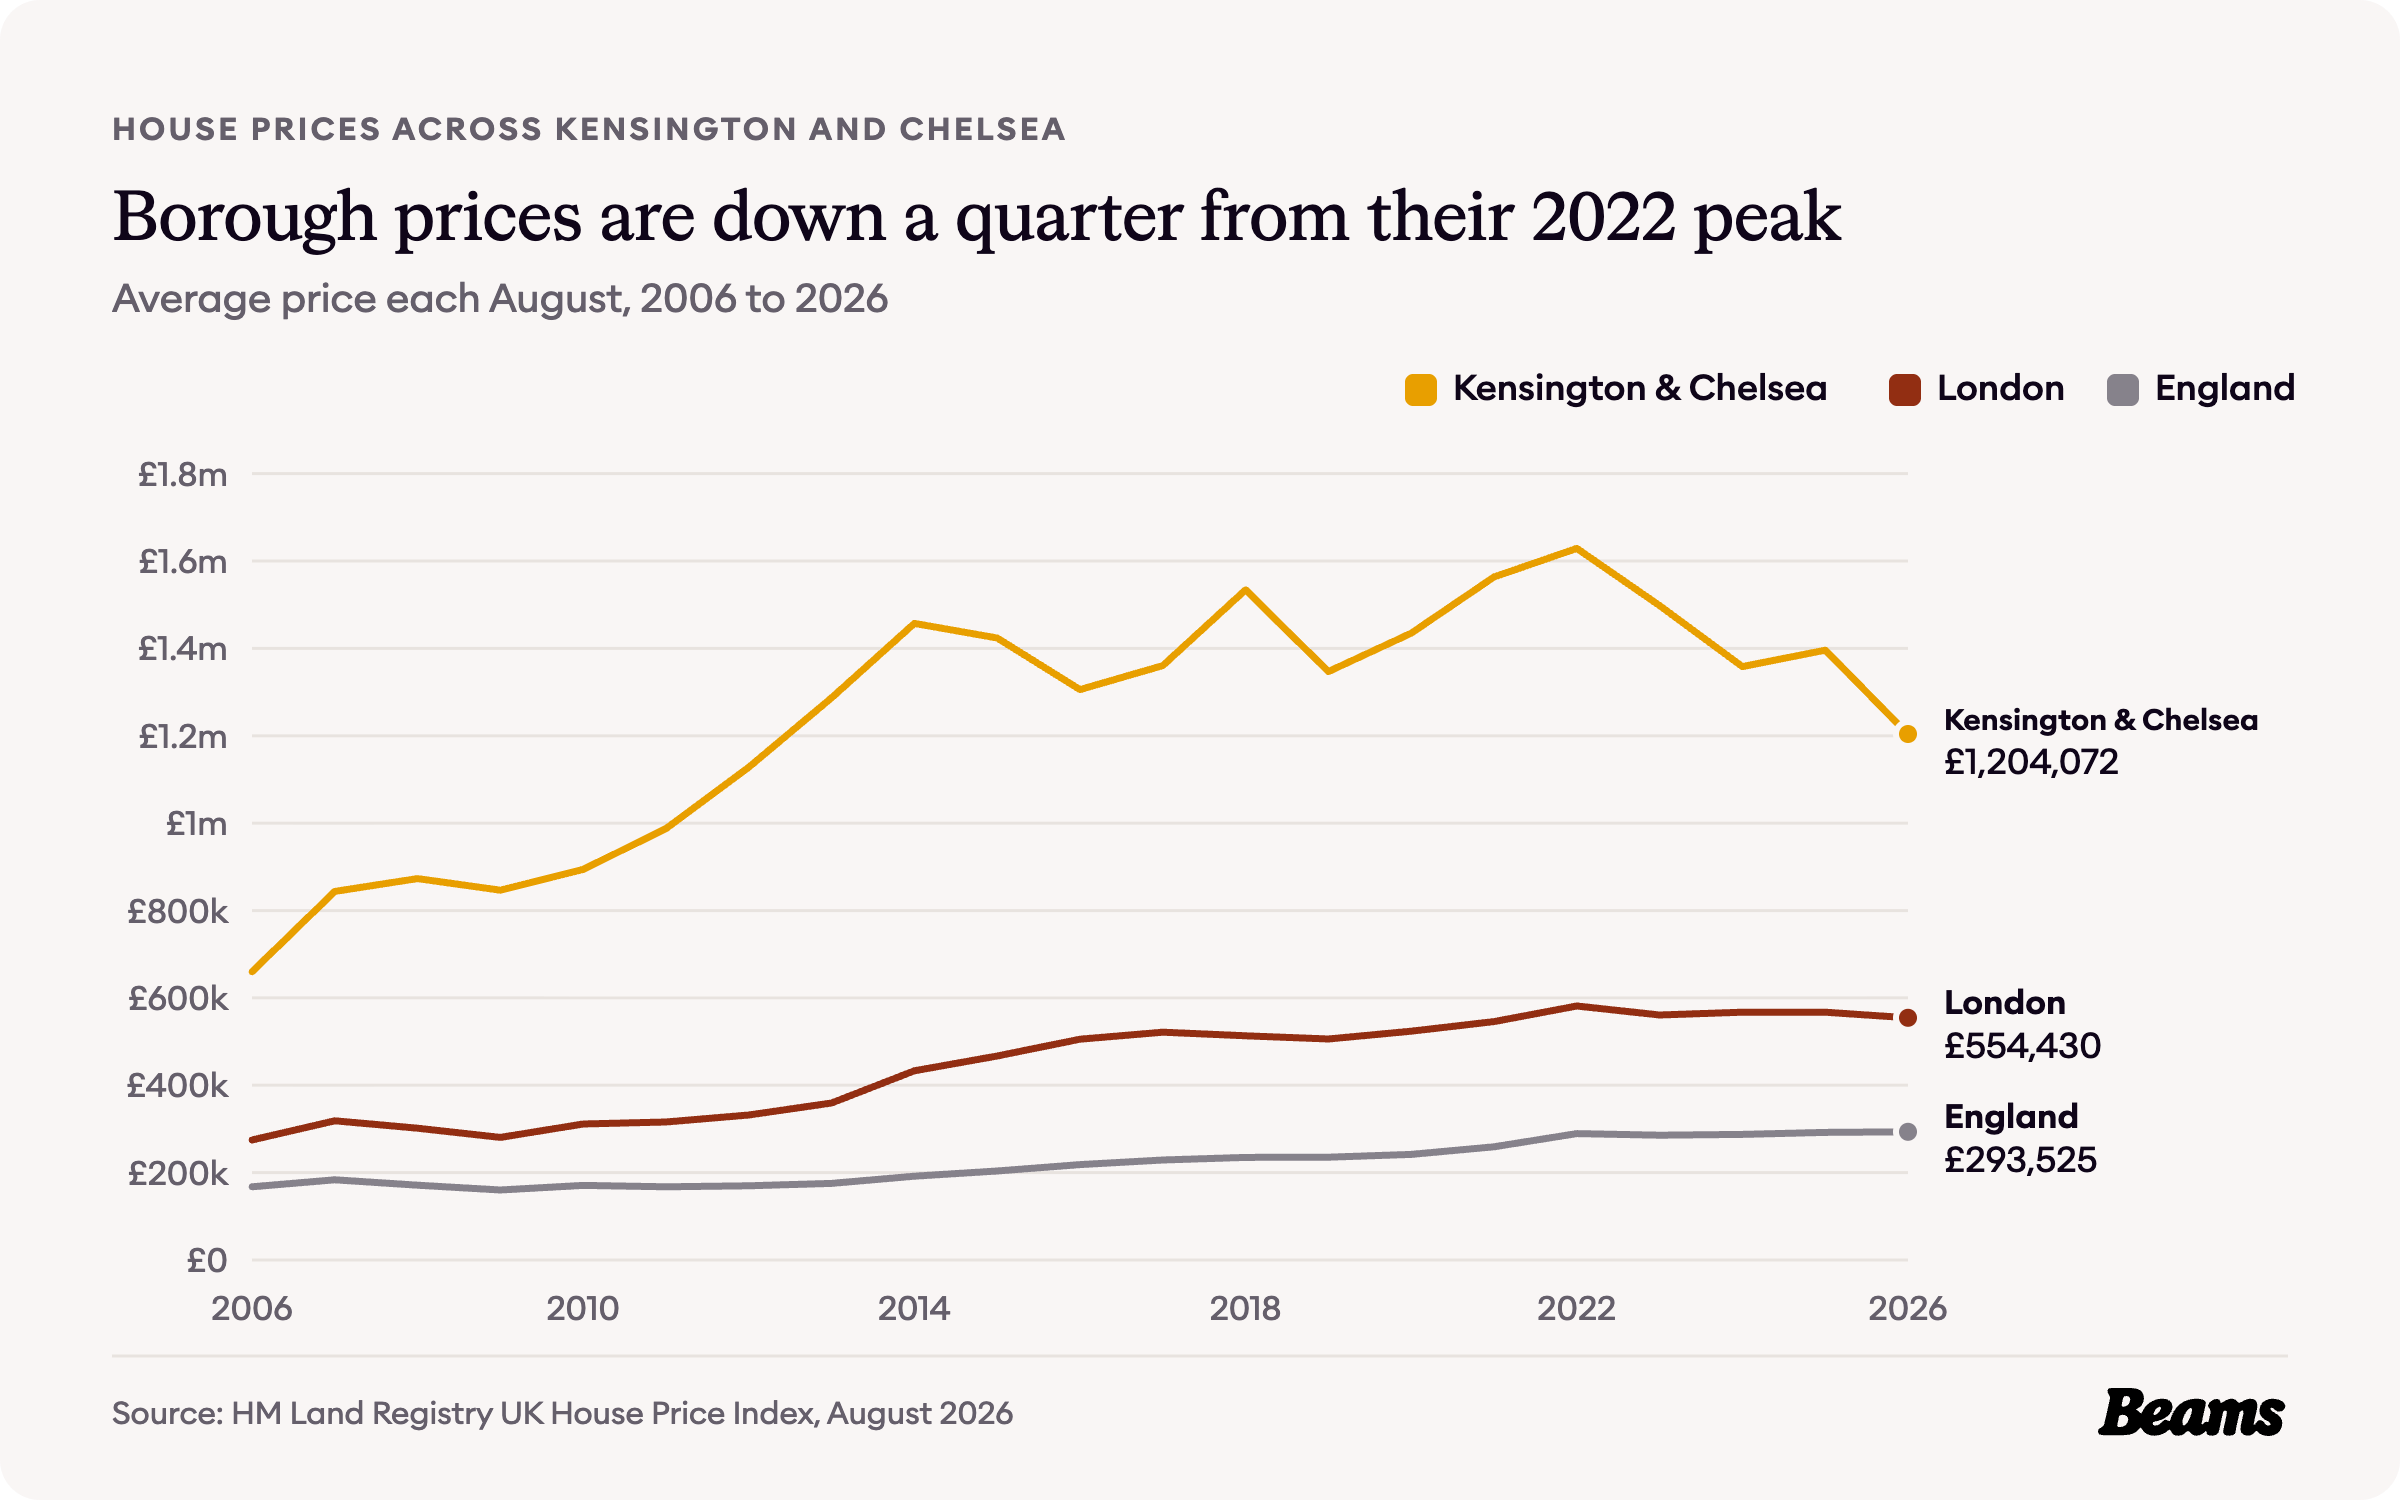
Across Kensington and Chelsea, the average home cost £1,204,072 in August 2026, 13.8% less than a year earlier [7]. Over the same year the London average of £554,430 fell 2.2%. The borough average is 2.2 times London's and 4.1 times the England average of £293,525 [8].
In August 2006 the borough average was £659,832. It rose to a peak of £1,628,847 in August 2022, close to two and a half times the 2006 figure, and has since dropped back to 1.8 times it [8].
Flats, terraces and the next rung
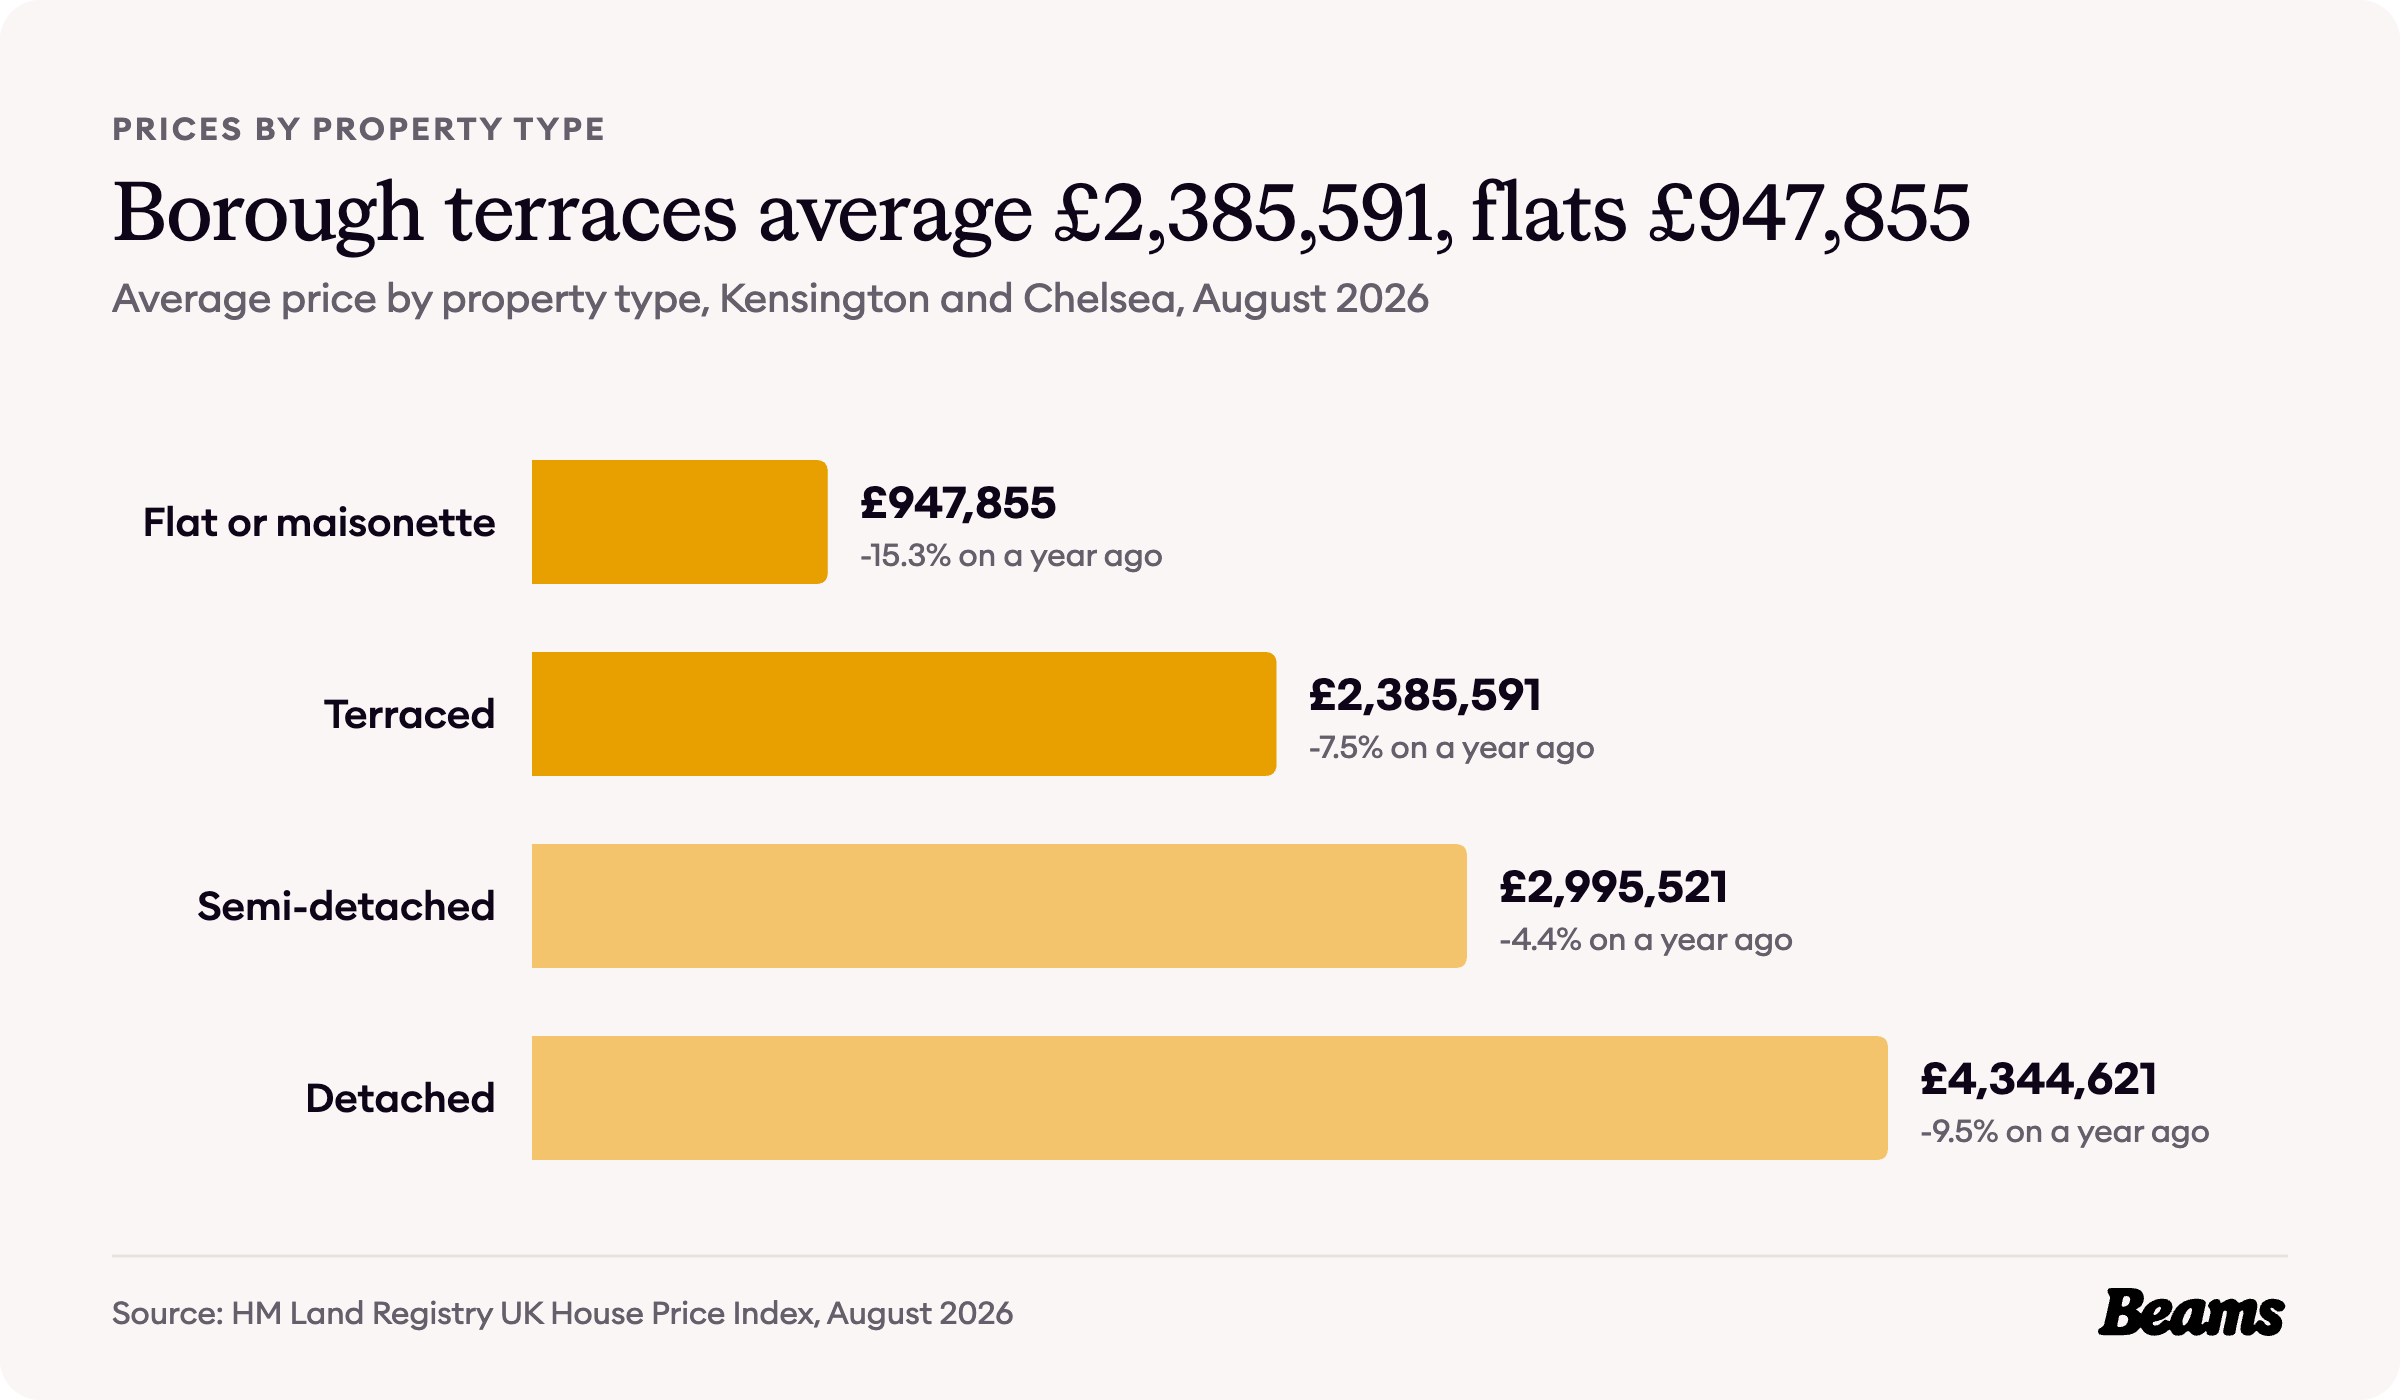
A flat or maisonette in the borough averaged £947,855 in August 2026, 15.3% less than a year before, while a terraced house averaged £2,385,591, 7.5% less [7]. The difference between the two is £1,437,736. Semi-detached houses averaged £2,995,521 and detached houses £4,344,621 [7].
First-time buyers paid an average of £1,020,436, so the average first purchase in the borough costs more than £1 million, while owners moving home paid £1,436,238 [7]. Fewer than one Kensington household in five lives in a house. For those that do, a house extension in Kensington adds room without paying the gap to the next rung of the ladder.
What homes sell for in W8 and SW7
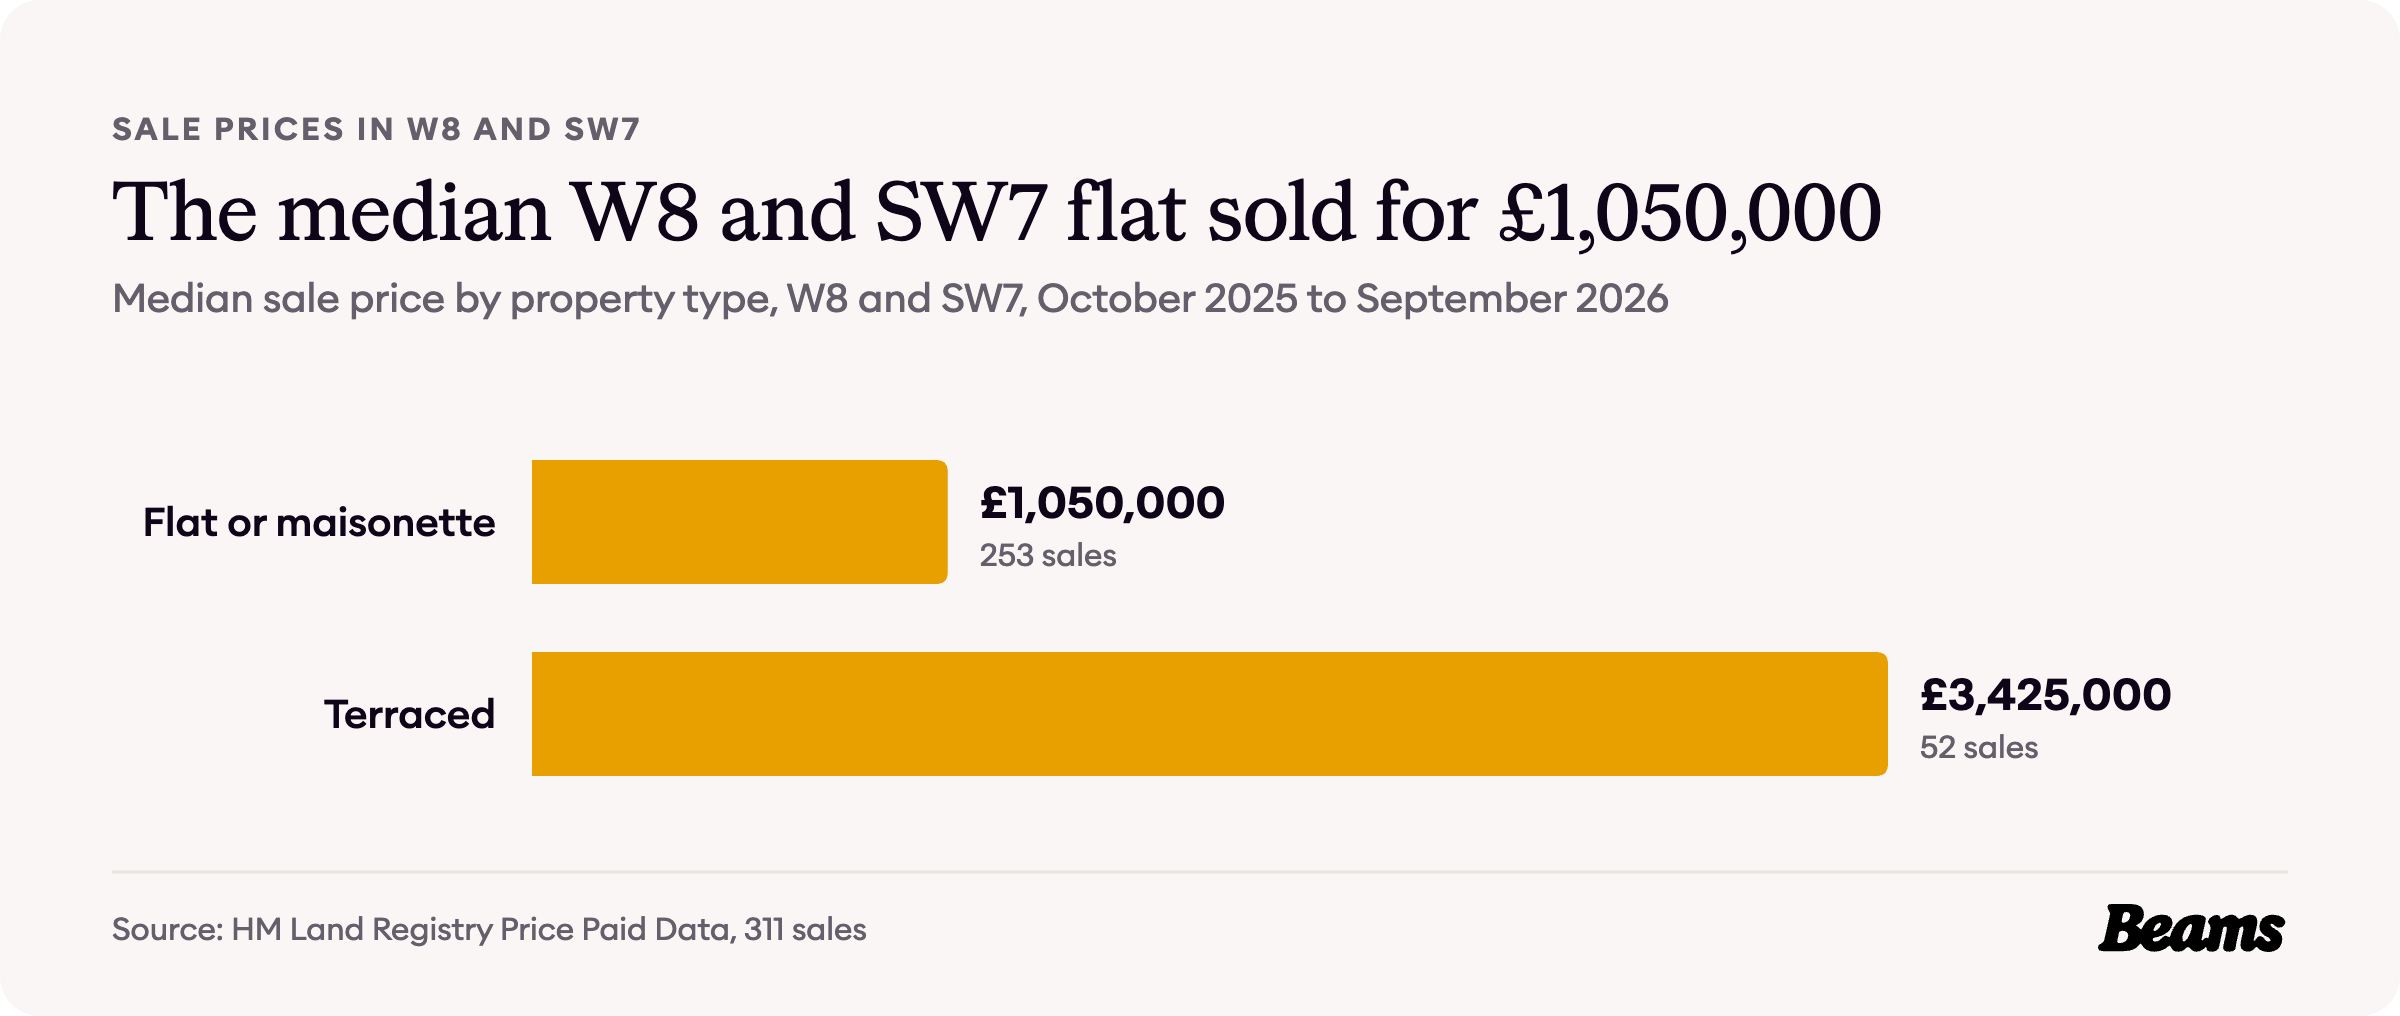
HM Land Registry records 311 sales in the W8 and SW7 postcode districts between October 2025 and September 2026, at a median of £1,300,000 [9]. Flats made up 253 of them, about four in five, at a median of £1,050,000, and the 52 terraced houses sold had a median of £3,425,000 [9].
A median is the middle sale in each group, so it is not directly comparable with the borough averages above. It does show that the middle flat sale in W8 and SW7 was above £1 million, and that the median terrace sold for 3.3 times the median flat.
Renting in Kensington
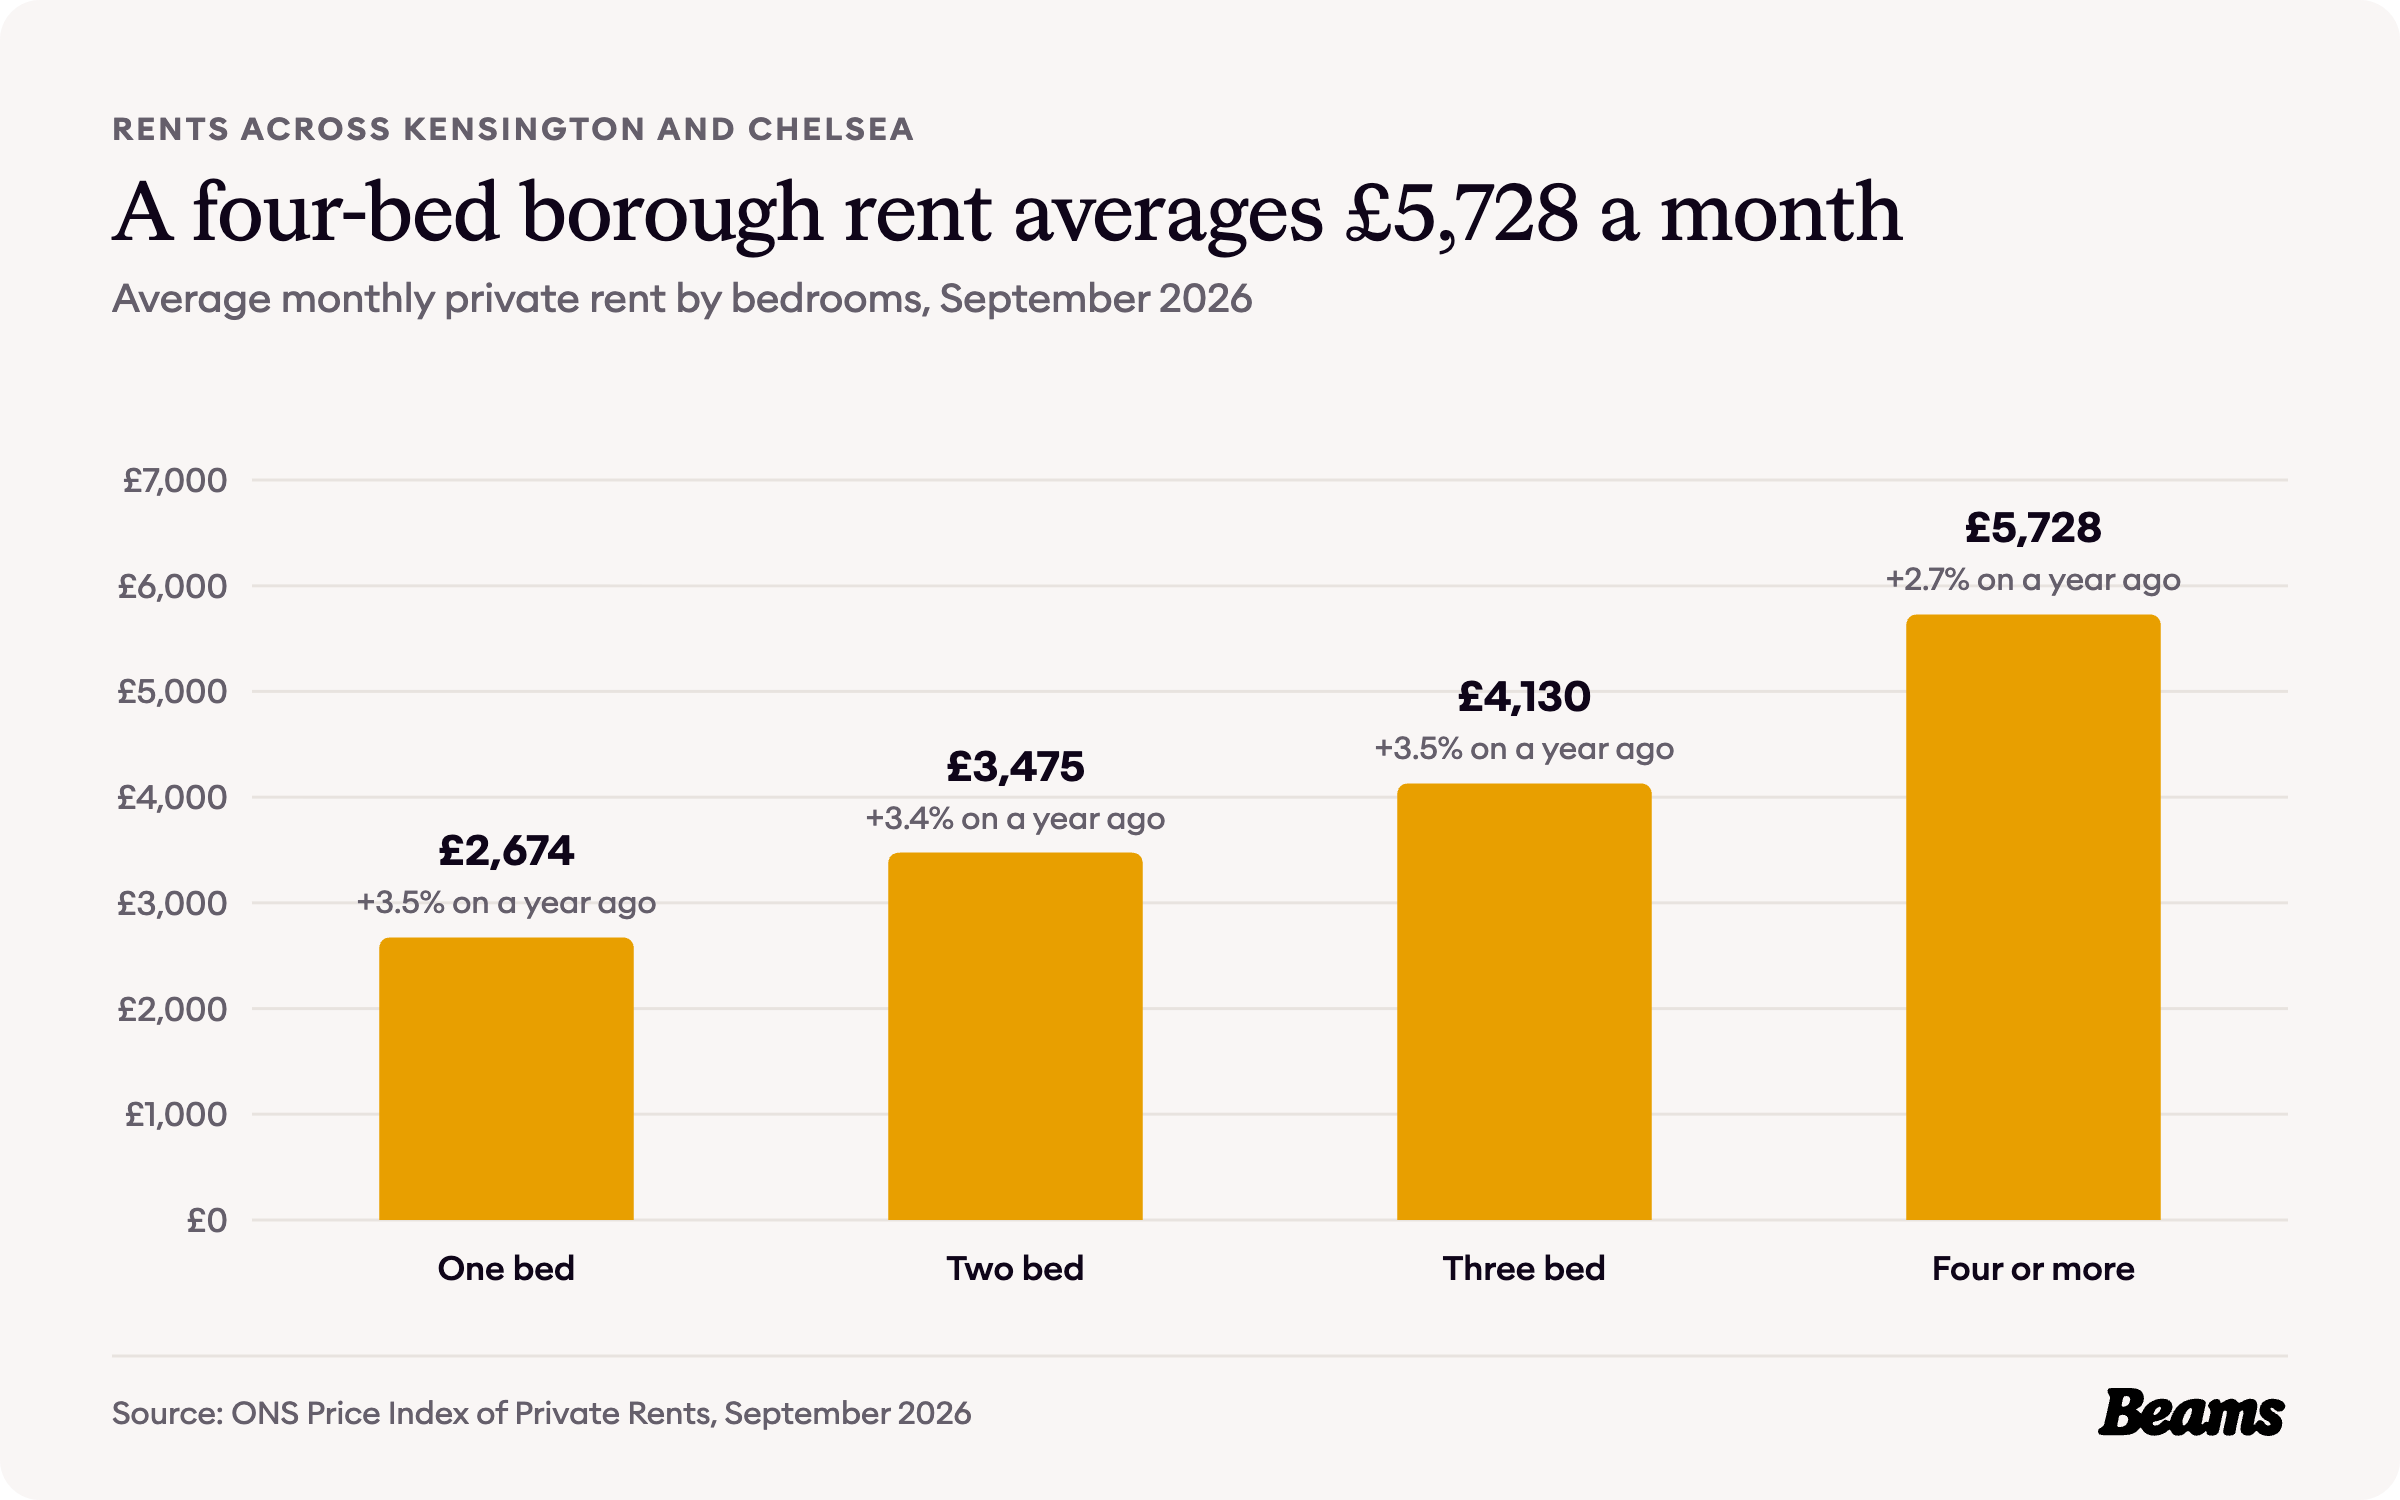
The ONS publishes rents for the borough as a whole. Across Kensington and Chelsea the average private rent was £3,739 a month in September 2026, 3.0% higher than a year before [7]. Rents rise steeply with size: a one-bedroom home averaged £2,674 a month, a three-bedroom home £4,130 and a home with four or more bedrooms £5,728 [7].
With 51.9% of Kensington households renting privately [6], the state of a rented flat matters to more than half the neighbourhood, and a bathroom renovation in Kensington between tenancies is one of the simplest ways for a landlord to keep a flat competitive.
Council Tax bands in Kensington
A home's Council Tax band in England is based on what it would have sold for on the open market on 1 April 1991 [10], which makes the bands a rough guide to the size and value of the housing.
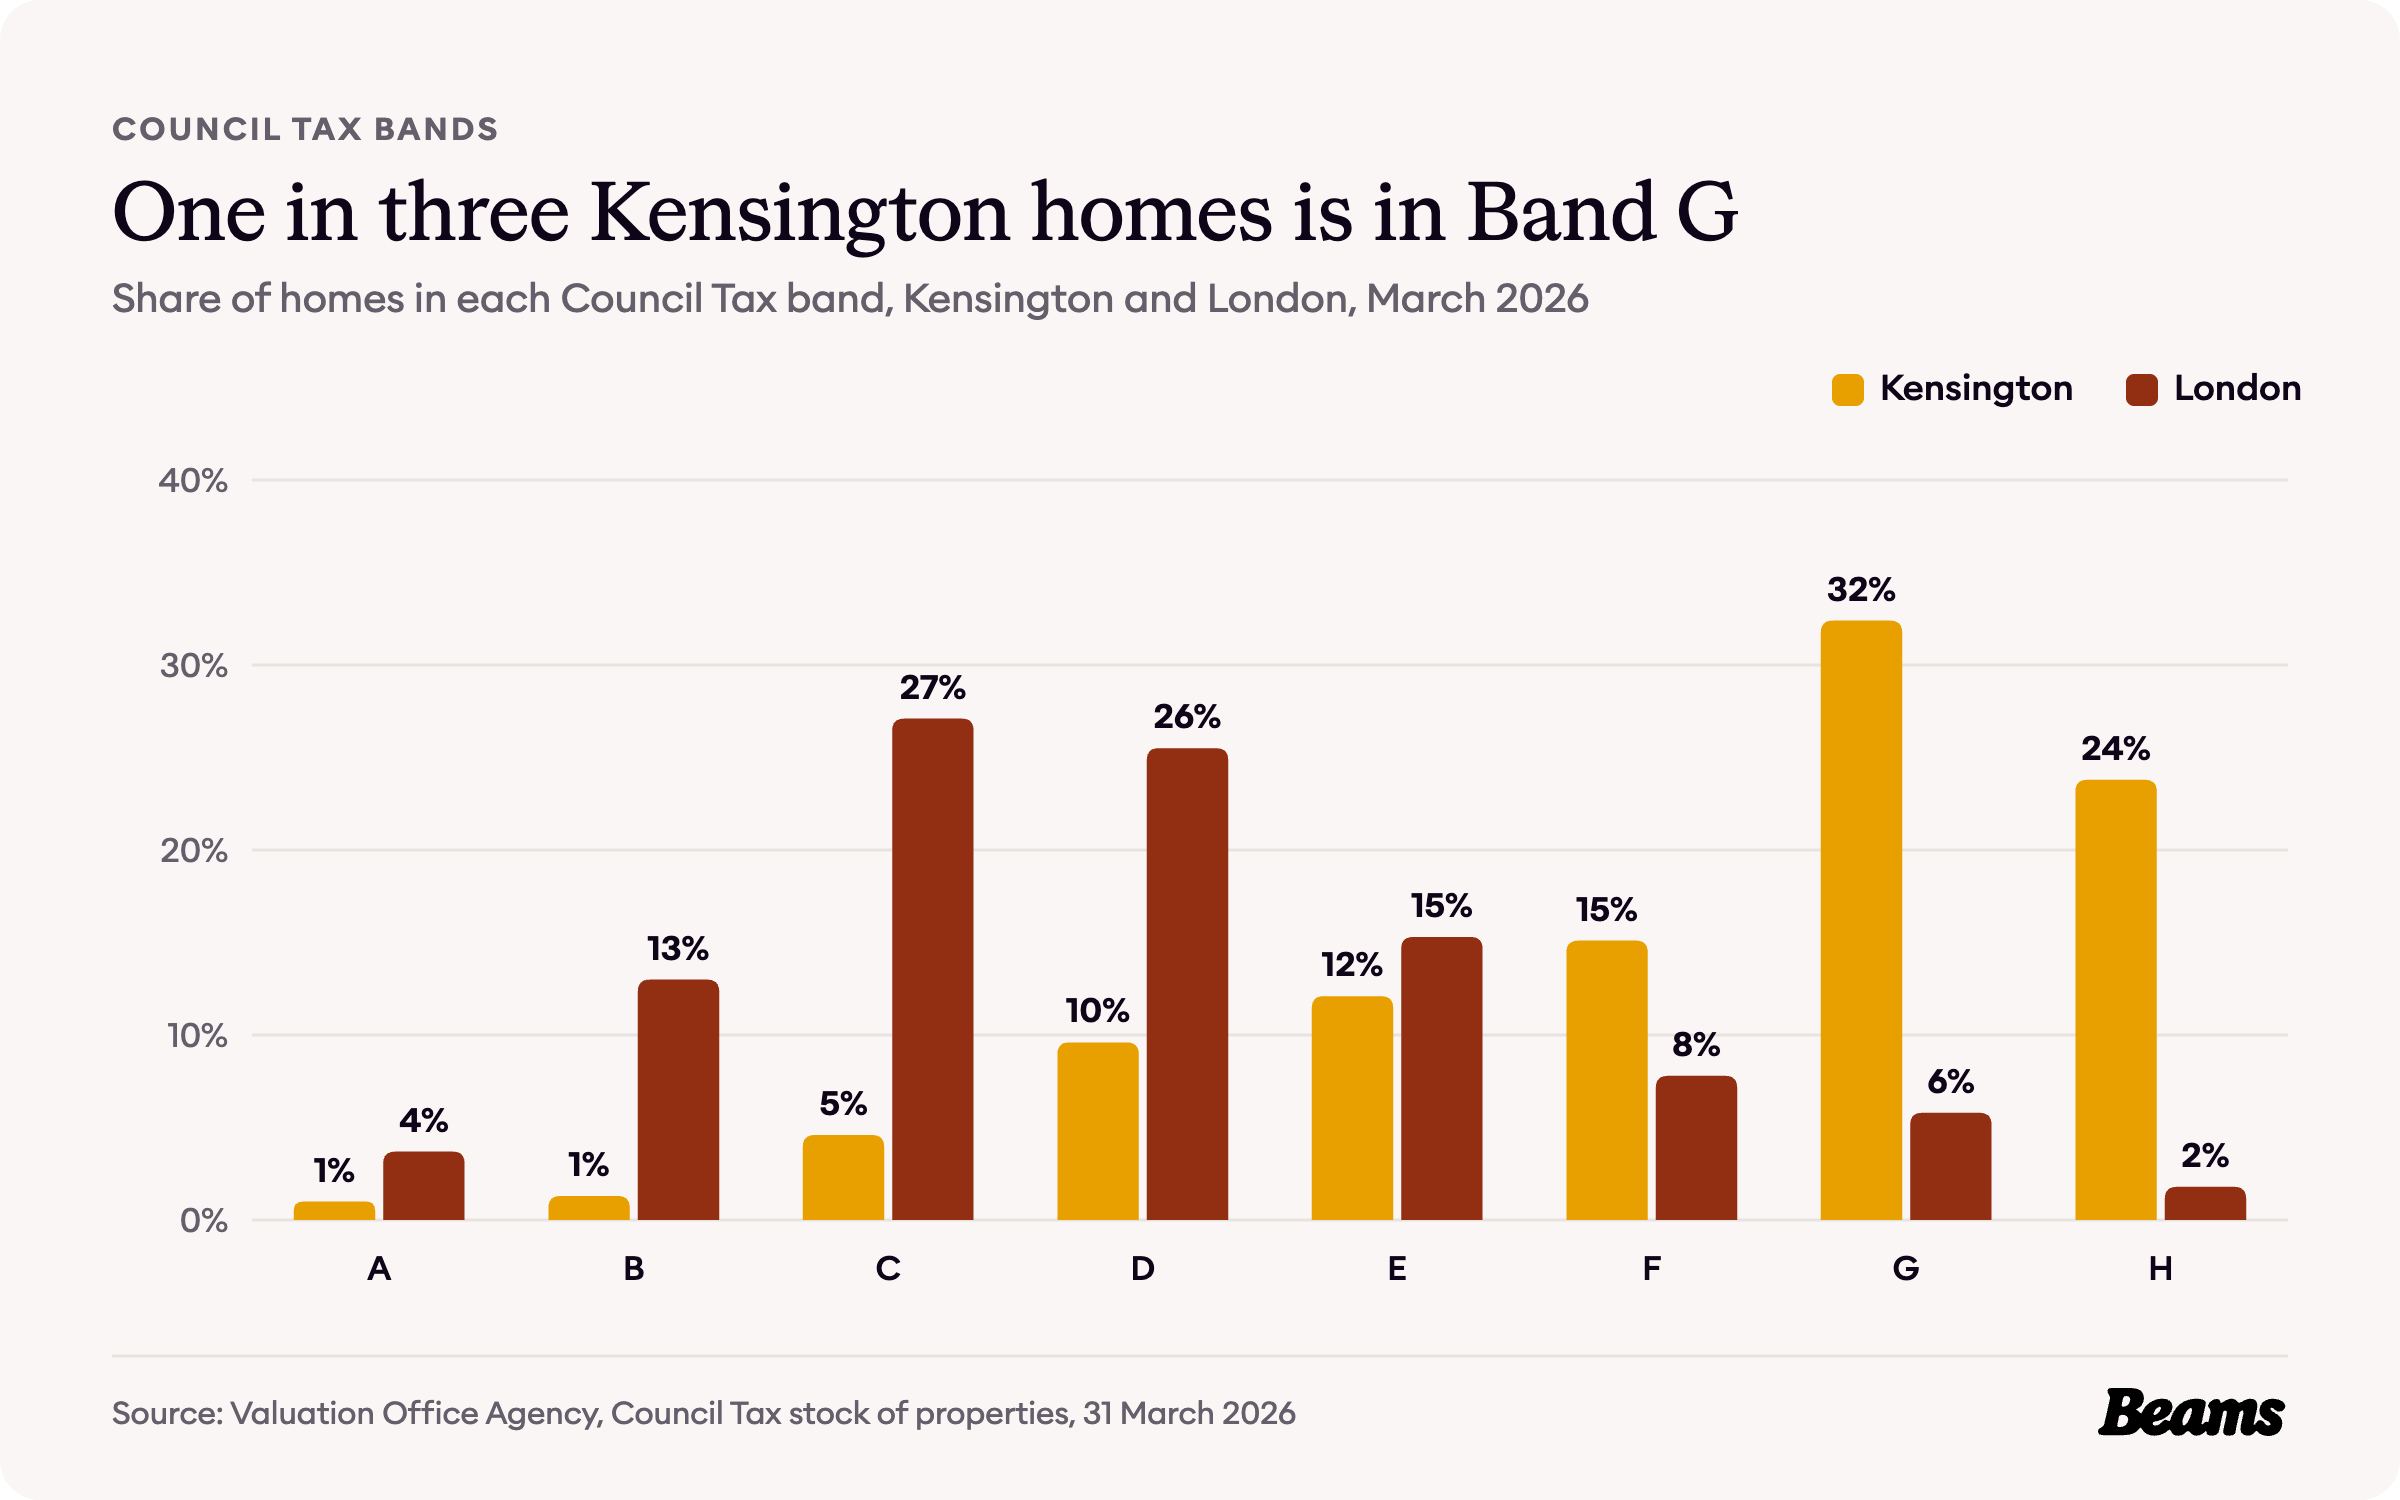
Band G is the biggest band in the five Kensington areas, holding 32.4% of homes, about one in three, against 5.8% across London. Another 23.8% are in Band H, so 56.2% of homes are in the top two bands, against 7.6% for London. Only 6.9% are in Bands A to C [4].
The rules on your street
There are 38 conservation areas in Kensington and Chelsea, protecting nearly three quarters of the borough [11]. Those in Kensington include Kensington Square, Kensington Court, Kensington Palace, Holland Park, Queens Gate, Thurloe Estate and Smith's Charity, and Edwardes Square, Scarsdale and Abingdon [12]. The council assesses whether a proposal in a conservation area preserves or enhances its character or appearance, and permitted development rights are tighter there than elsewhere [11].
Below ground the rule is the same across the borough. Since 28 April 2016 an Article 4 direction has removed permitted development rights for basement extensions to single dwelling houses everywhere in Kensington and Chelsea [13]. Many Queen's Gate houses already have a basement, but extending it is the kind of basement conversion in Kensington that needs planning permission first.
Under the council's standard service, a decision on an application that needs consultation takes up to 8 weeks. Householders can also pay for its Fast Track service, which offers validation within one working day of payment and, where public consultation is needed, a decision within two working days of the consultation ending, which is usually within 28 days of validation. The council says Fast Track affects the speed of an application, not the outcome [14]. Check whether your street is in a conservation area before you ask builders in Kensington for a fixed price.
Kensington housing statistics at a glance
- Median sale price, W8 and SW7, October 2025 to September 2026: £1,300,000 (311 sales) [9]
- Median flat sale, W8 and SW7: £1,050,000 (253 sales) [9]
- Average house price, Kensington and Chelsea, August 2026: £1,204,072 (London £554,430) [7] [8]
- Average flat or maisonette, Kensington and Chelsea: £947,855 (London £427,310) [7] [8]
- Average private rent, Kensington and Chelsea, September 2026: £3,739 a month [7]
- Homes built before 1900: 75.6% (London 20.8%) [4]
- Households living in a converted flat: 26.0% (London 11.1%) [5]
- Households renting privately: 51.9% (London 30.0%) [6]
- Homes in Council Tax Band G or H: 56.2% (London 7.6%) [4]
- Conservation areas in Kensington and Chelsea: 38 [11]
Frequently asked questions
References
- British History Online, Kensington Square and environs: Introduction. Survey of London, volume 42, Kensington Square to Earl's Court.
- British History Online, Domestic Buildings after 1851: The house-type of the Queen's Gate area. Survey of London, volume 38, South Kensington Museums Area.
- British History Online, Domestic Buildings after 1851: The occupants. Survey of London, volume 38, South Kensington Museums Area.
- Valuation Office Agency, Council Tax: stock of properties 2026. Table CTSOP4.1, properties by build period and Council Tax band at 31 March 2026, the five Kensington areas and London.
- ONS, Census 2021 table TS044: Accommodation type. Households by type of home, the five Kensington areas and London.
- ONS, Census 2021 table TS054: Tenure. Households by tenure, the five Kensington areas and London.
- ONS, Housing prices in Kensington and Chelsea. UK House Price Index for August 2026 and Price Index of Private Rents for September 2026, updated 21 October 2026.
- HM Land Registry, UK House Price Index. Average prices for Kensington and Chelsea, London and England, August 2006 to August 2026.
- HM Land Registry, Price Paid Data. Sales in the W8 and SW7 postcode districts, October 2025 to September 2026.
- GOV.UK, How domestic properties are assessed for Council Tax bands. Accessed 29 October 2026.
- Kensington and Chelsea Council, Conservation areas. Accessed 29 October 2026.
- Kensington and Chelsea Council, Conservation area appraisals, proposal statements and management plans. Accessed 29 October 2026.
- Kensington and Chelsea Council, Article 4 directions. Accessed 29 October 2026.
- Kensington and Chelsea Council, Fast Track application service. Accessed 29 October 2026.
Thinking of improving rather than moving?
Tell us about your Kensington home and what you want to change. We'll give you a free estimate, then up to three vetted builders quote against the same specification.