
Islington housing statistics 2026
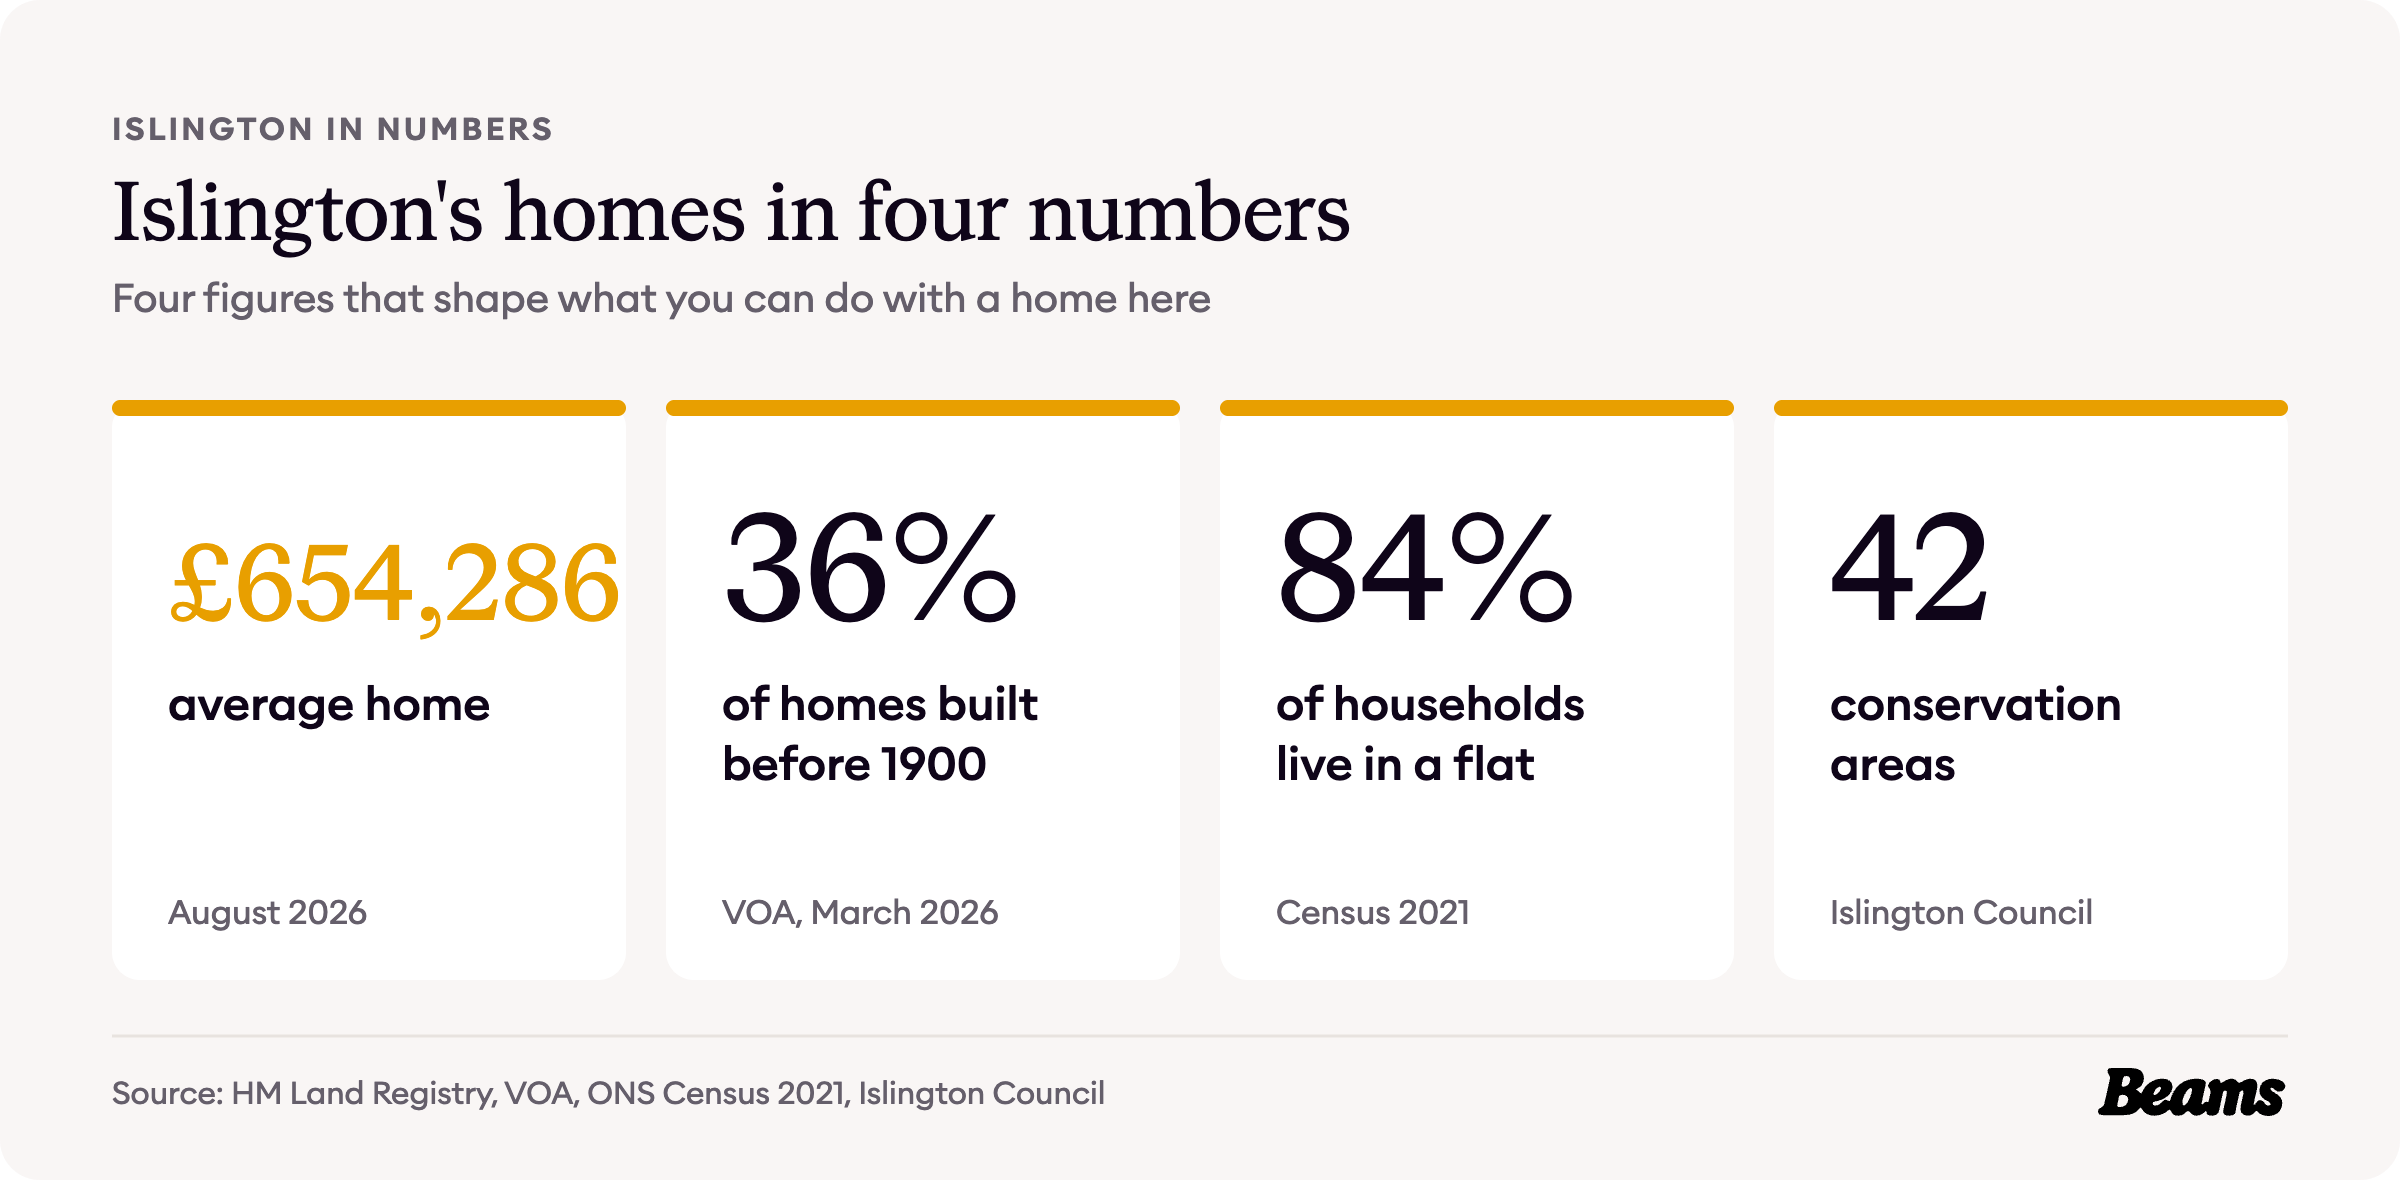
Islington was built in two bursts. The Georgian and Victorian terraces came first, then the post-war council estates, with almost nothing in between. Today more than four in five households live in a flat, only a quarter own their home, and the average home costs £654,286 after the sharpest annual fall in twenty years.
Every figure comes from an official source and is dated, so you can see exactly what you are working with before you plan a home renovation in Islington. The sources are numbered in brackets and listed in full at the end of the page.
When Islington's homes were built
The old parish of Islington grew at a startling rate in the 19th century. Its population was 10,212 in 1801, 95,329 in 1851 and 335,238 in 1901, and the number of houses rose by 80% between 1821 and 1831 alone [1].
Then the tide turned. From the 1890s the northern part of the parish began to lose its middle-class residents to outer Middlesex, and large houses fell into multi-occupation. The war destroyed 3,200 houses, and in 1967 Islington still had the most multi-occupied dwellings of any London borough, 59% of the total [1].
From the 1960s it changed again, as middle-class families bought houses, particularly in the south of the borough, and rehabilitated them. Conservation areas were formed at the same time [1].
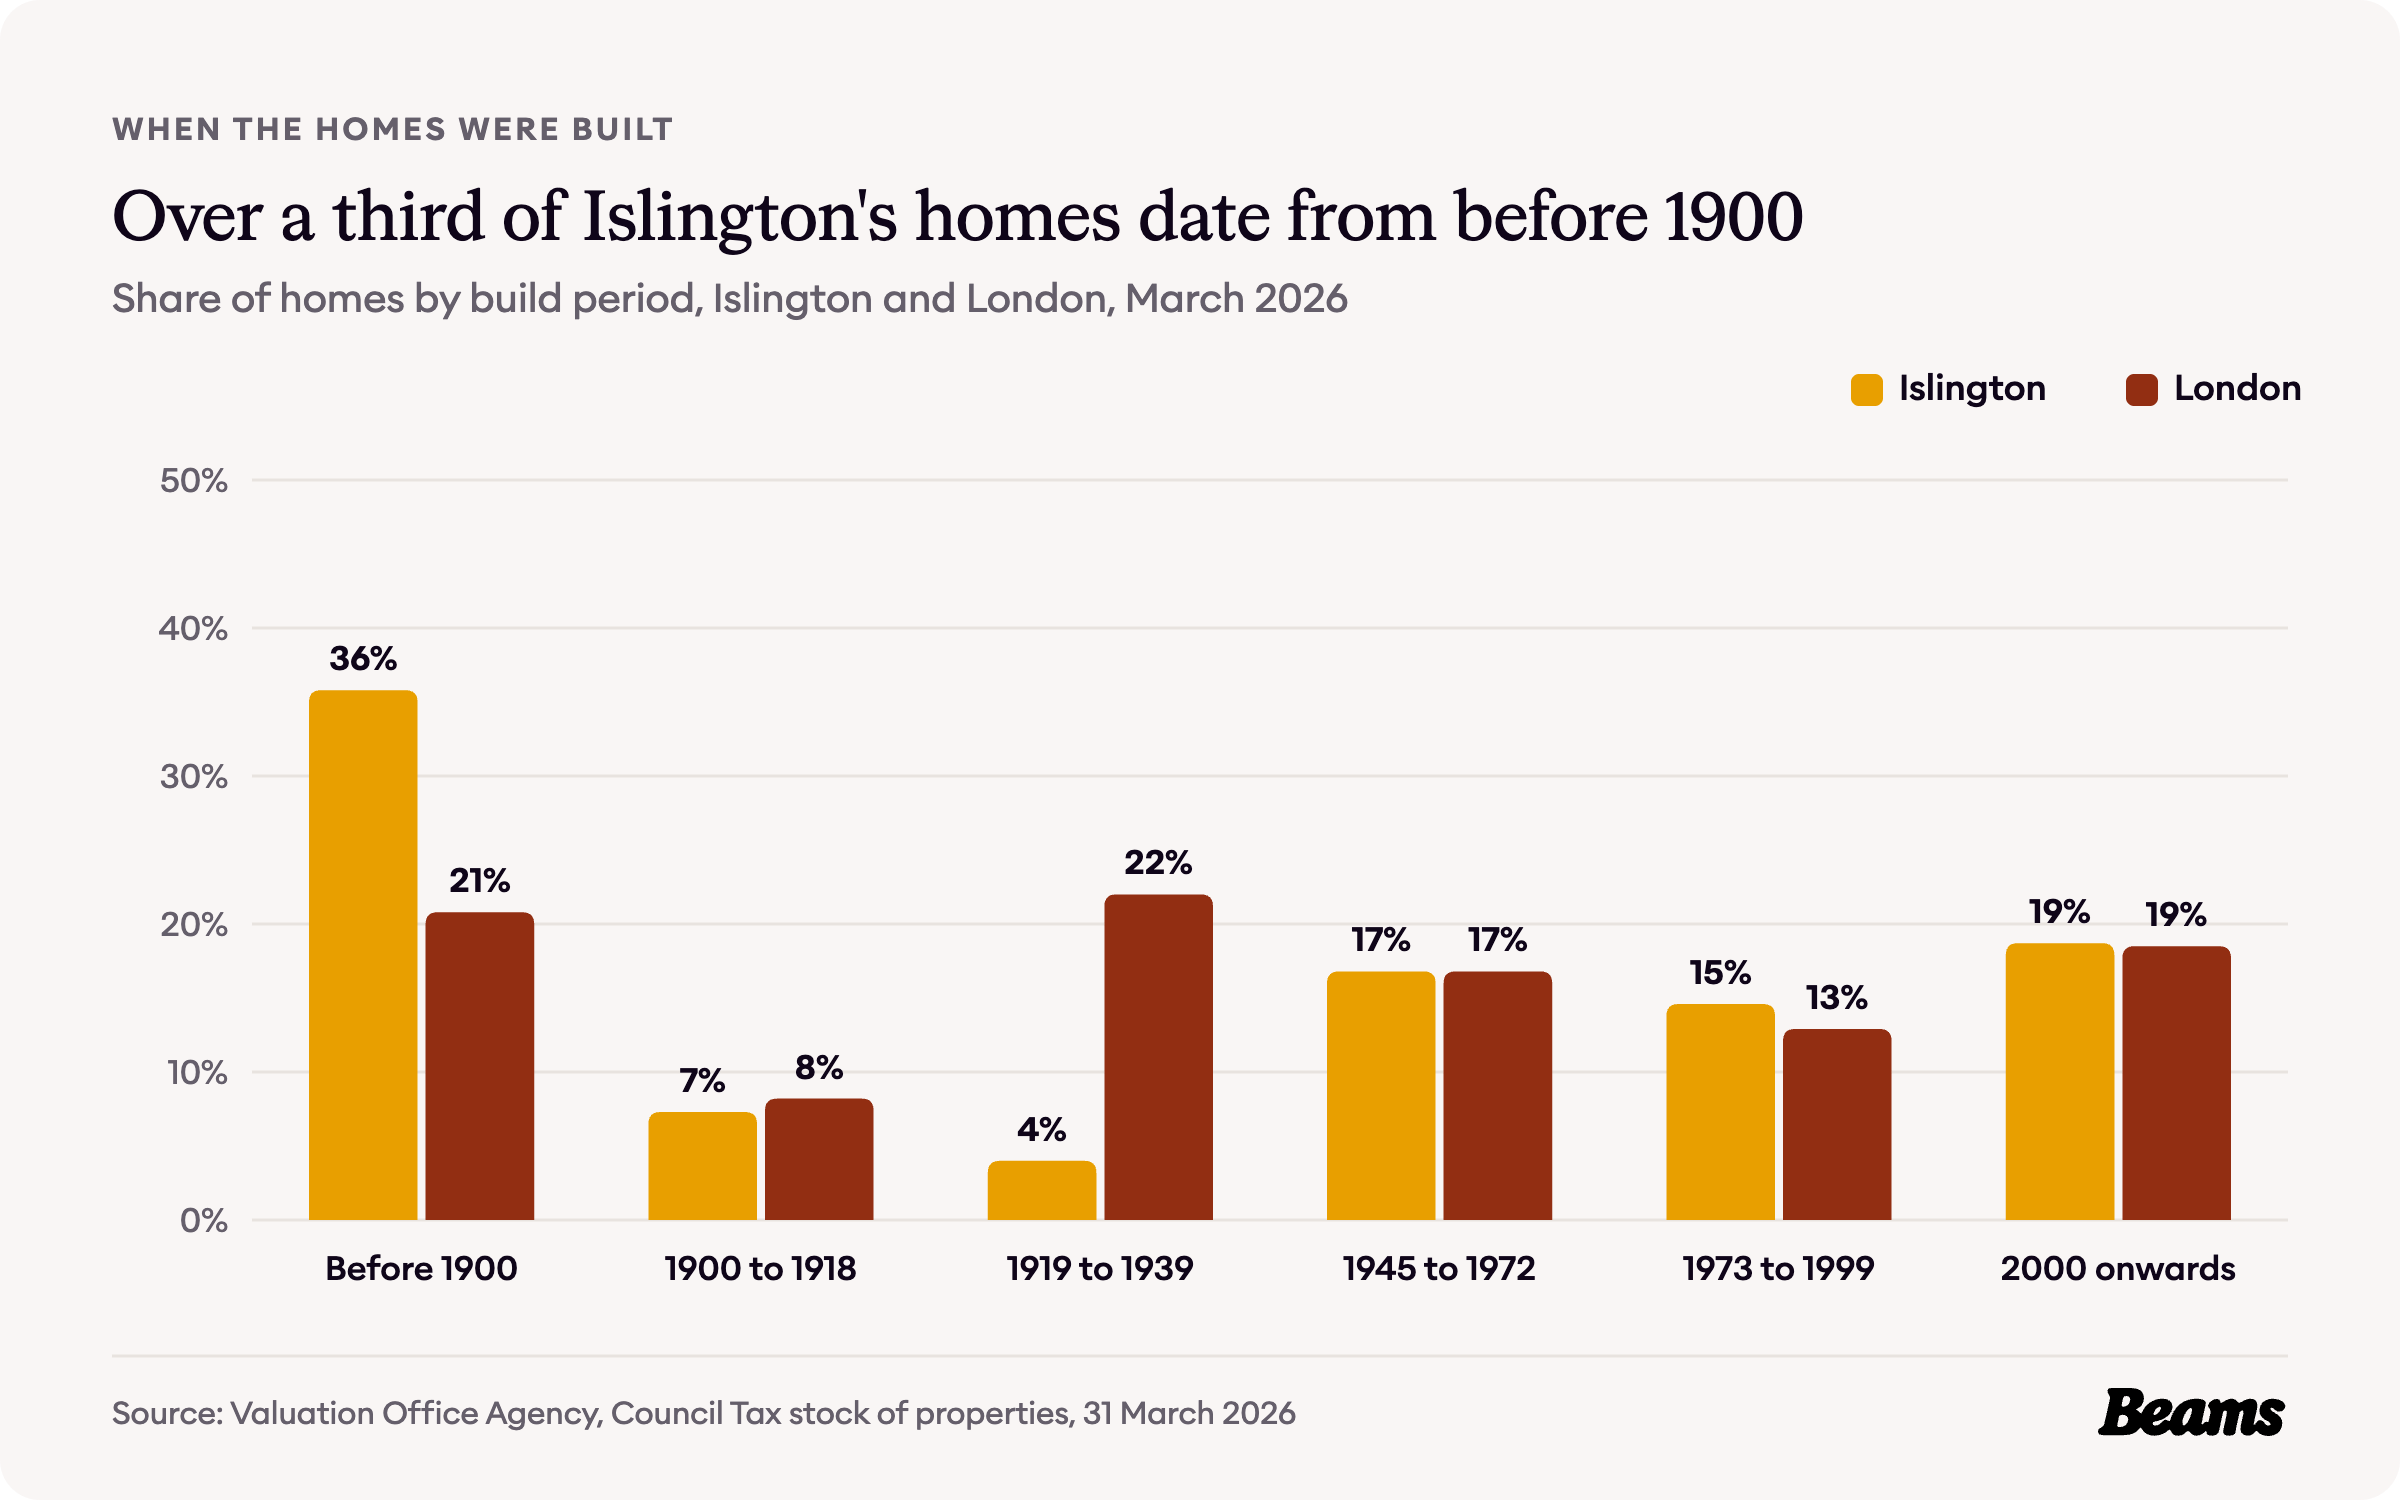
The Valuation Office Agency figures show both bursts of building. Of Islington's 112,310 homes, 35.8% were built before 1900, against 20.8% across London, and 16.8% between 1945 and 1972. Only 4.0% date from between the wars, against 22.0% for London [2]. Those Georgian and Victorian terraces, with space under the roof above the top floor, are the natural starting point for a loft conversion in Islington.
How Islington households live
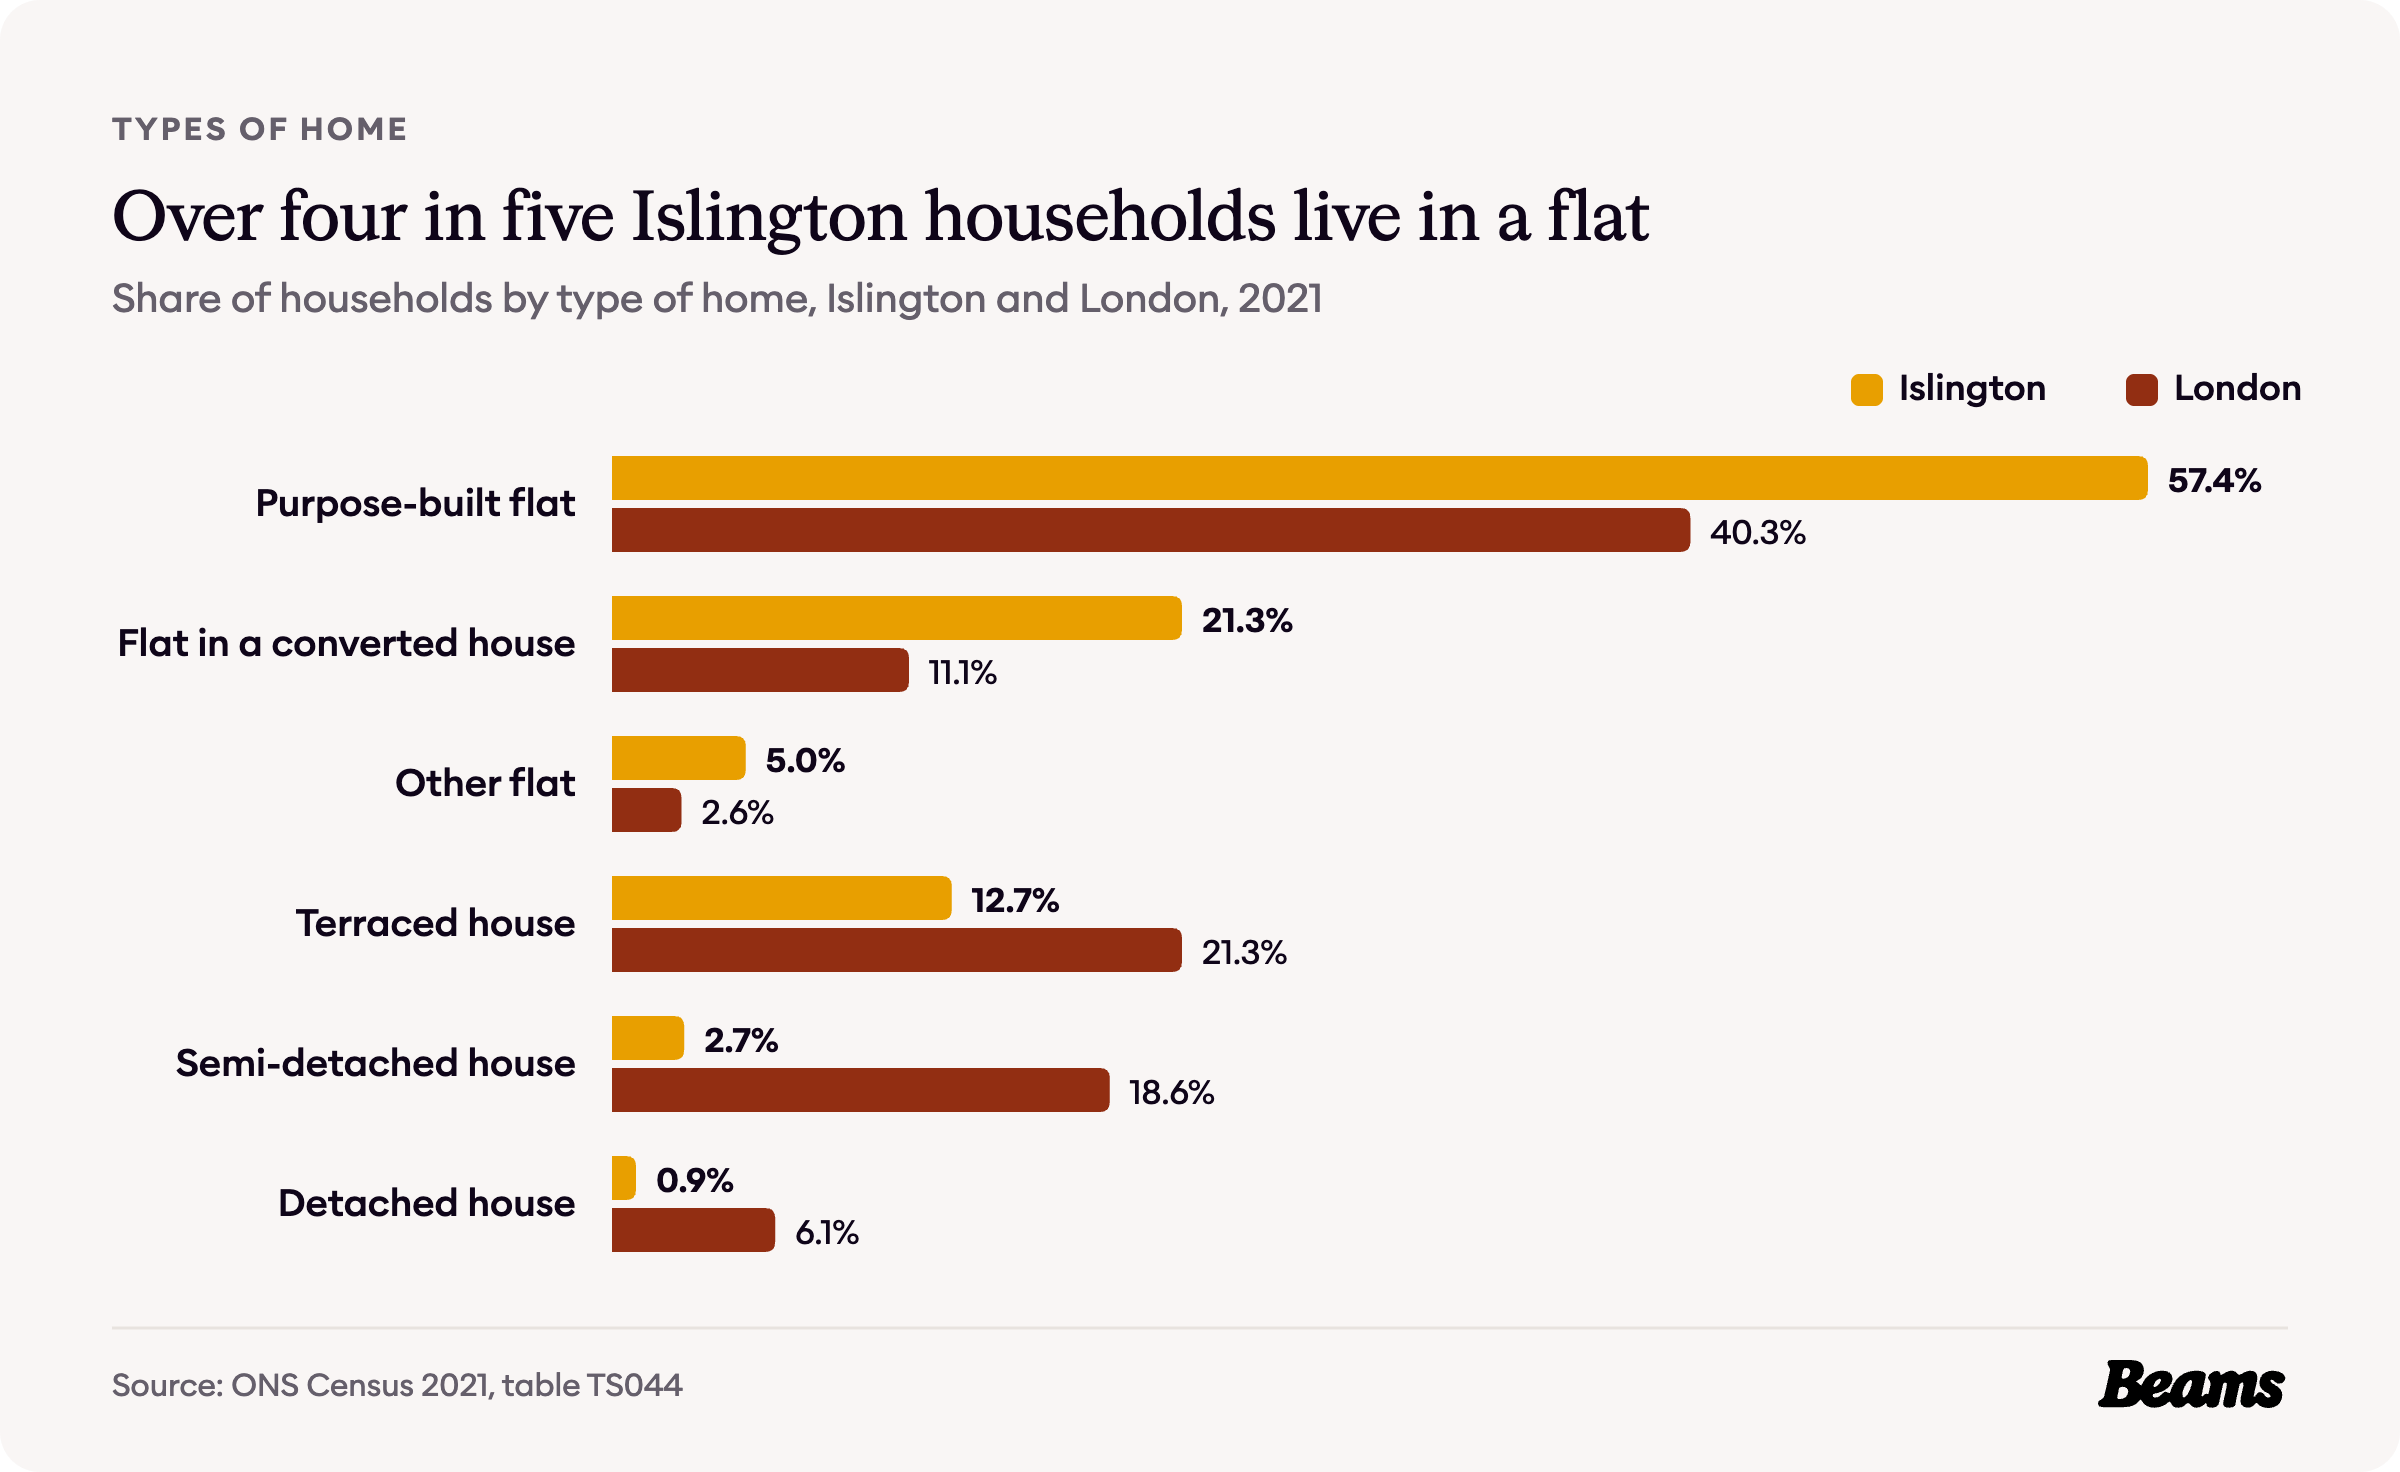
The 2021 Census found 83.7% of Islington households living in a flat, against 54.0% across London. 57.4% live in a purpose-built block and 21.3% in a flat inside a converted house, nearly twice London's 11.1% [3].
Only 16.3% of households live in a house of any kind, and 12.7% in a terraced house, against 21.3% for London [3]. With so many homes inside converted houses and purpose-built blocks, a kitchen renovation in Islington is usually about getting more from the same floor area.
Who owns Islington's homes
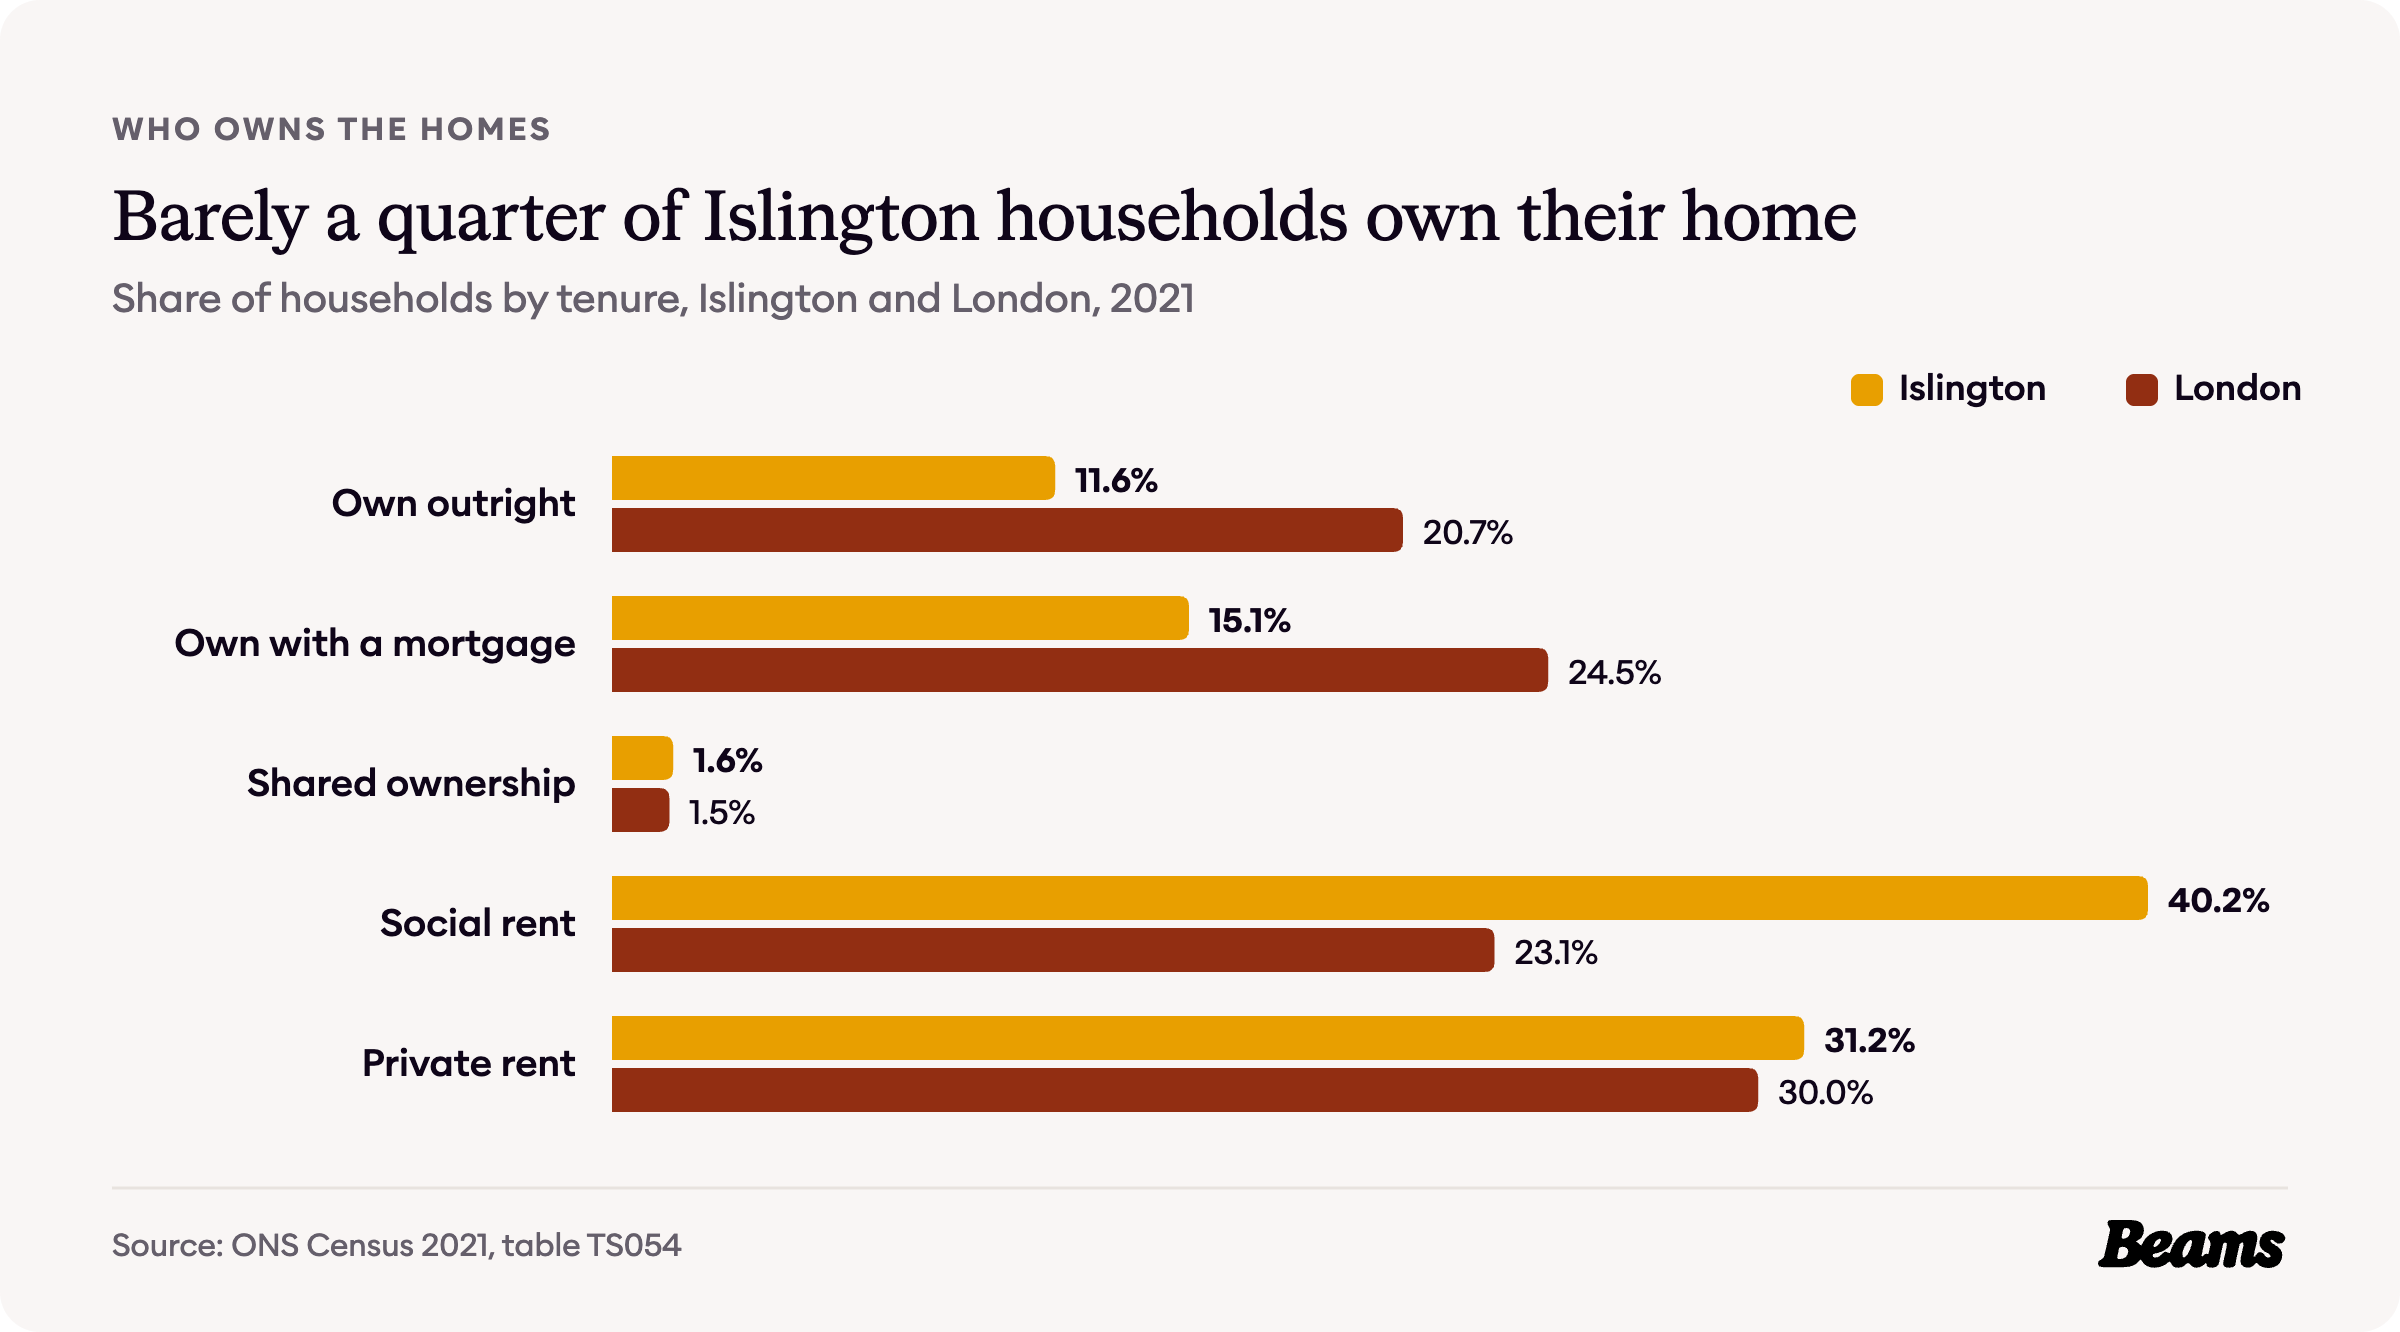
Just 26.7% of Islington households own their home, 11.6% outright and 15.1% with a mortgage, against 45.2% across London [4].
Social renting is the largest tenure, at 40.2% of households against 23.1% for London, and a further 31.2% rent privately [4]. Much of the social housing is the legacy of post-war building: by 1958 the borough council had built 3,378 homes since 1946, and by 1962 the London County Council had added 2,834 [1].
What an Islington home costs
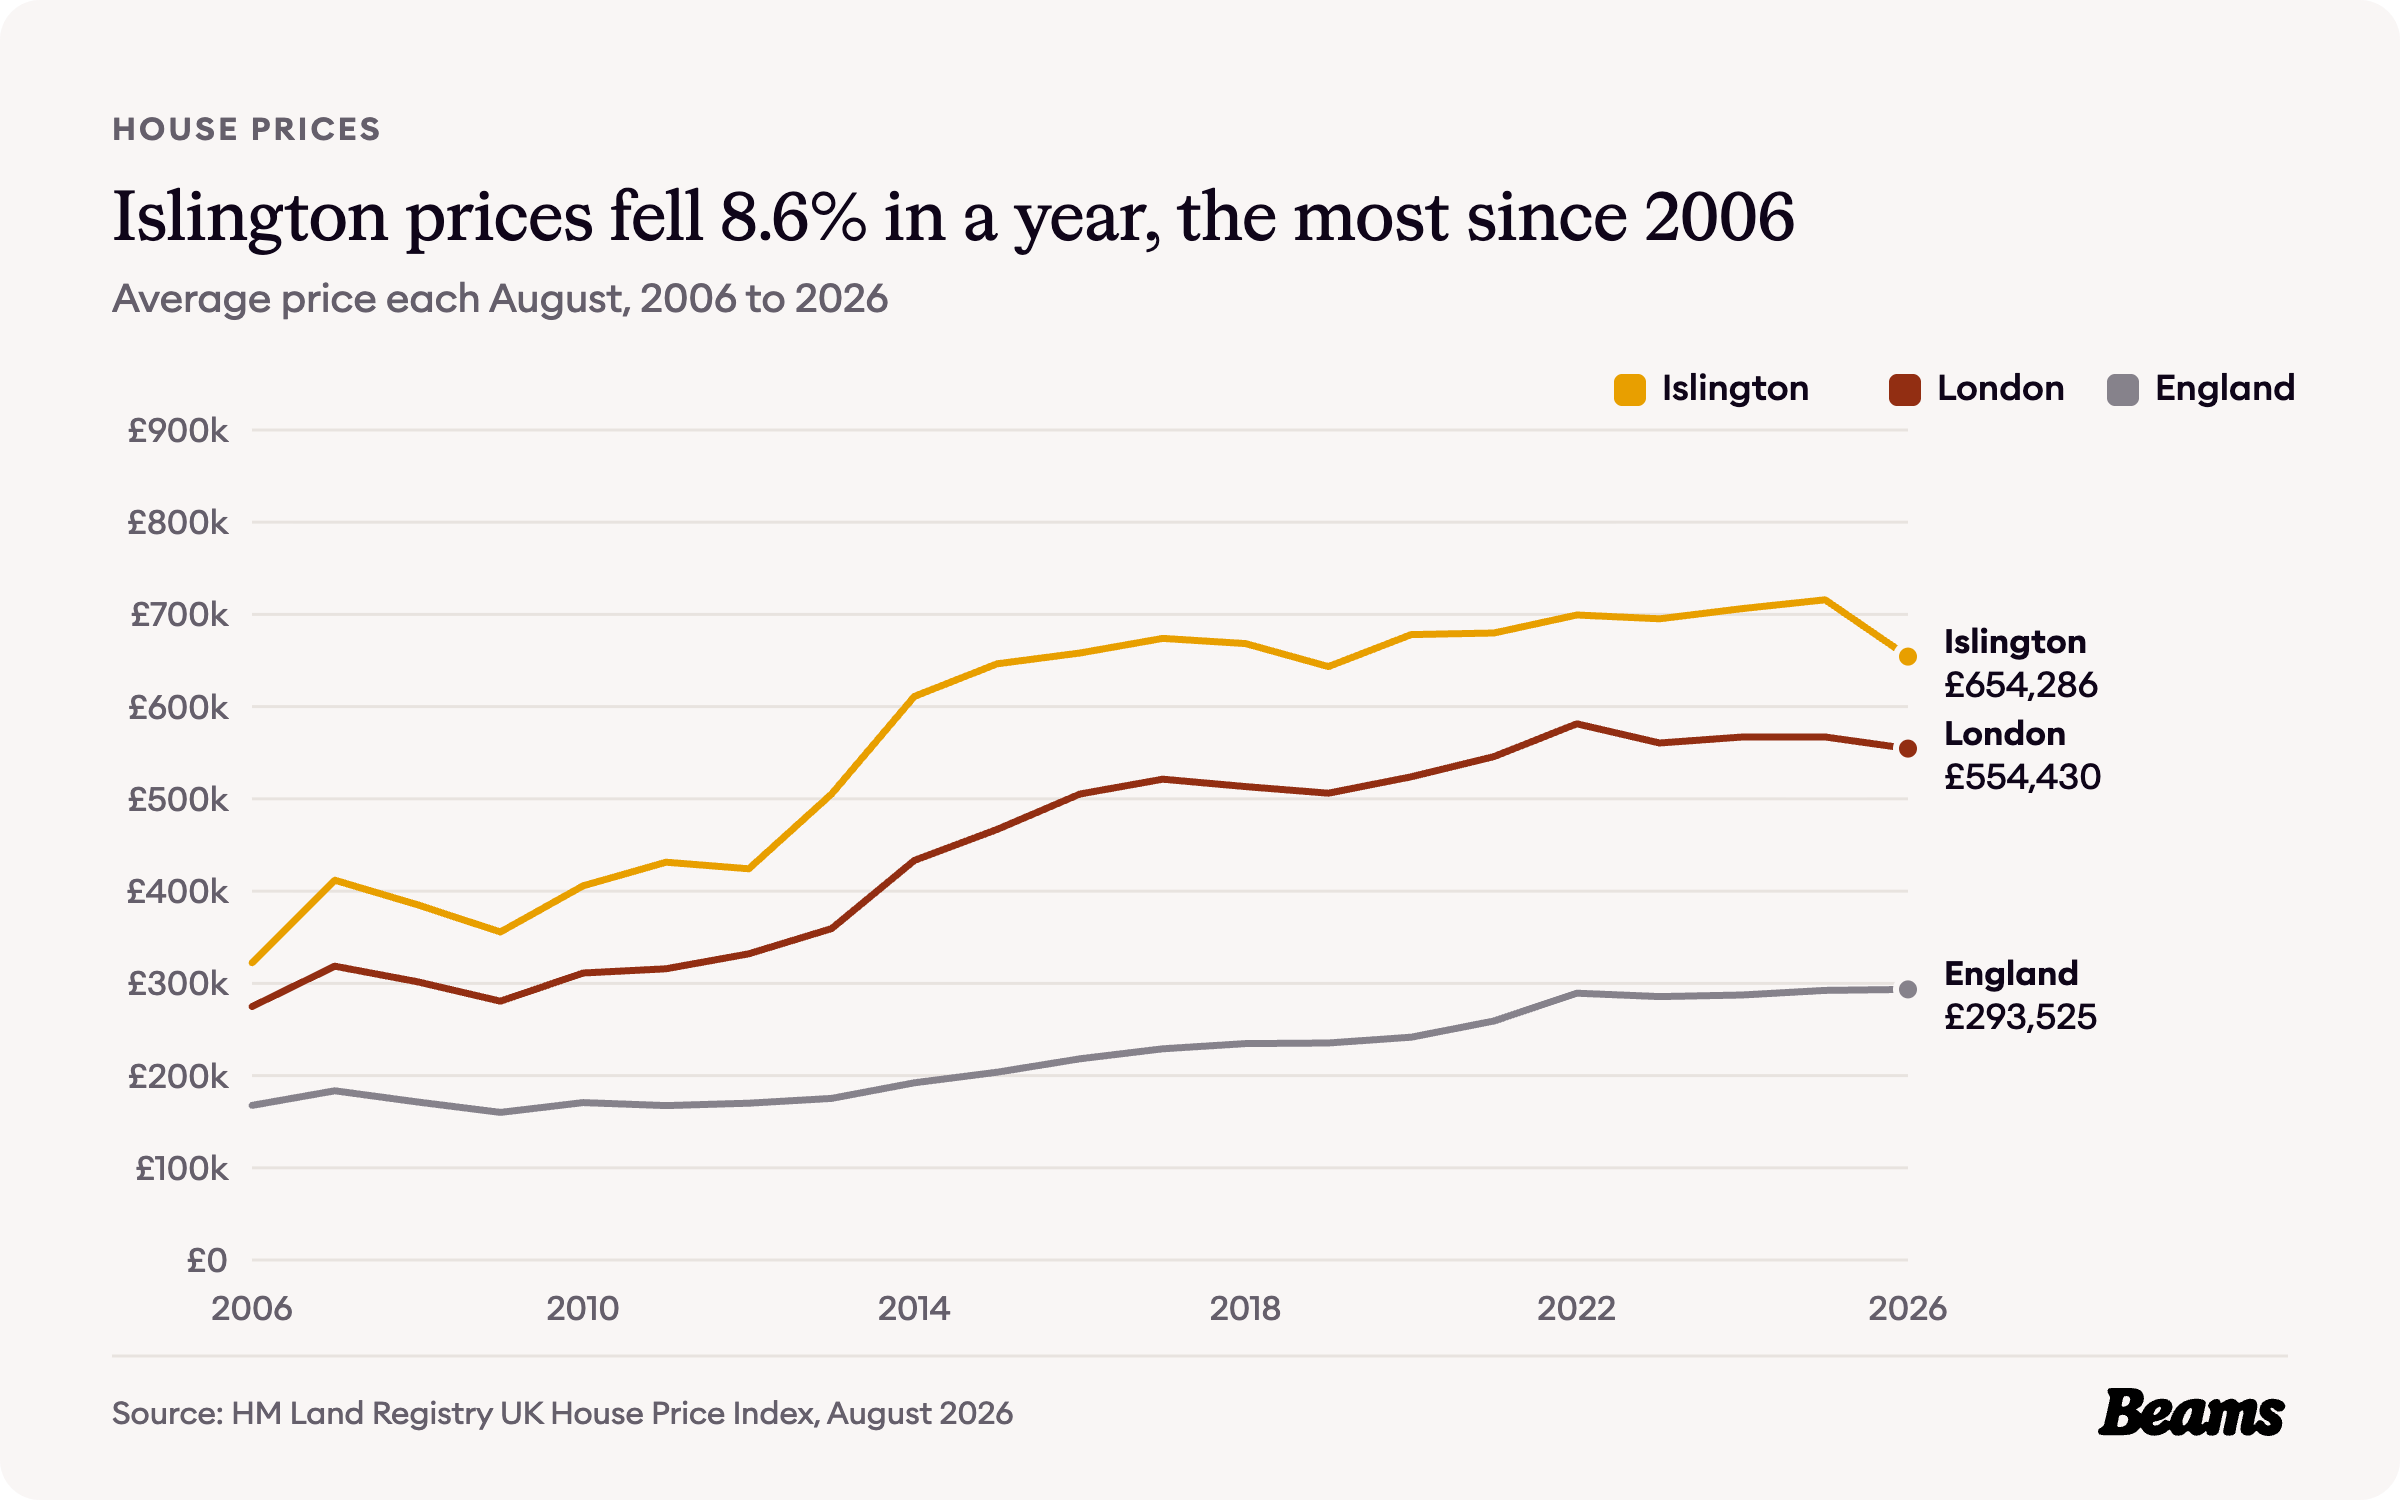
The average Islington home cost £654,286 in August 2026, 8.6% less than a year earlier [5]. That is still about 18% above the London average of £554,430, where prices fell by 2.2%, and more than twice the England average of £293,525 [6].
Islington has been above the London average every August for twenty years. In August 2006 the average home here cost £322,335, against London's £274,815. The biggest jump came between 2013 and 2014, when the average rose from £505,351 to £611,237, and prices peaked at £715,818 in August 2025. The fall since then is the largest one-year drop in the twenty-year series [6].
Flats, terraces and the gap between them
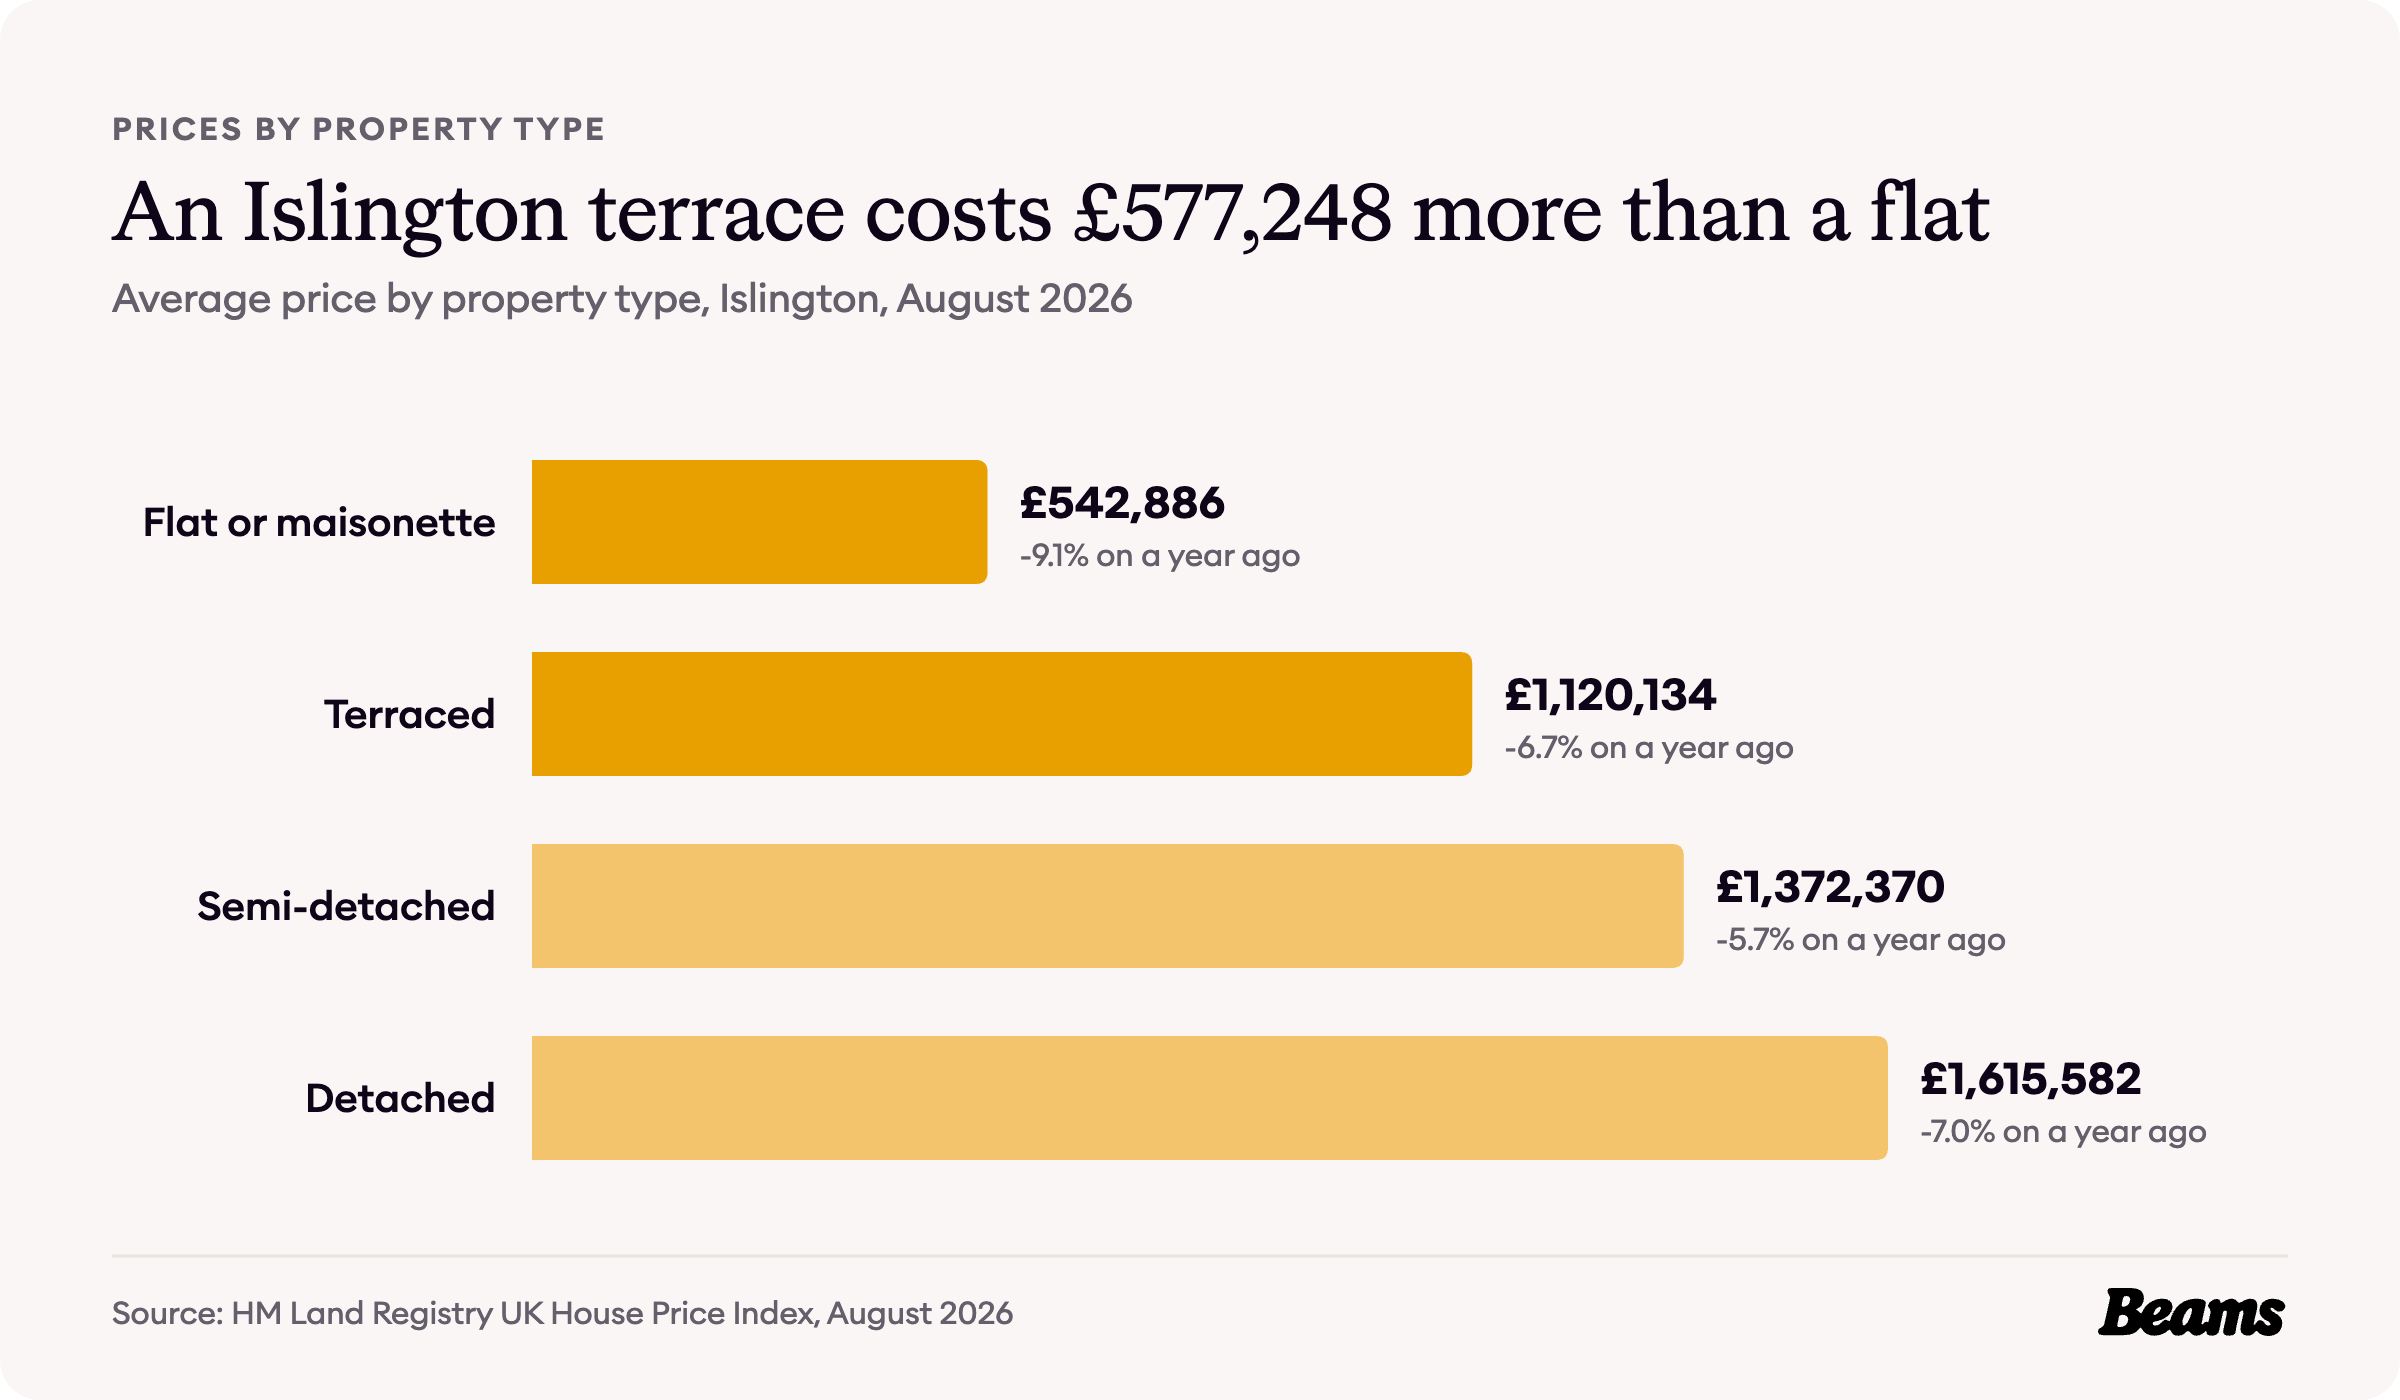
A flat or maisonette in Islington averaged £542,886 in August 2026 and a terraced house £1,120,134, a gap of £577,248. Semi-detached homes averaged £1,372,370, although only 2.7% of households live in one [5] [3].
Both flats and terraces cost well above the London averages of £427,310 and £648,650 [5] [6]. First-time buyers paid an average of £576,764 in August 2026, while owners moving home paid £821,841 [5].
That gap is what most Islington owners weigh up before they move. For a family already in a terrace, a house extension in Islington adds room without paying for the next rung of the ladder.
What it costs to rent in Islington
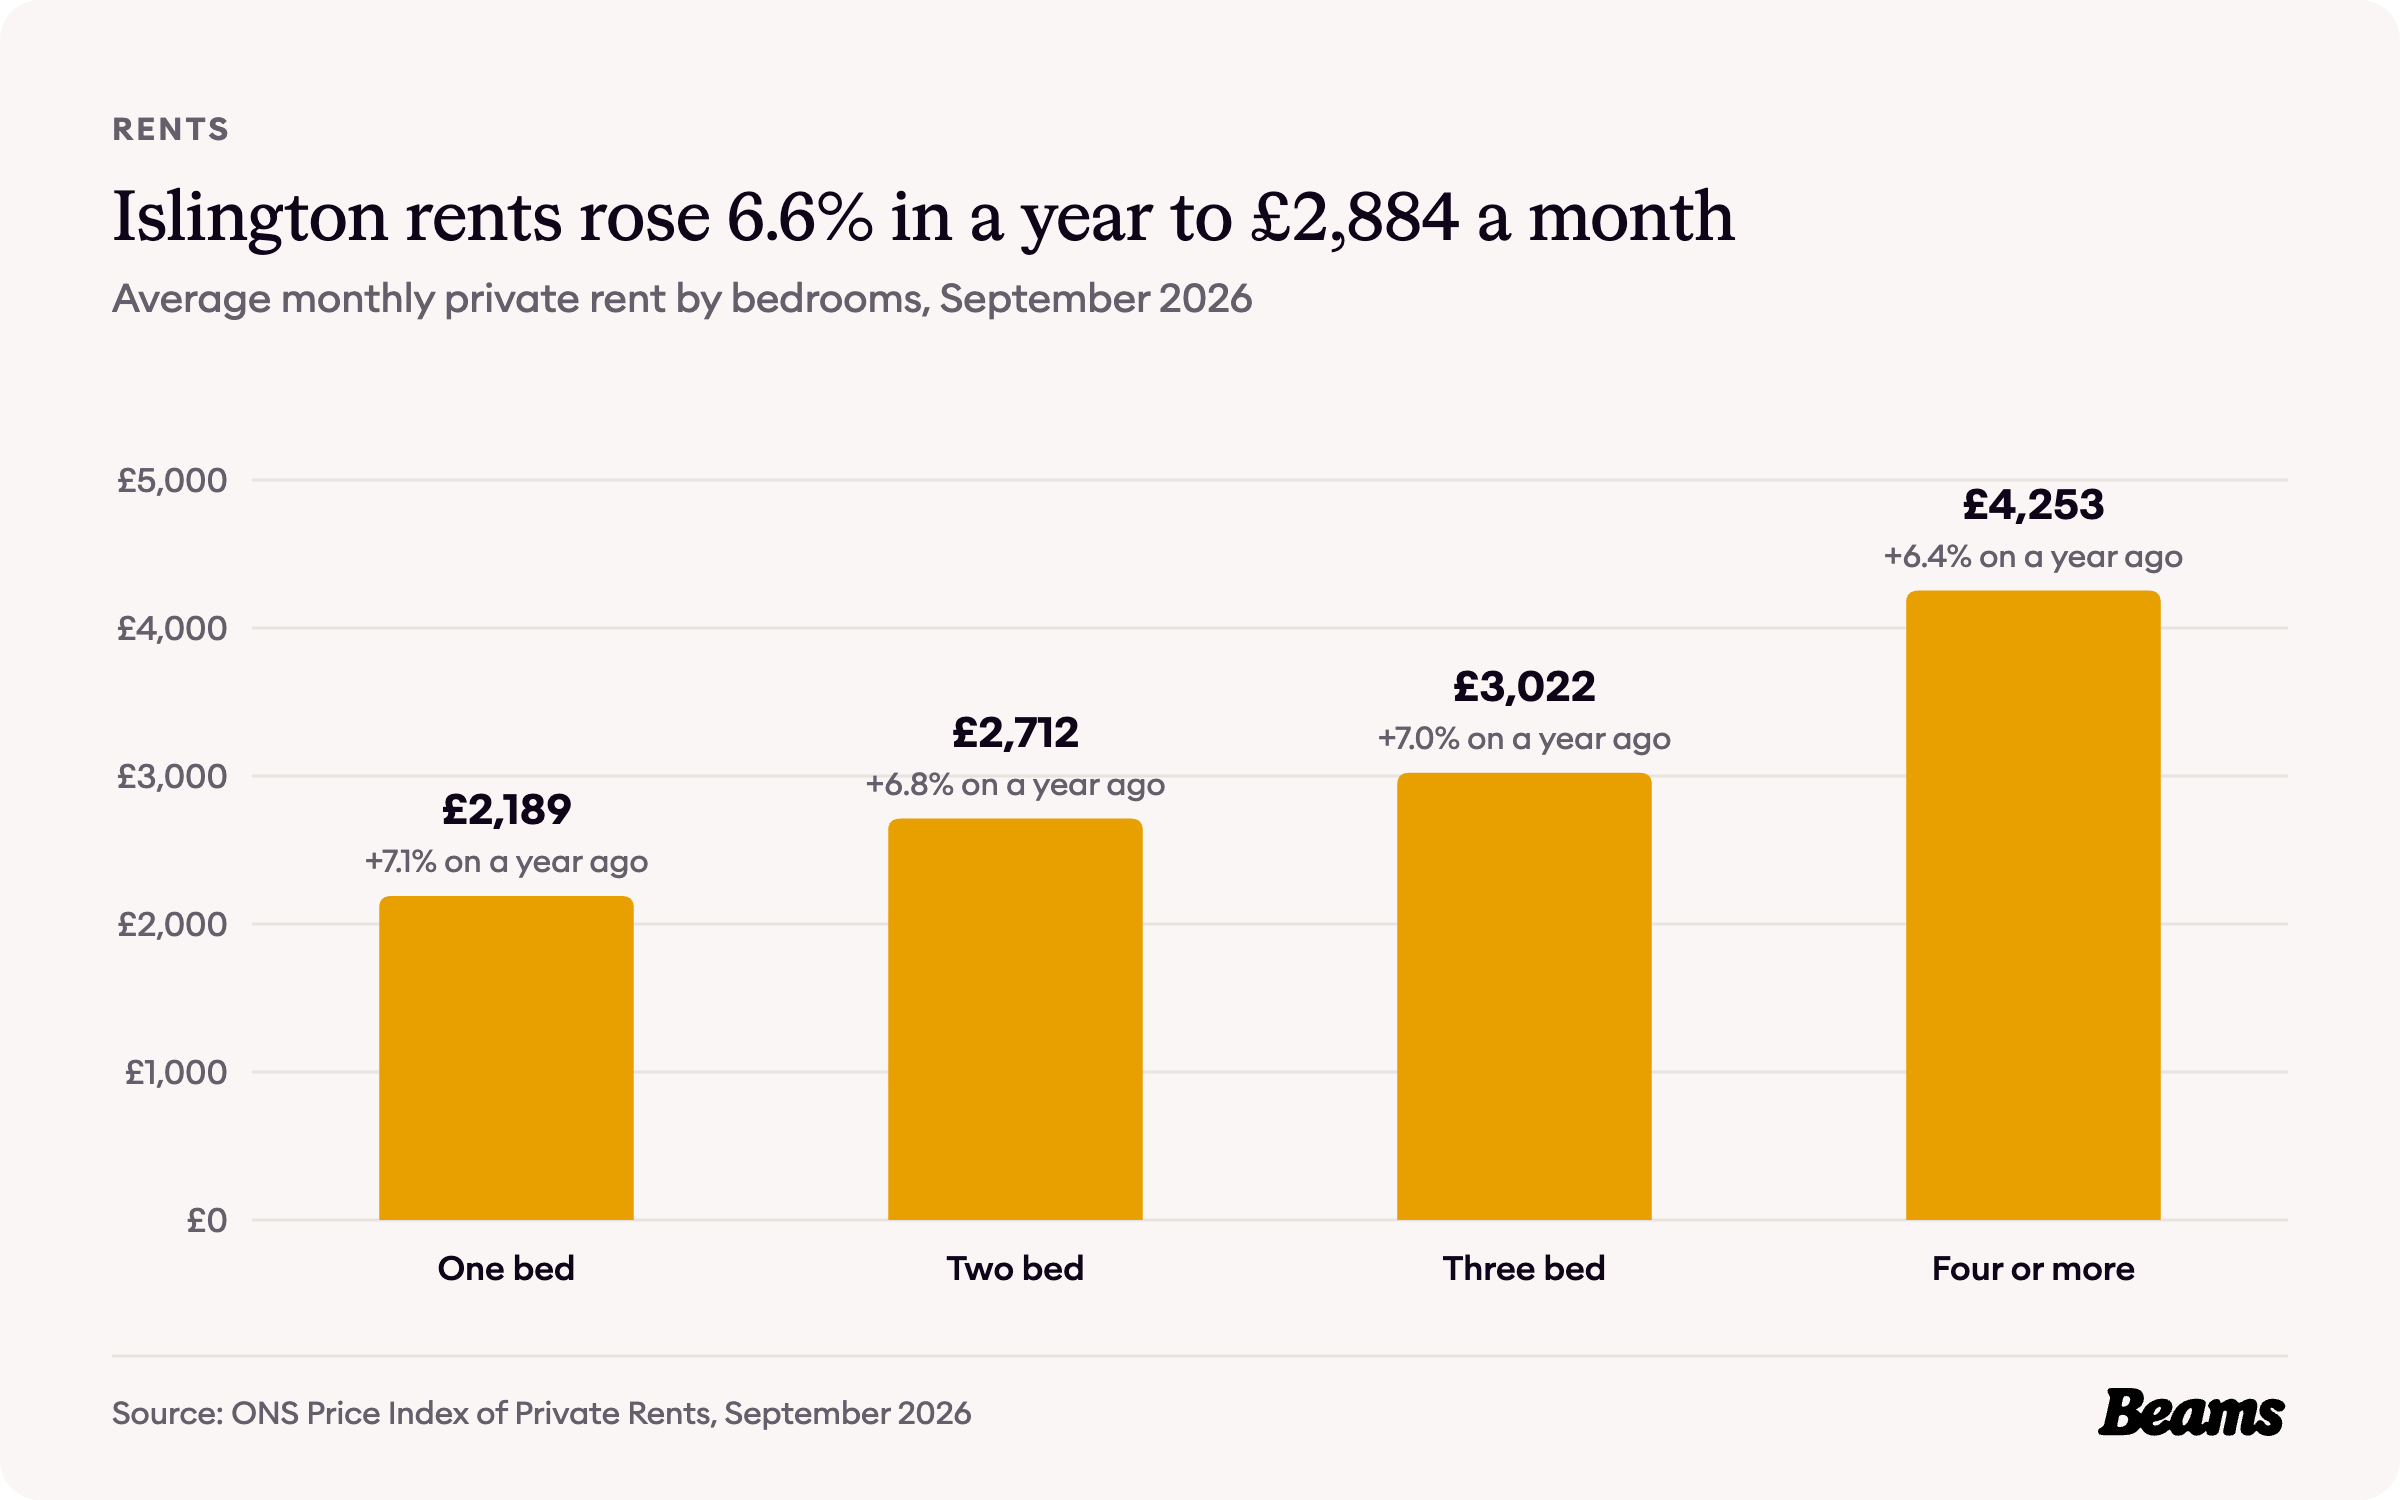
The average private rent in Islington was £2,884 a month in September 2026, up 6.6% on a year earlier [5]. A one-bedroom home averaged £2,189 a month, up 7.1%, and a home with four or more bedrooms £4,253.
With rents rising that quickly and 31.2% of households renting privately, a dated bathroom is often the first thing a bathroom renovation in Islington puts right between tenancies.
Council Tax bands in Islington
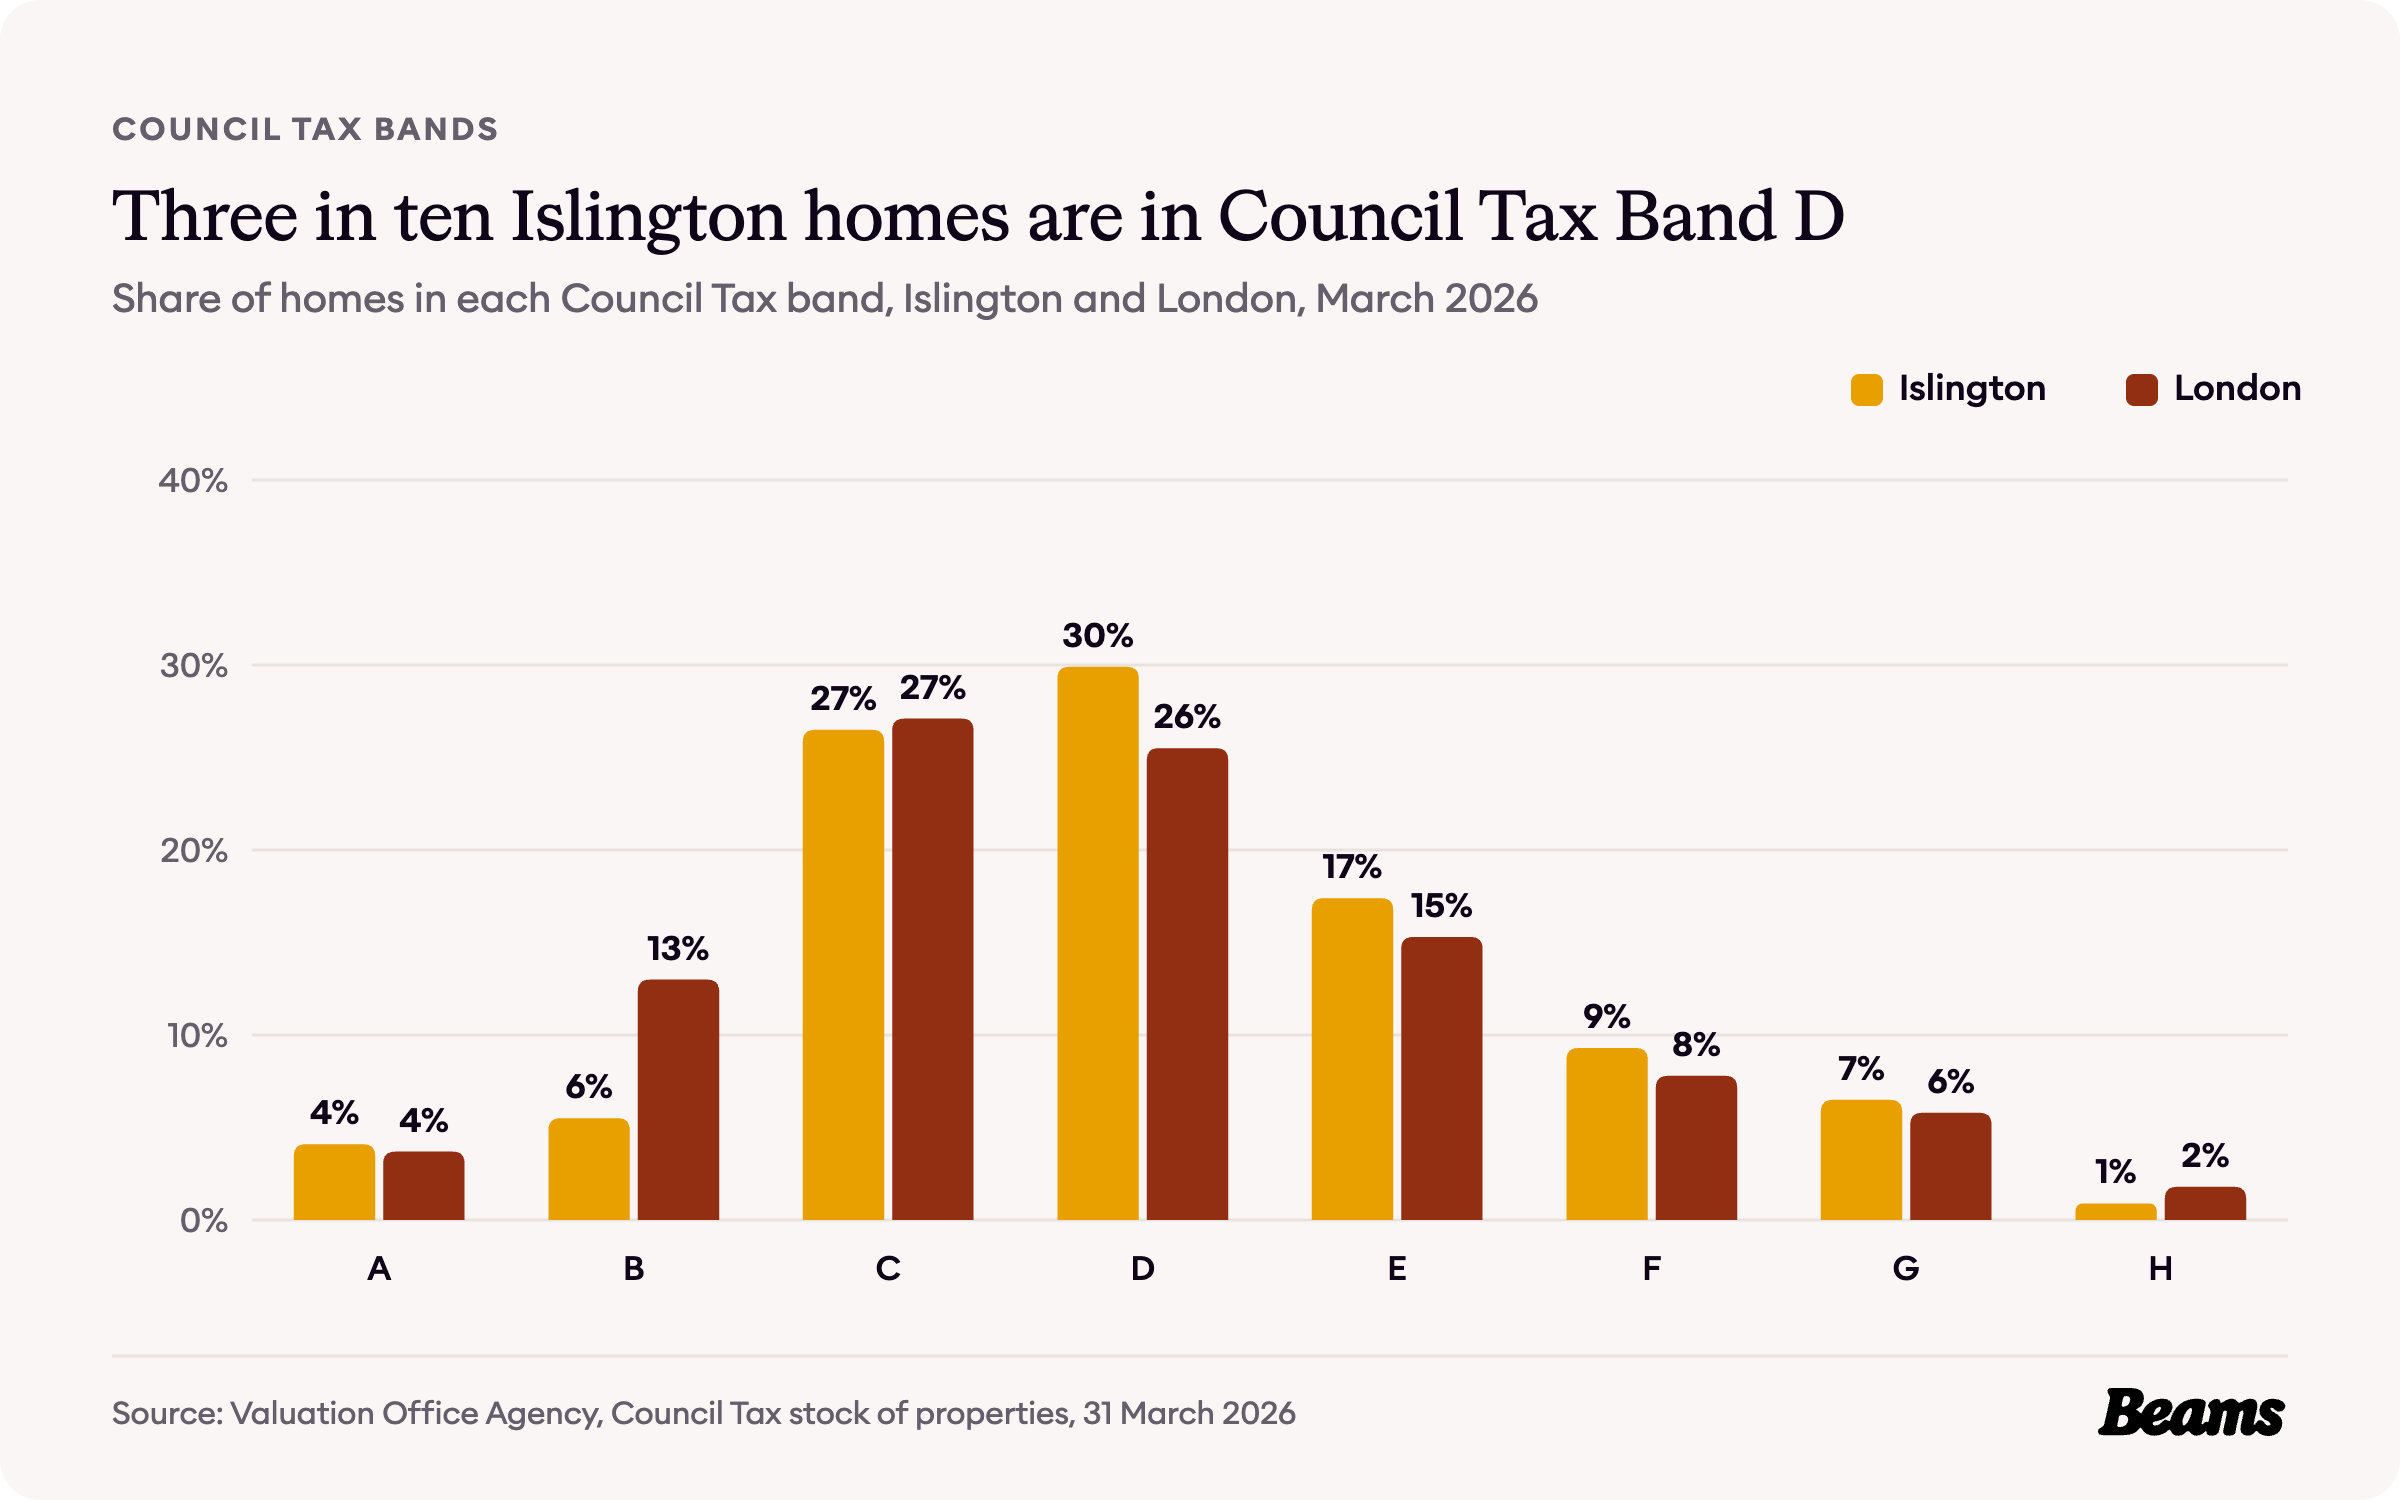
Council Tax bands are based on what a home would have sold for on the open market on 1 April 1991 [7]. In Islington, Band D is the largest, with 29.9% of homes against 25.5% for London, and Bands C and D together hold 56.4% of homes [2].
Only 9.6% of Islington homes are in Bands A and B, against 16.7% for London, and 7.4% are in Bands G and H, almost exactly London's 7.6% [2].
The rules on your street
Islington has 42 conservation areas. The first two, Clerkenwell Green and New River, were designated on 19 November 1968, and the newest, Poets Road, on 25 September 2025 [8].
The council says that in a conservation area you need planning permission for total or substantial demolition of a building, and may need it for roof alterations or dormer windows [8]. It has also removed permitted development rights in 40 of the 42 through Article 4 directions, so even changing external doors and windows or painting brickwork can need permission [9]. Digging down is one of the jobs where those rules matter most, so a basement conversion in Islington starts with a check of the address.
Islington Council says small-scale minor applications are normally decided within eight weeks and major applications within 13 weeks, although some take longer [10]. With Article 4 directions in almost every conservation area, it is worth checking your street on the council's map before anyone starts drawing, then asking up to three vetted builders in Islington to quote against the same plans.
Islington housing statistics at a glance
- Average house price, August 2026: £654,286 (London £554,430) [5] [6]
- Change on a year earlier: -8.6% (London -2.2%) [5] [6]
- Average flat or maisonette: £542,886 (London £427,310) [5] [6]
- Average terraced house: £1,120,134 (London £648,650) [5] [6]
- Average private rent, September 2026: £2,884 a month [5]
- Homes built before 1900: 35.8% (London 20.8%) [2]
- Households living in a flat: 83.7% (London 54.0%) [3]
- Households who own their home: 26.7% (London 45.2%) [4]
- Households in social rented homes: 40.2% (London 23.1%) [4]
- Conservation areas: 42, with Article 4 directions in 40 [8] [9]
Frequently asked questions
References
- British History Online, Islington: Growth. Victoria County History of Middlesex, volume 8.
- Valuation Office Agency, Council Tax: stock of properties 2026. Table CTSOP4.1, properties by build period and Council Tax band at 31 March 2026.
- ONS, Census 2021 table TS044: Accommodation type. Households by type of home, Islington and London.
- ONS, Census 2021 table TS054: Tenure. Households by tenure, Islington and London.
- ONS, Housing prices in Islington. UK House Price Index for August 2026 and Price Index of Private Rents for September 2026, published 21 October 2026.
- HM Land Registry, UK House Price Index. Average prices for Islington, London and England, August 2006 to August 2026.
- GOV.UK, How domestic properties are assessed for Council Tax bands. Accessed 29 October 2026.
- Islington Council, Conservation areas. Accessed 29 October 2026.
- Islington Council, When you do or don't need planning permission and building approval. Accessed 29 October 2026.
- Islington Council, Planning application process. Accessed 29 October 2026.
Thinking of improving rather than moving?
Tell us about your Islington home and what you want to change. We'll give you a free estimate, then up to three vetted builders quote against the same specification.