
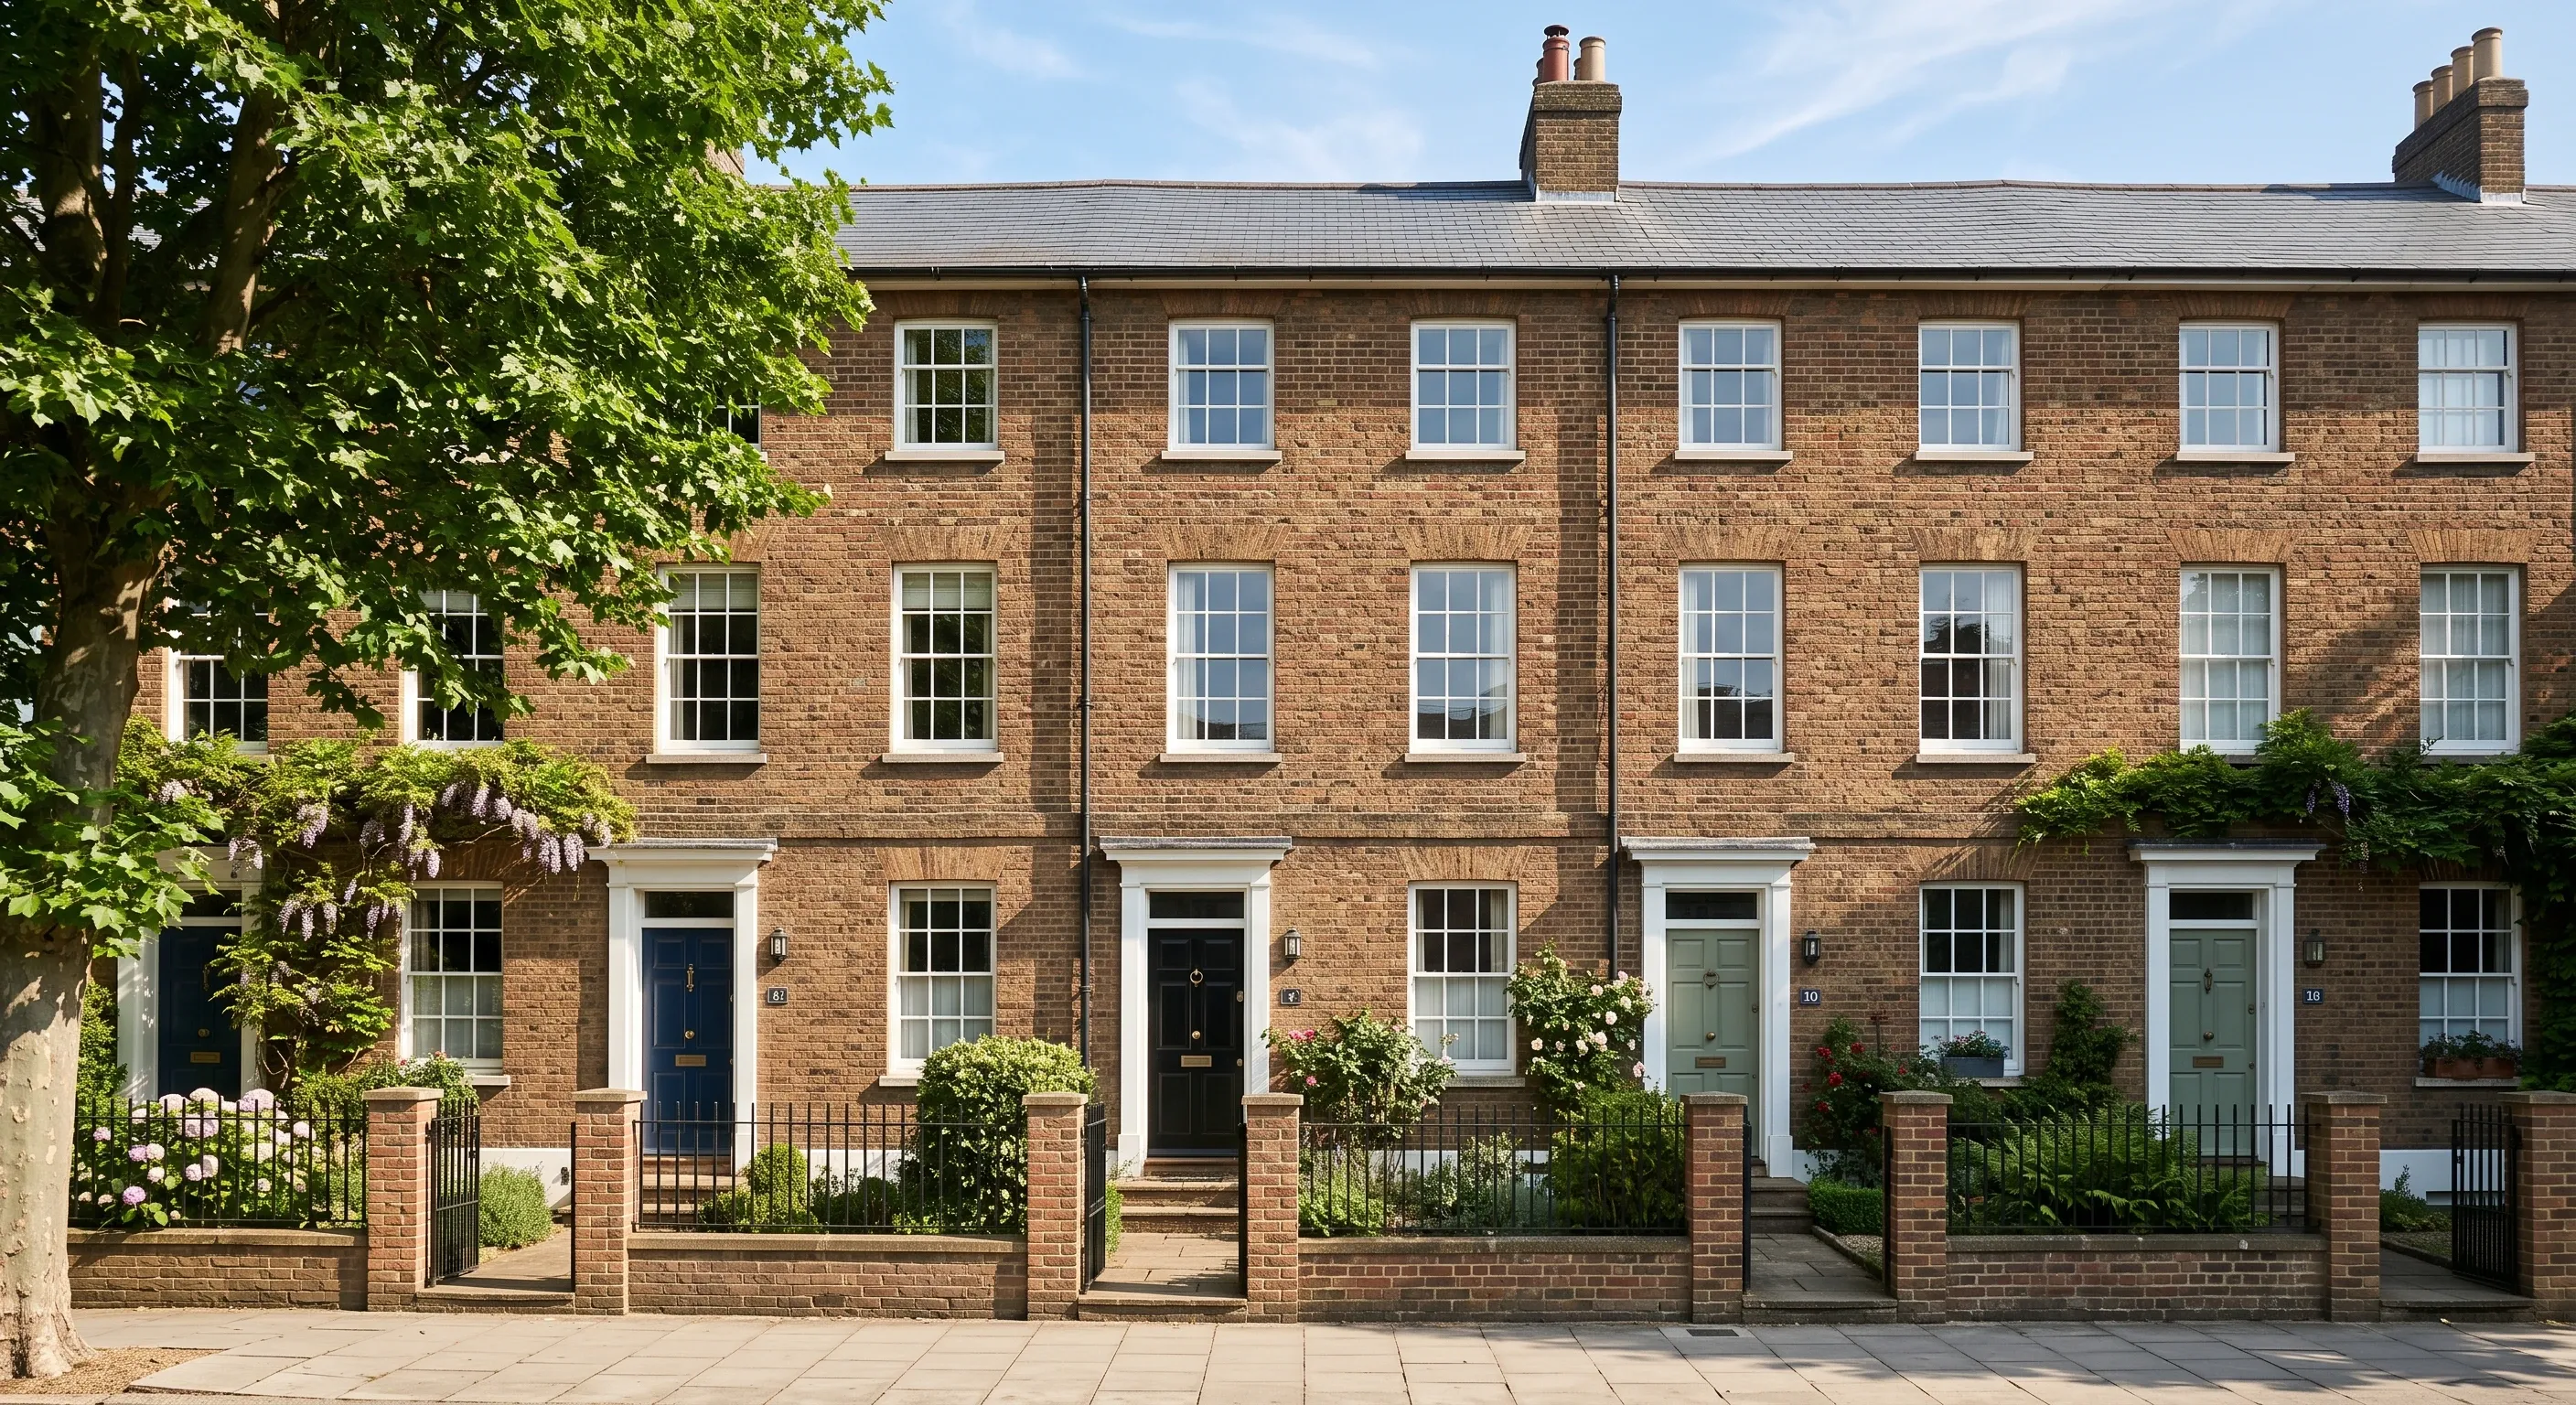
Enfield housing statistics 2026
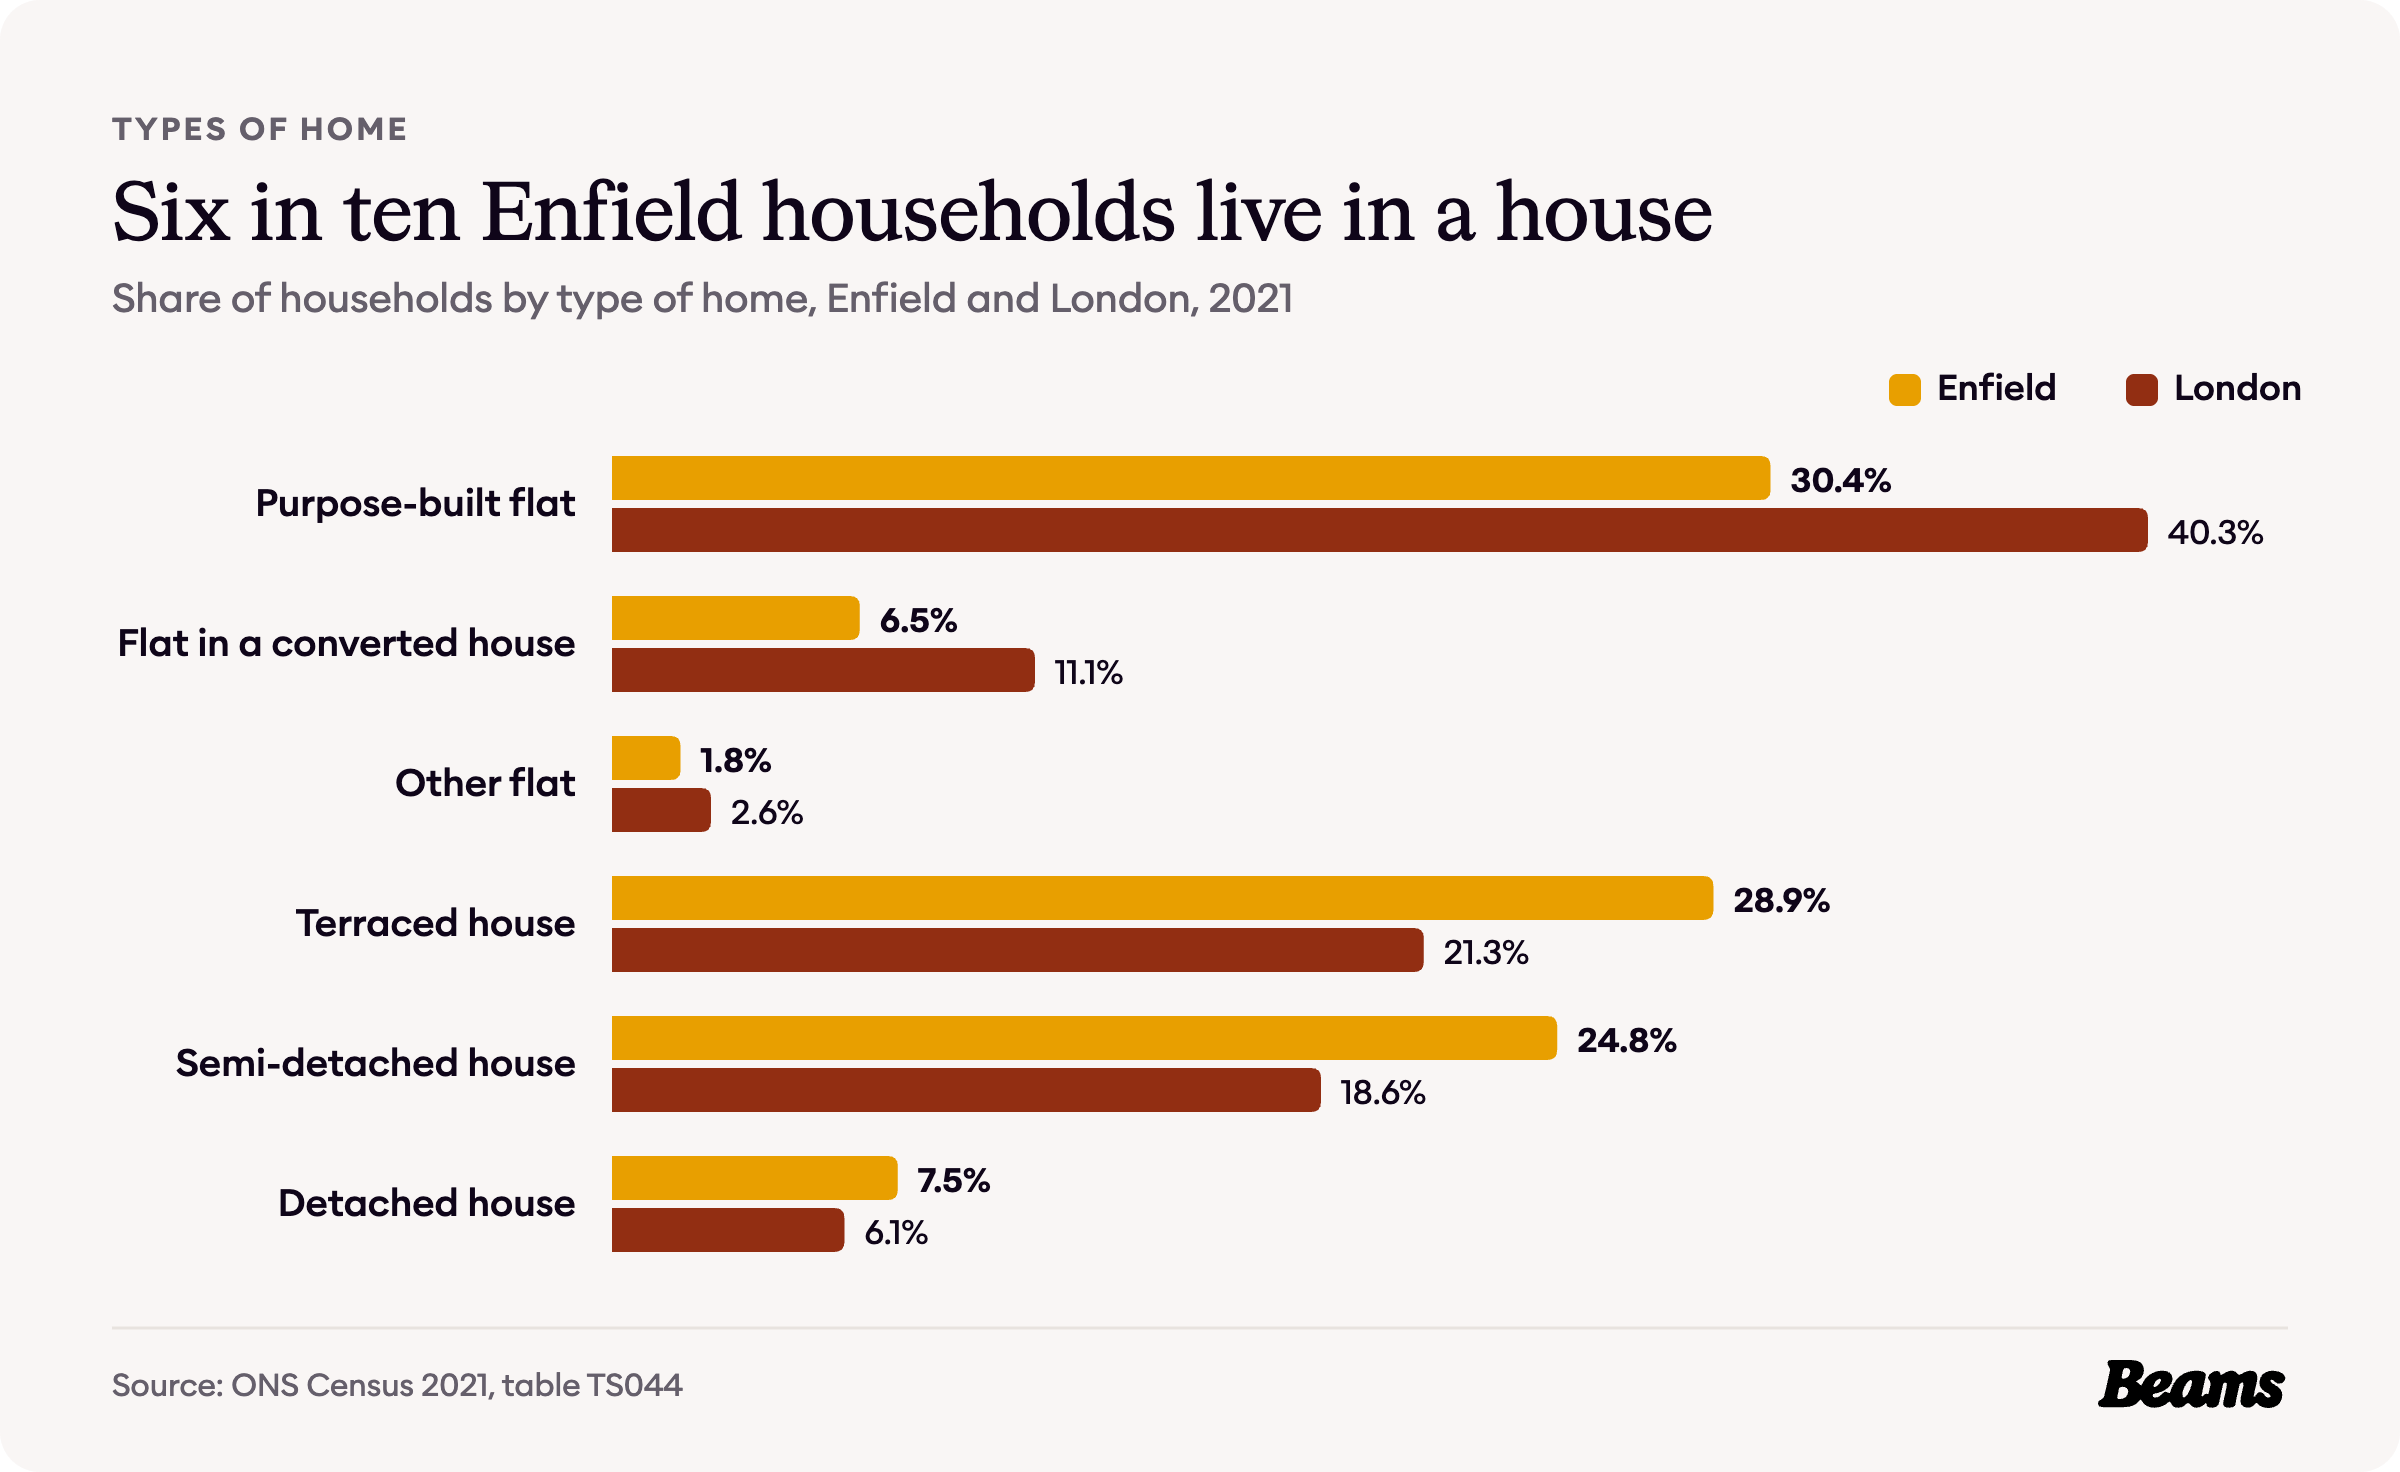
Enfield was built out in the 1930s and then held in by the Green Belt. More than a third of its homes went up between the wars, six in ten households live in a house, and the average home costs about 14% less than London's. These are the numbers behind that story, from the interwar estates to today's £474,855 average home.
Every figure comes from an official source and is dated, so you can see exactly what you are working with before you plan a home renovation in Enfield. The sources are numbered in brackets and listed in full at the end of the page.
When Enfield's homes were built
The opening of Great Cambridge Road through the old parish of Enfield in 1923 to 1924 set off a wave of private building. East of the road, 21 estates for 2,500 houses were approved between 1931 and 1937, and building carried on until 1939. In the south-west, the Piccadilly line extension of 1933 brought a new station and shopping parade to Cockfosters [1].
Then the building slowed right down. After the Second World War, growth was restricted by Green Belt legislation and largely confined to rebuilding by the council and infilling by private firms [1].
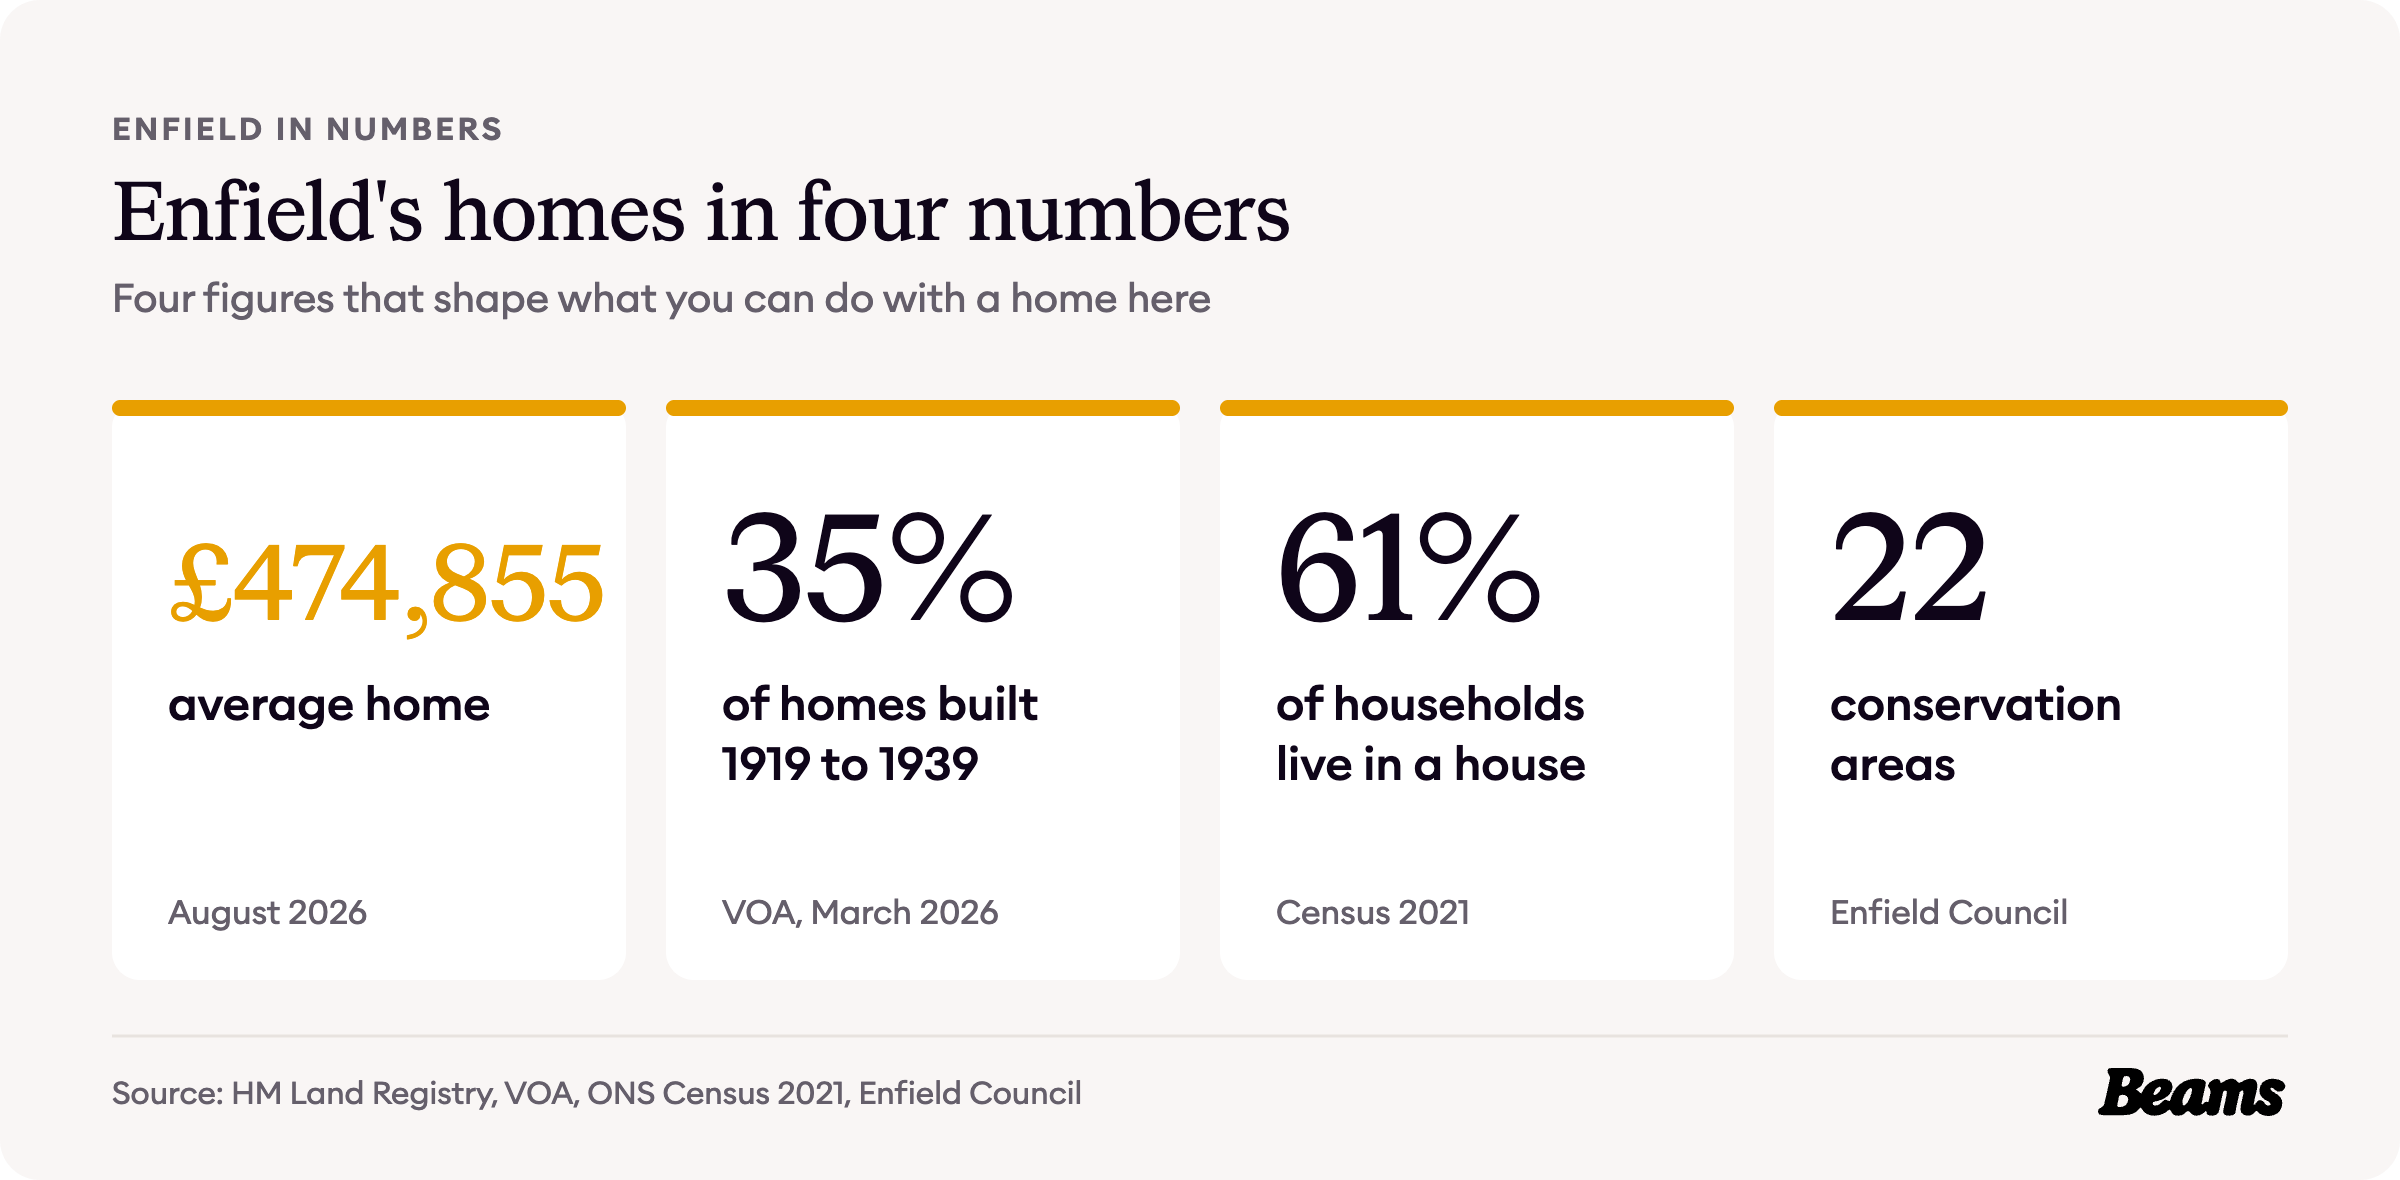
The Valuation Office Agency figures show the result. Of Enfield's 128,970 homes, 35.0% were built between 1919 and 1939, against 22.0% across London. Only 11.7% date from 2000 onwards, compared with 18.5% for London, and 10.6% from before 1900 [2].
Interwar terraces and semis usually have a pitched roof with usable space inside it, which makes a loft conversion in Enfield the most direct way to add a bedroom without building out into the garden.
How Enfield households live
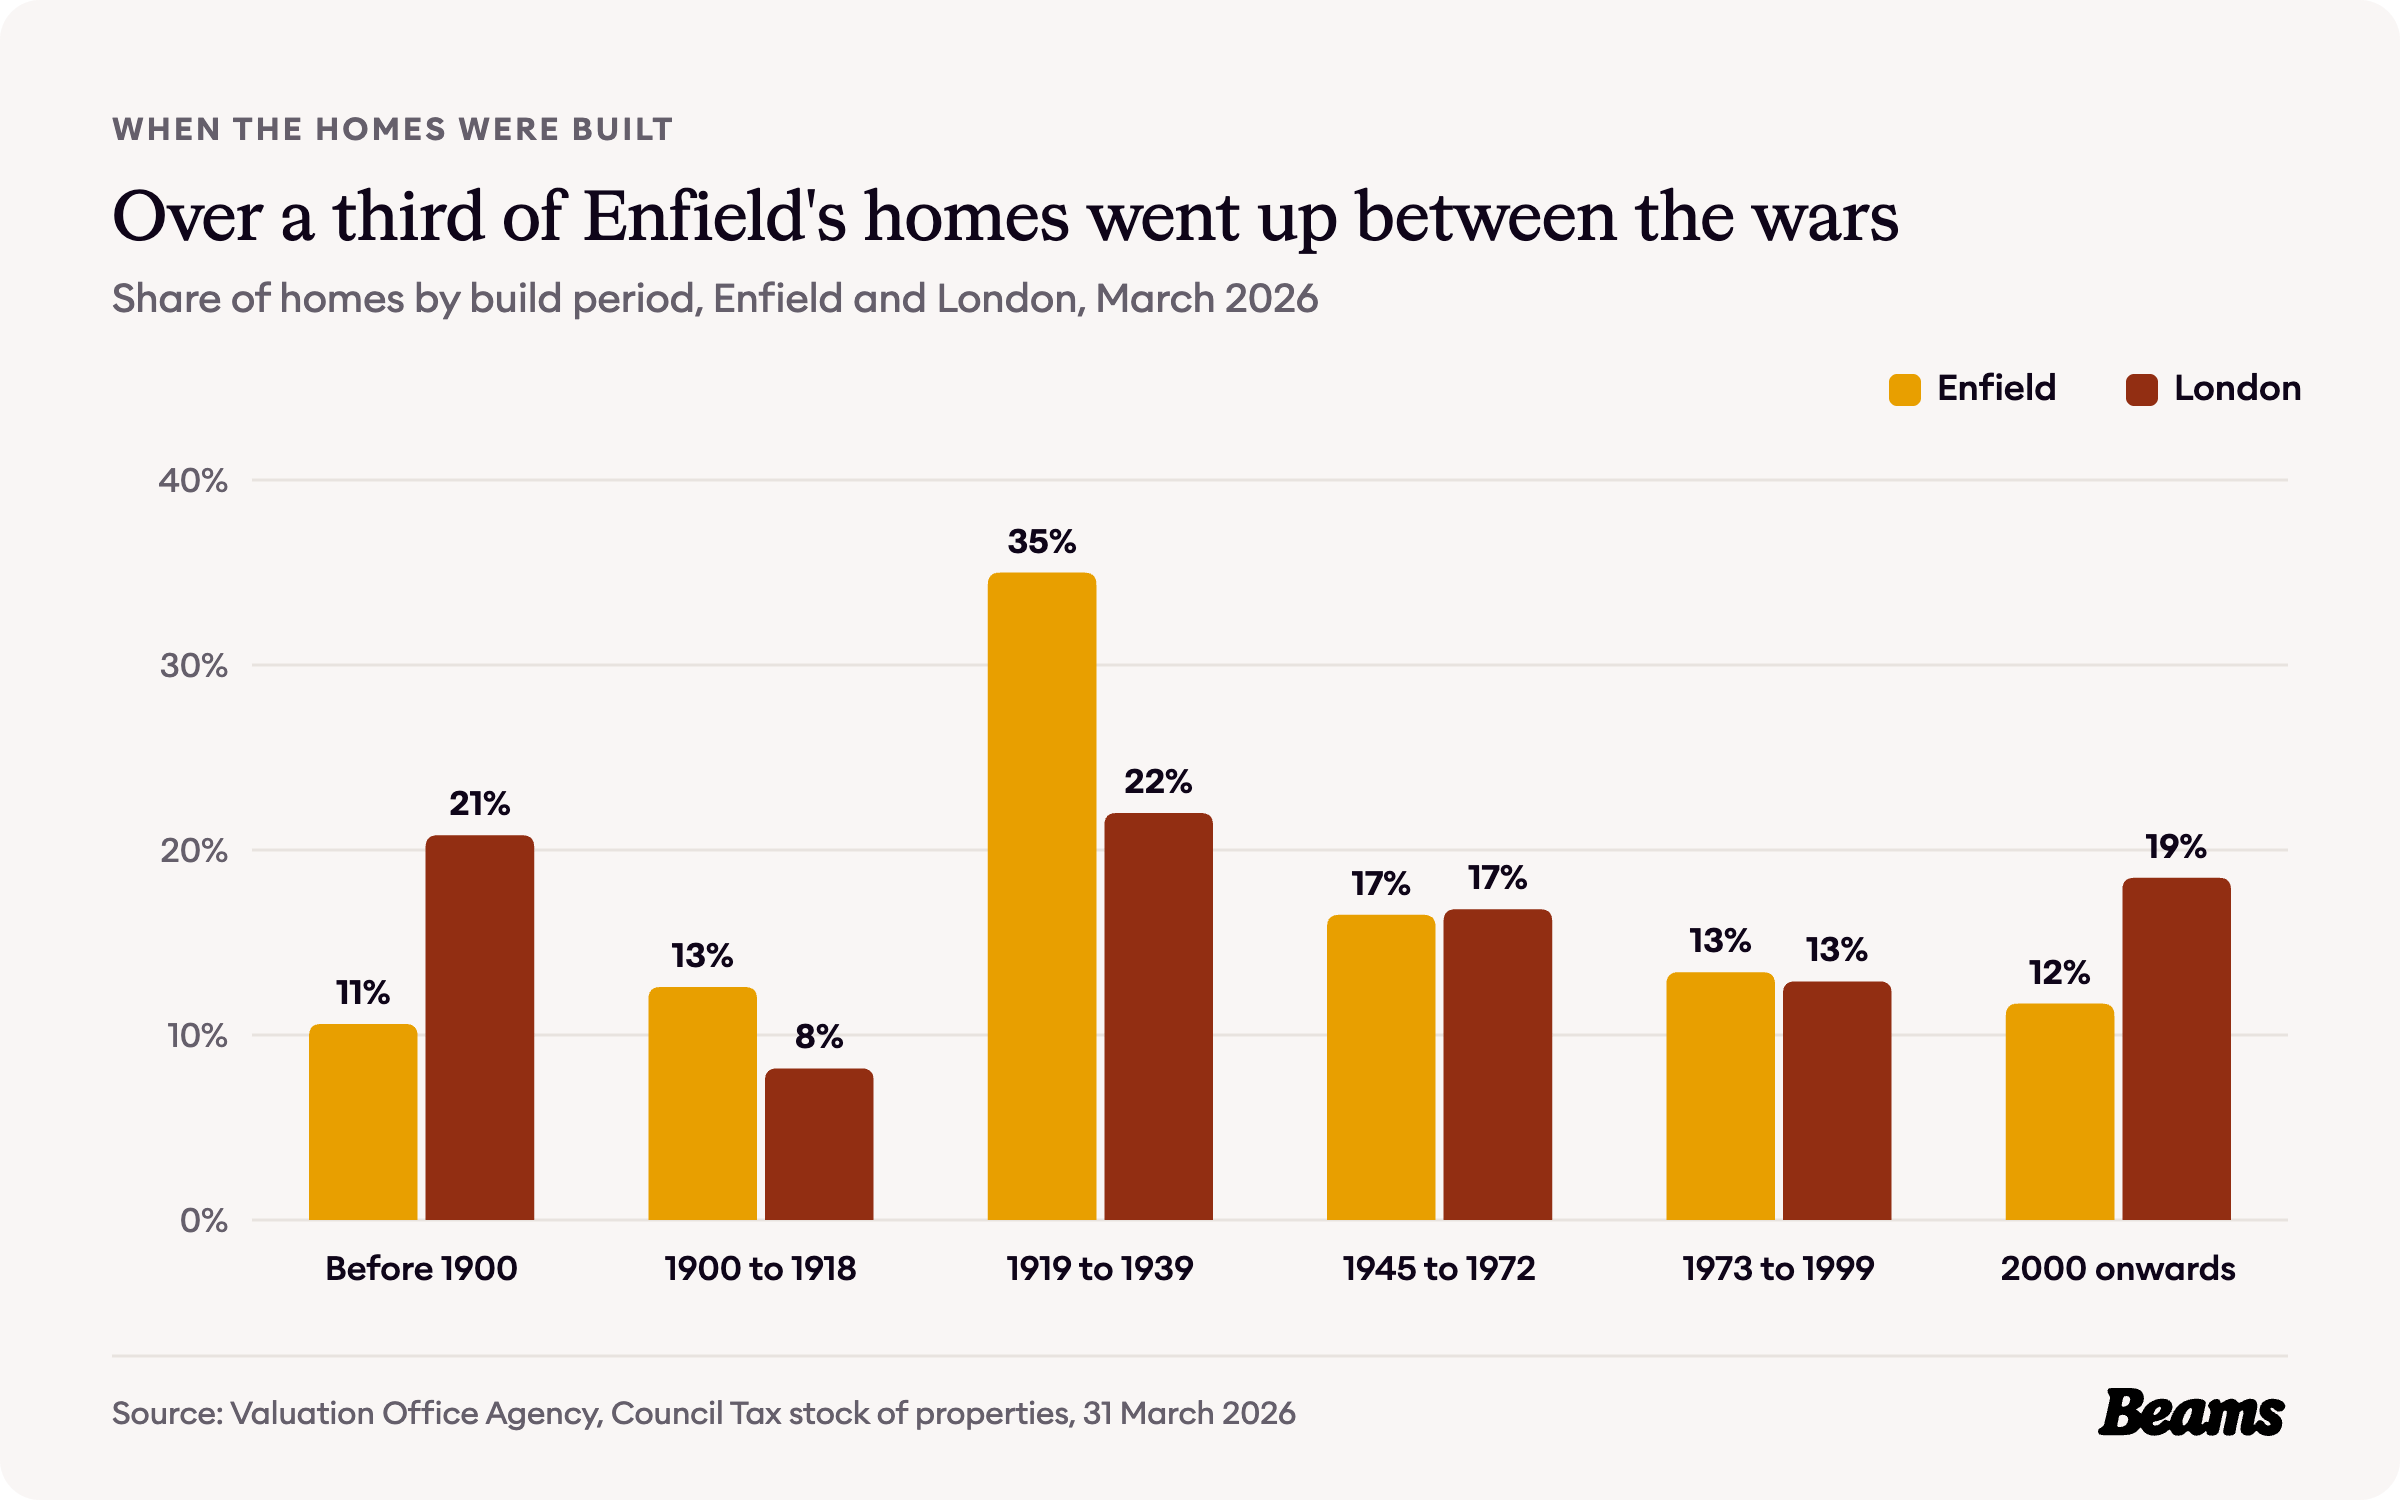
Six in ten Enfield households live in a house. The 2021 Census found 61.2% in a house of some kind, against 46.0% across London [3].
Purpose-built flats are the largest single group, at 30.4% of households, but terraced houses are close behind at 28.9%, against 21.3% across London. Another 24.8% live in a semi-detached house. Only 6.5% live in a flat inside a converted house, against 11.1% for London [3].
With so many households in family houses of the same age, much of the renovation work in Enfield happens on the ground floor of a house, and a kitchen renovation in Enfield is often where it starts.
Who owns Enfield's homes
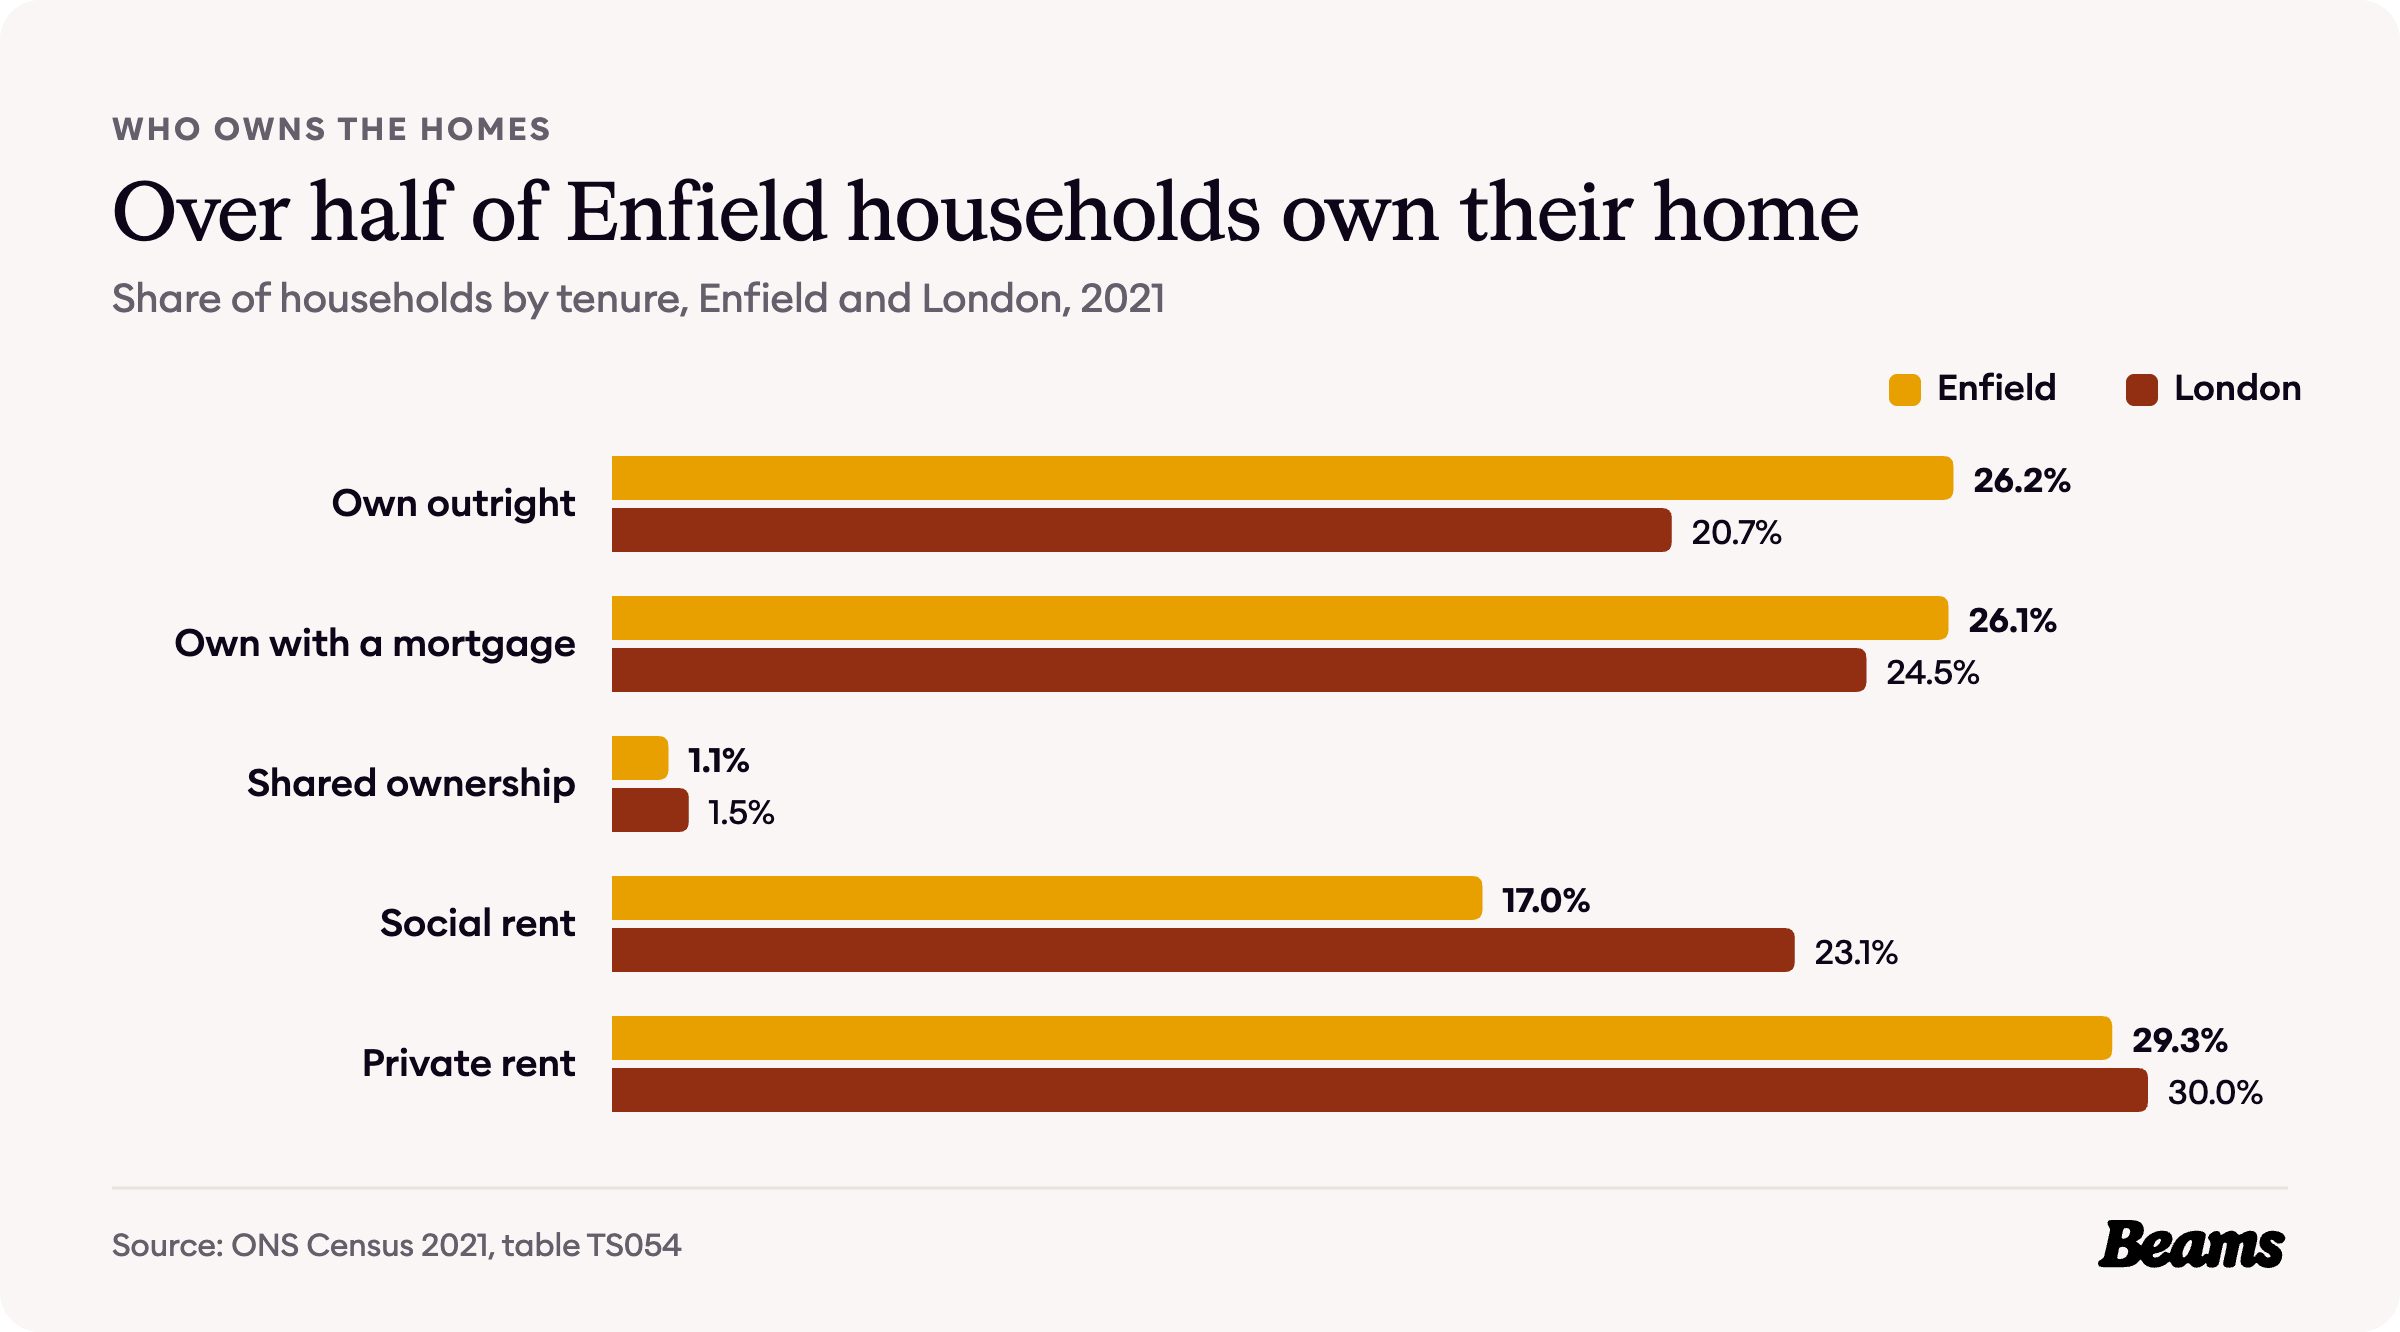
More than half of Enfield households own their home. 26.2% own outright and 26.1% with a mortgage, 52.3% in all, against 45.2% across London [4].
17.0% rent from the council or a housing association, below London's 23.1%, and 29.3% rent privately, close to London's 30.0% [4].
What an Enfield home costs
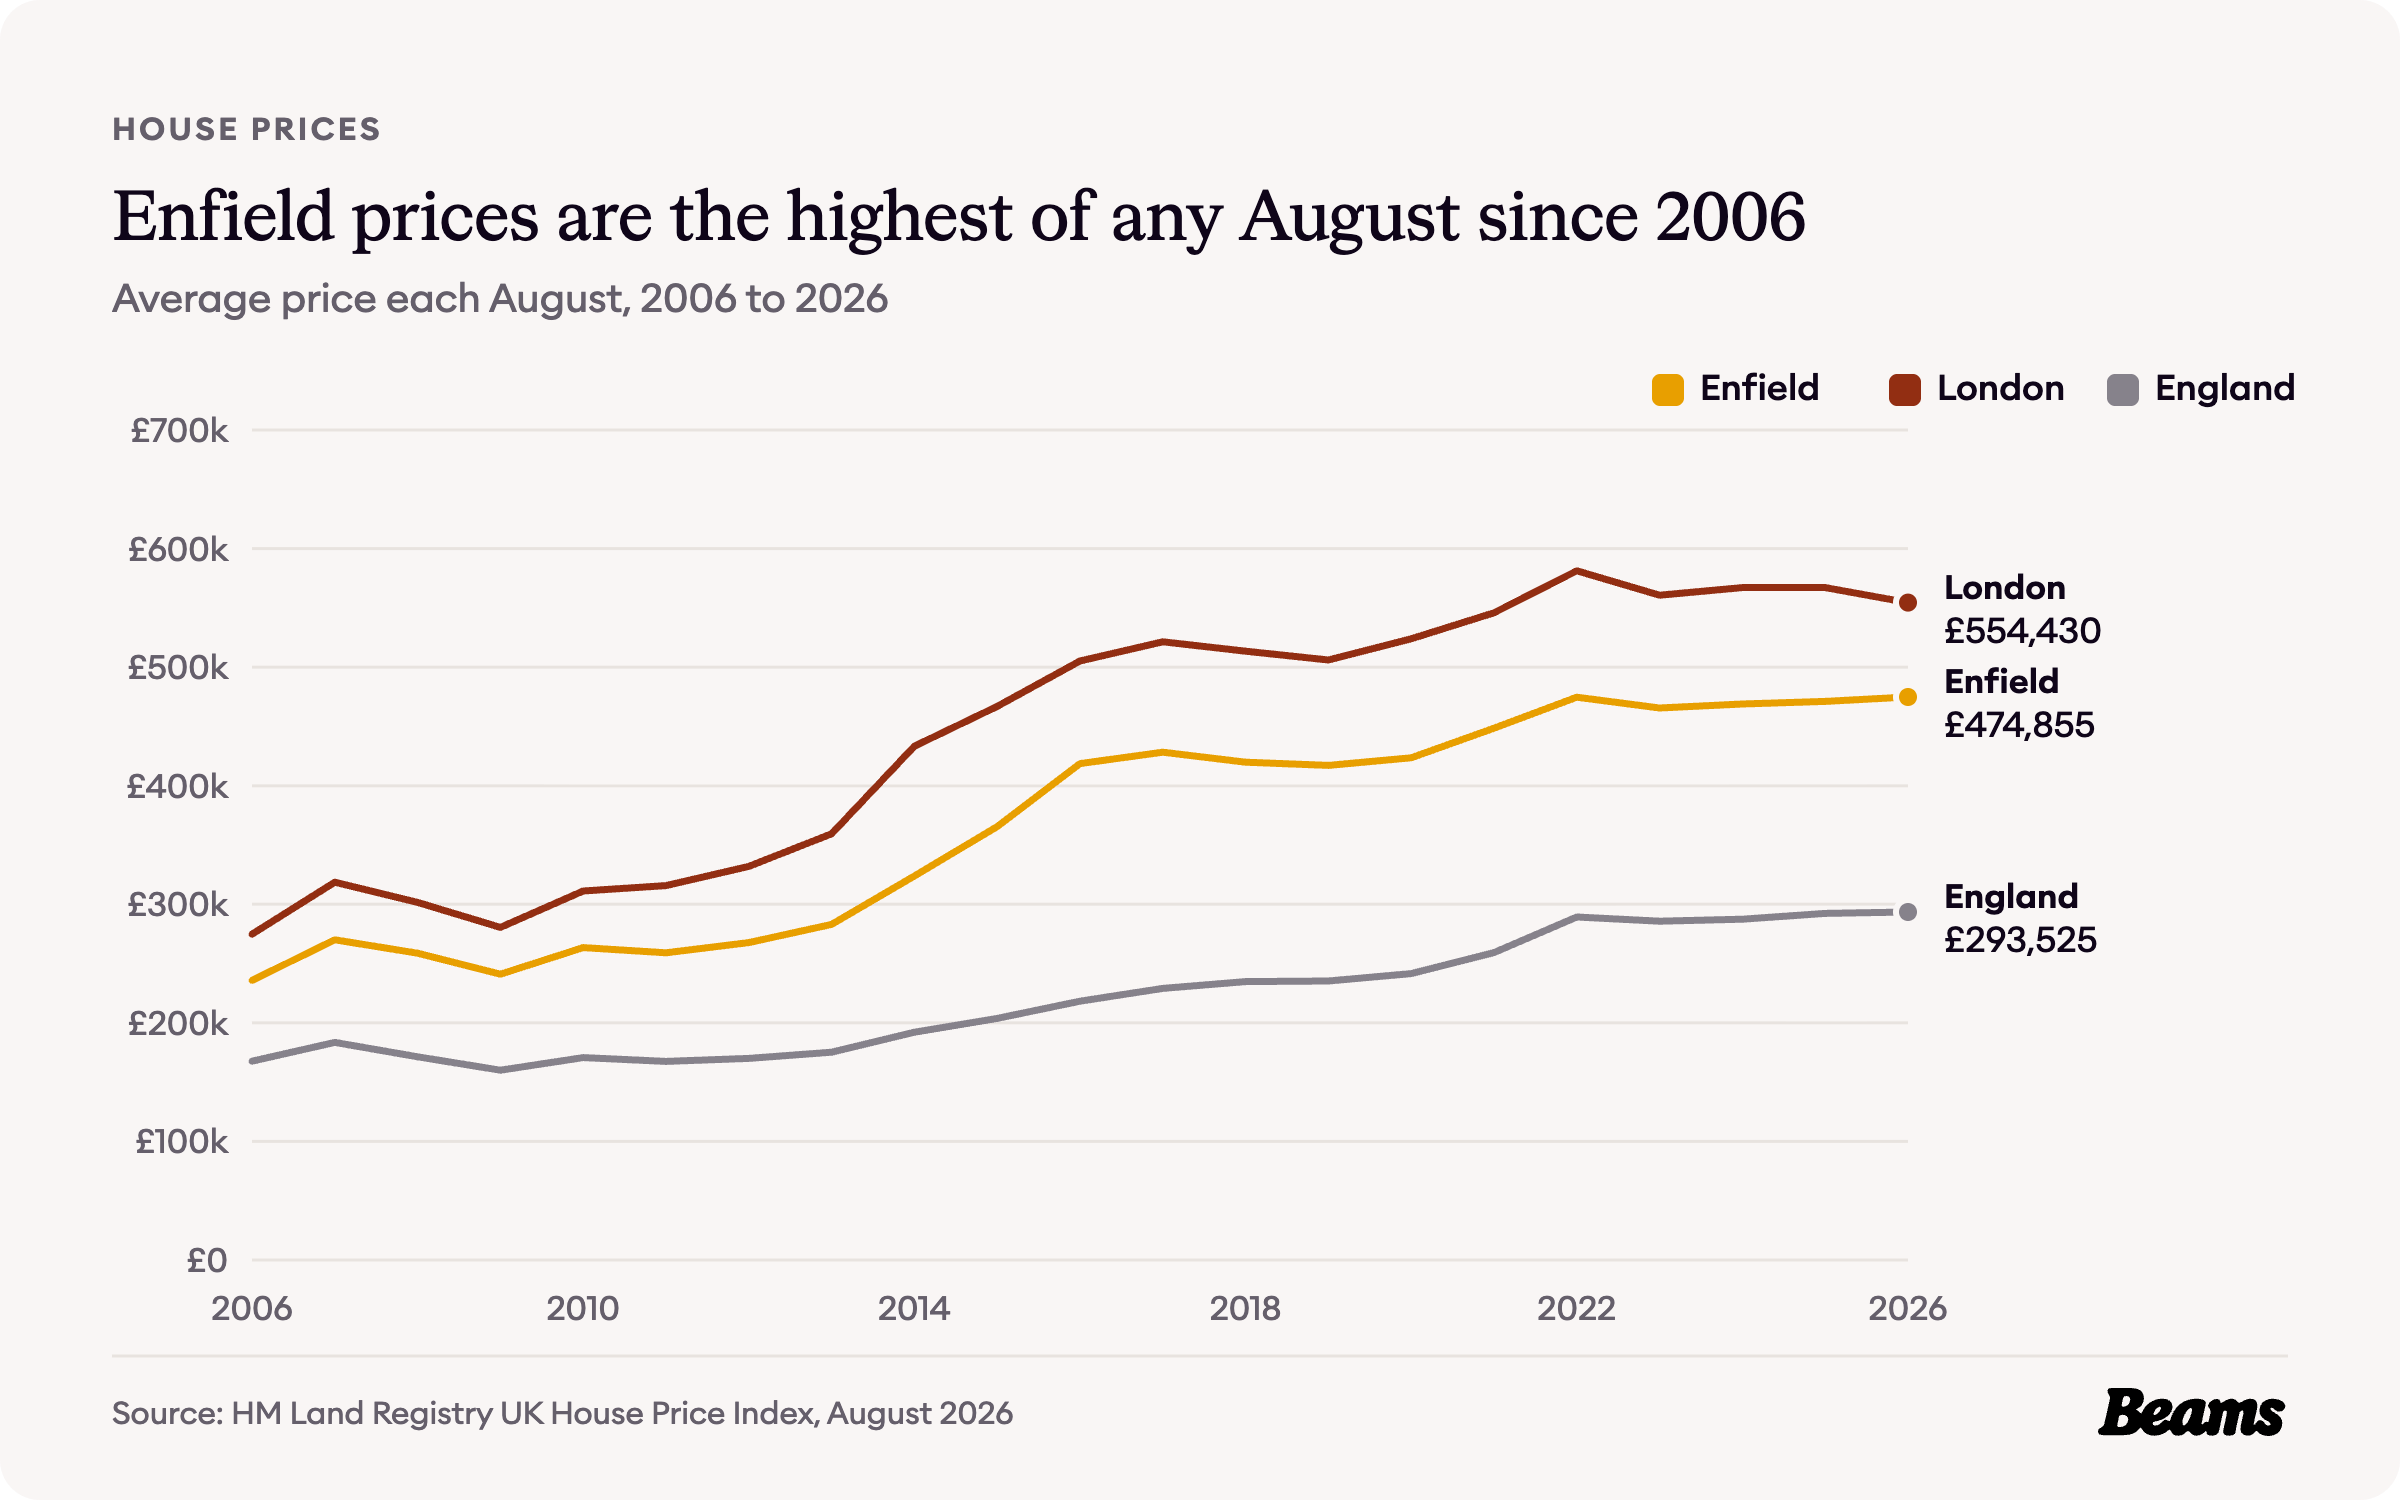
The average Enfield home cost £474,855 in August 2026, 0.8% more than a year earlier [5]. Across London, prices fell by 2.2% over the same year to £554,430, which leaves Enfield about 14% below the London average. It is still about 1.6 times the England average of £293,525 [6].
Enfield has sat below the London average every August for twenty years. In August 2006 the average home here cost £235,882, against London's £274,815. Prices have roughly doubled in both places since, and the August 2026 figure is the highest Enfield has seen in any August in that time. The biggest rise came between 2015 and 2016, when the average went from £365,479 to £418,609 [6].
Flats, terraces and the gap between them
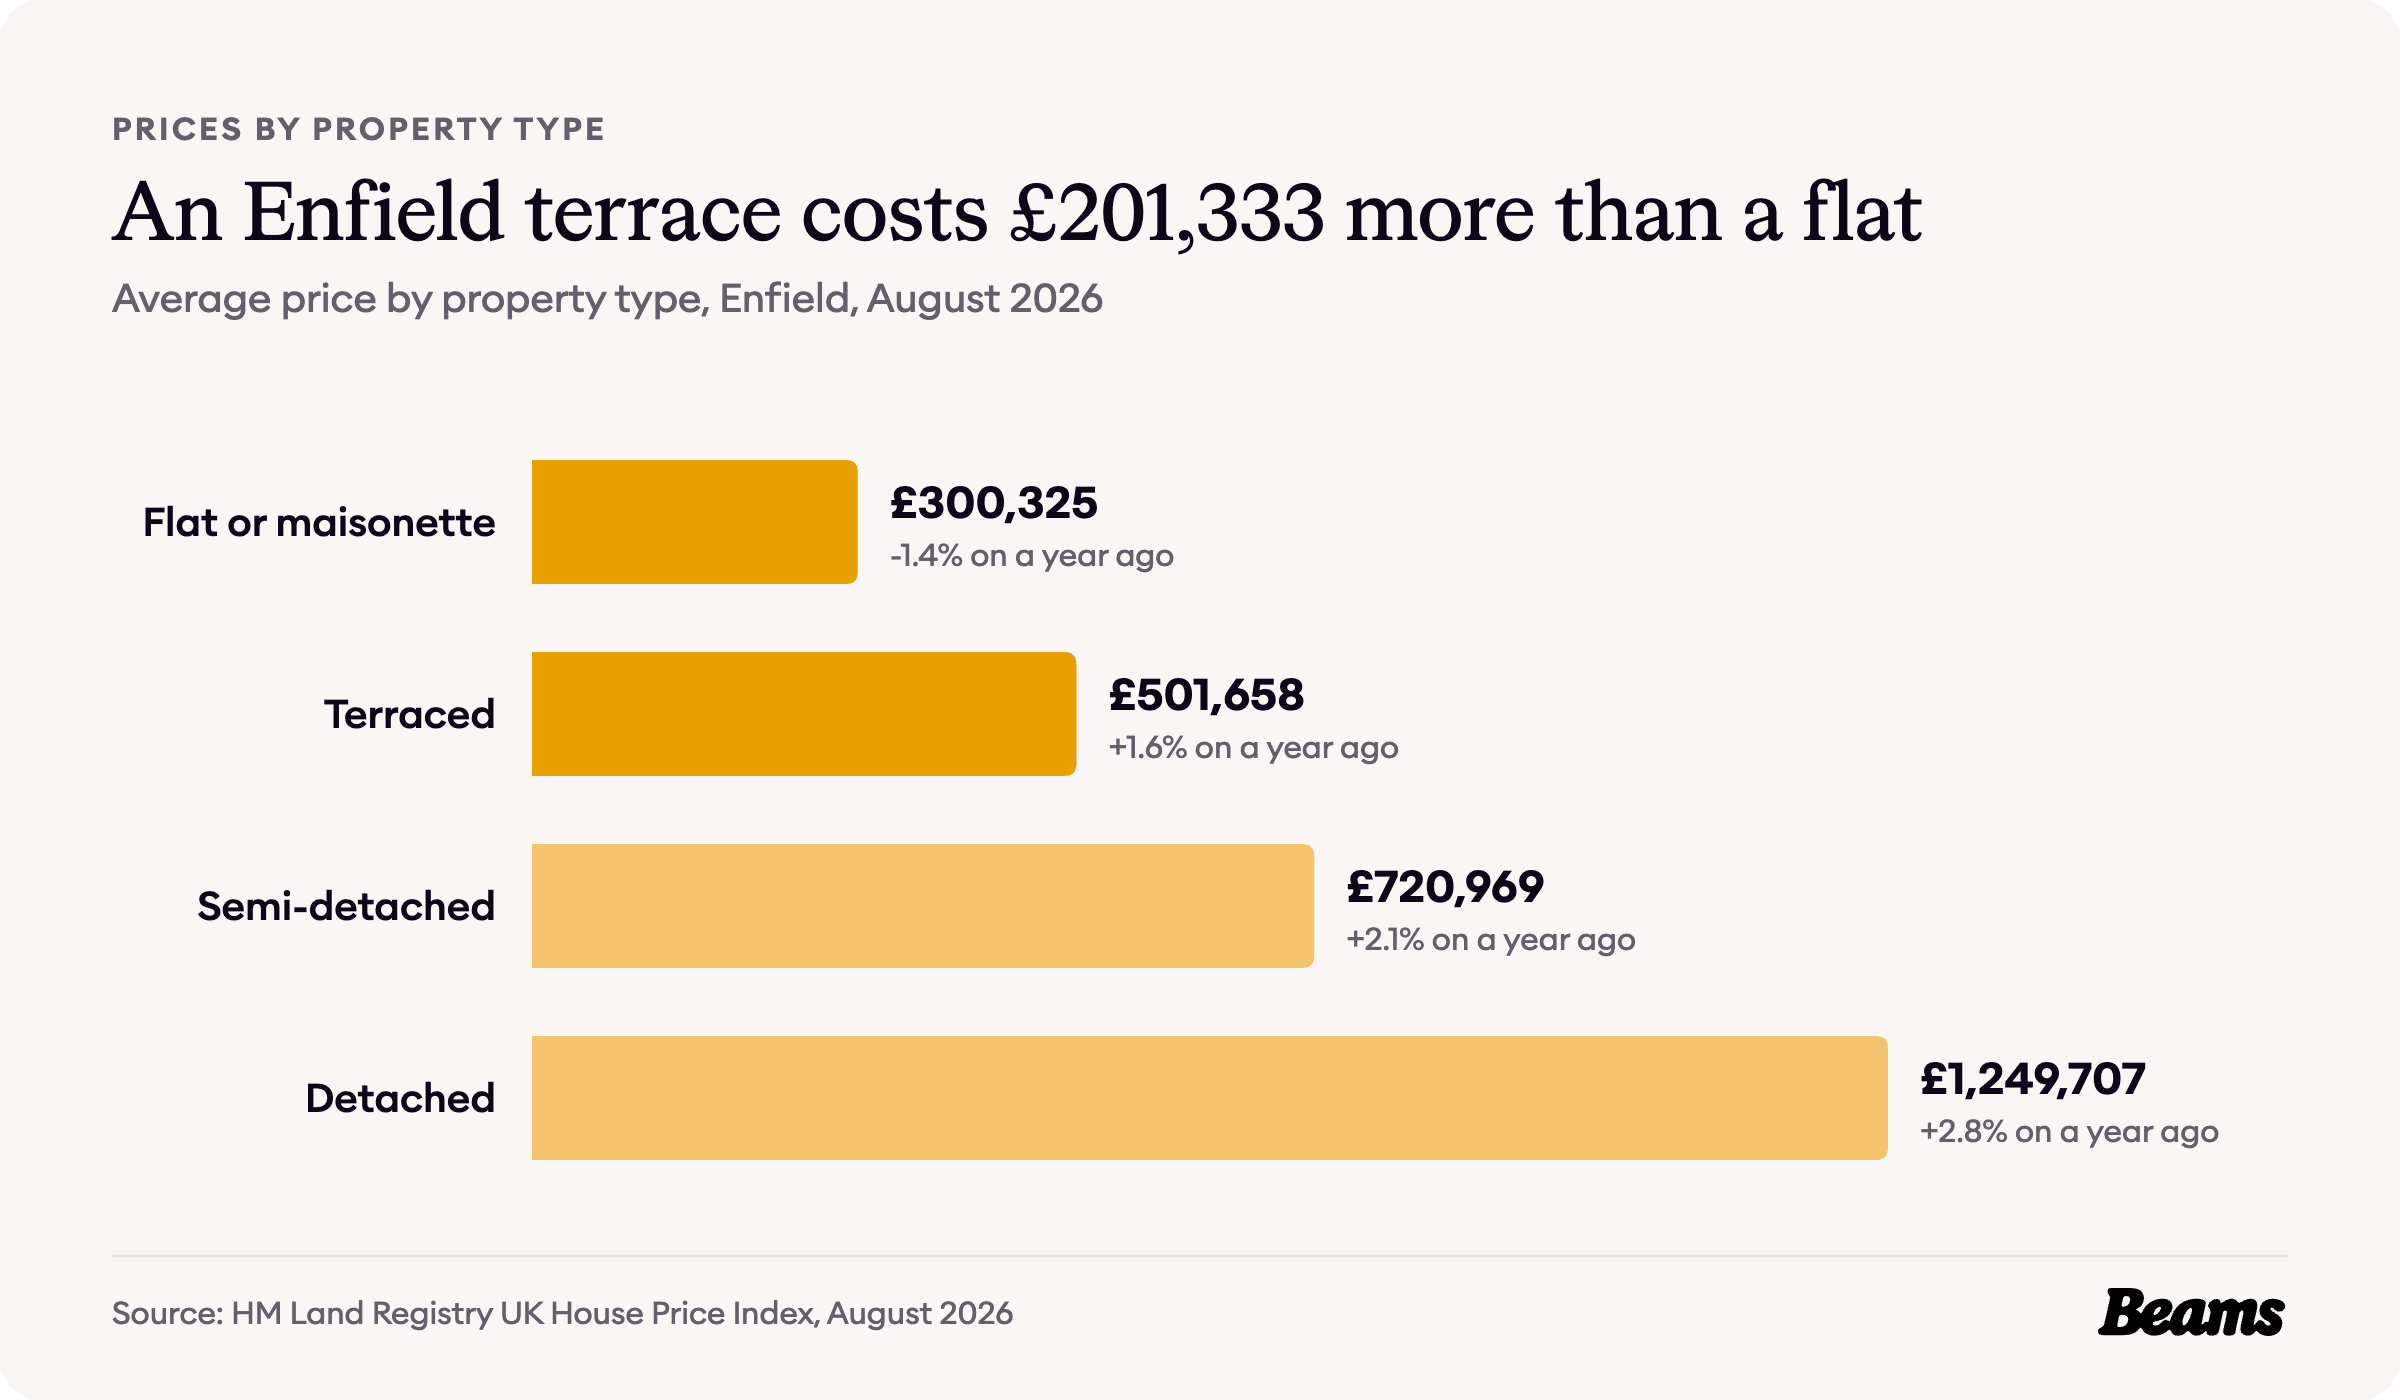
A flat or maisonette in Enfield averaged £300,325 in August 2026 and a terraced house £501,658, a gap of £201,333. Semi-detached homes averaged £720,969 and detached homes £1,249,707 [5].
Flats and terraces here are both well below the London averages of £427,310 and £648,650 [5] [6]. The step up from a terrace to a semi is bigger still than the step from a flat to a terrace.
First-time buyers paid an average of £401,763 in August 2026, while owners moving home paid £605,105 [5]. For a family that likes its street but has run out of room, a house extension in Enfield adds the space without paying for the next rung of the ladder.
What it costs to rent in Enfield
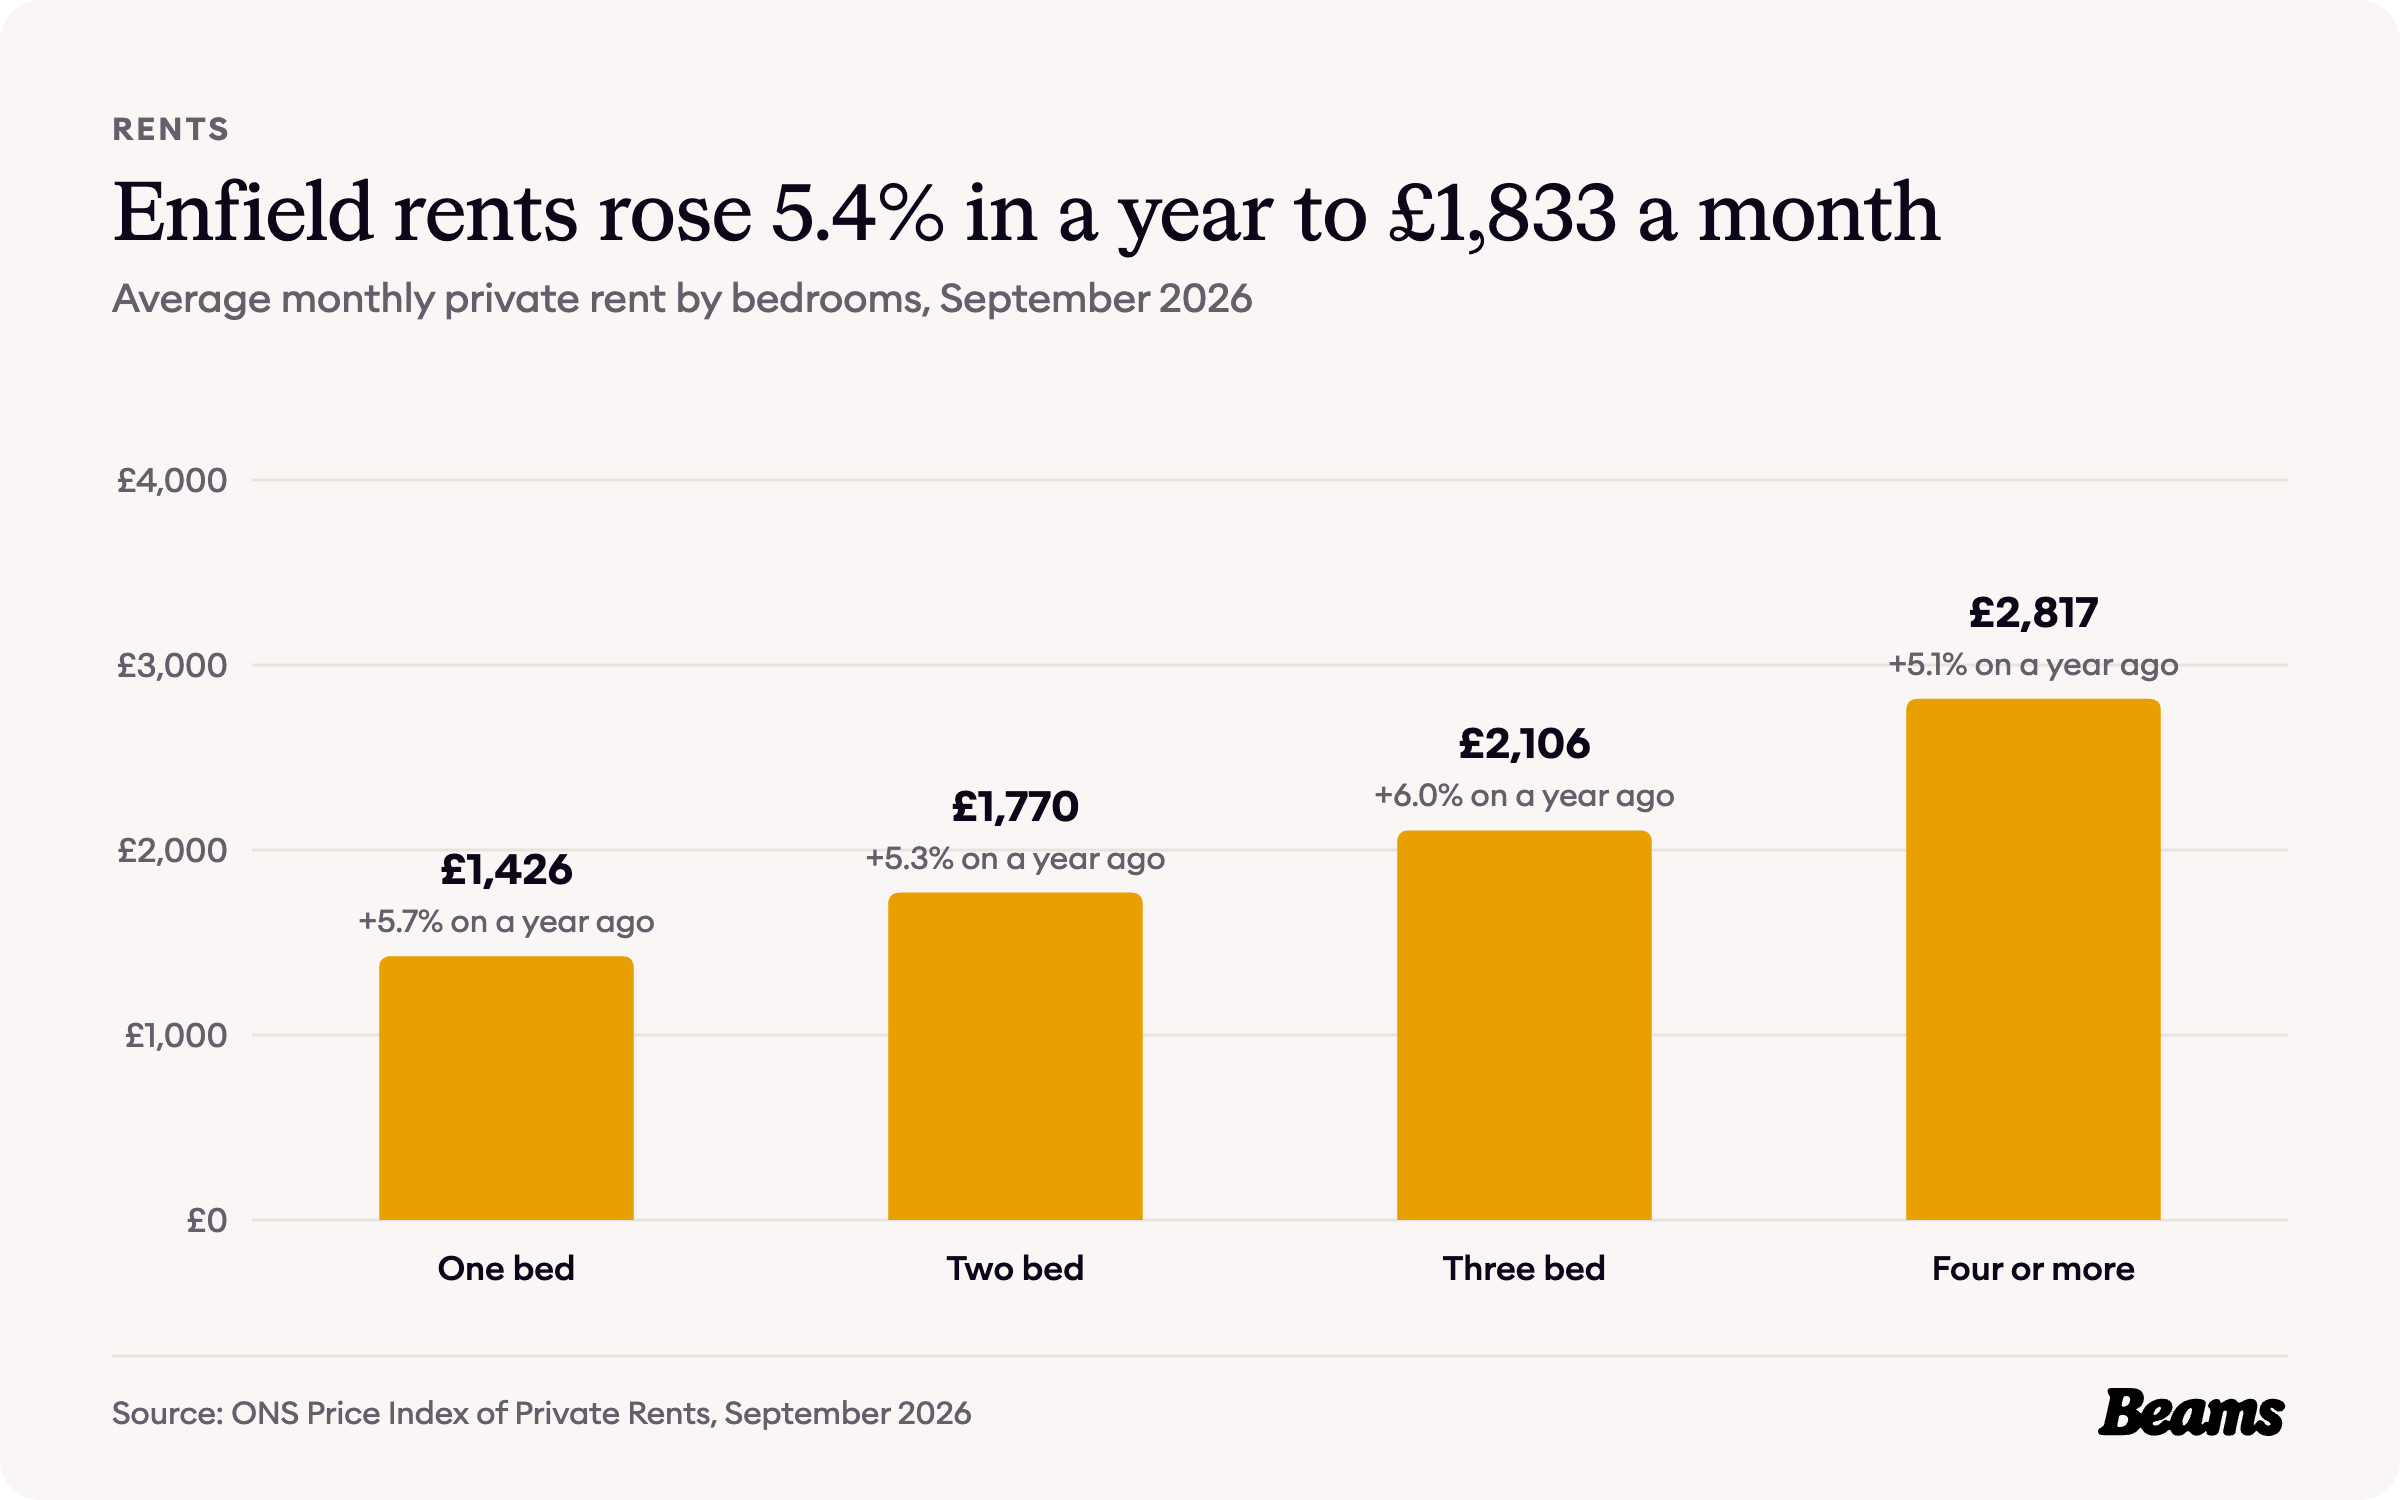
The average private rent in Enfield was £1,833 a month in September 2026, up 5.4% on a year earlier [5]. A one-bedroom home averaged £1,426 a month, and a three-bedroom home £2,106 after a 6.0% rise in a year. Homes with four or more bedrooms averaged £2,817.
For the 29.3% of households who rent privately, and the landlords who let to them, a dated bathroom is often the first thing a bathroom renovation in Enfield puts right between tenancies.
Council Tax bands in Enfield
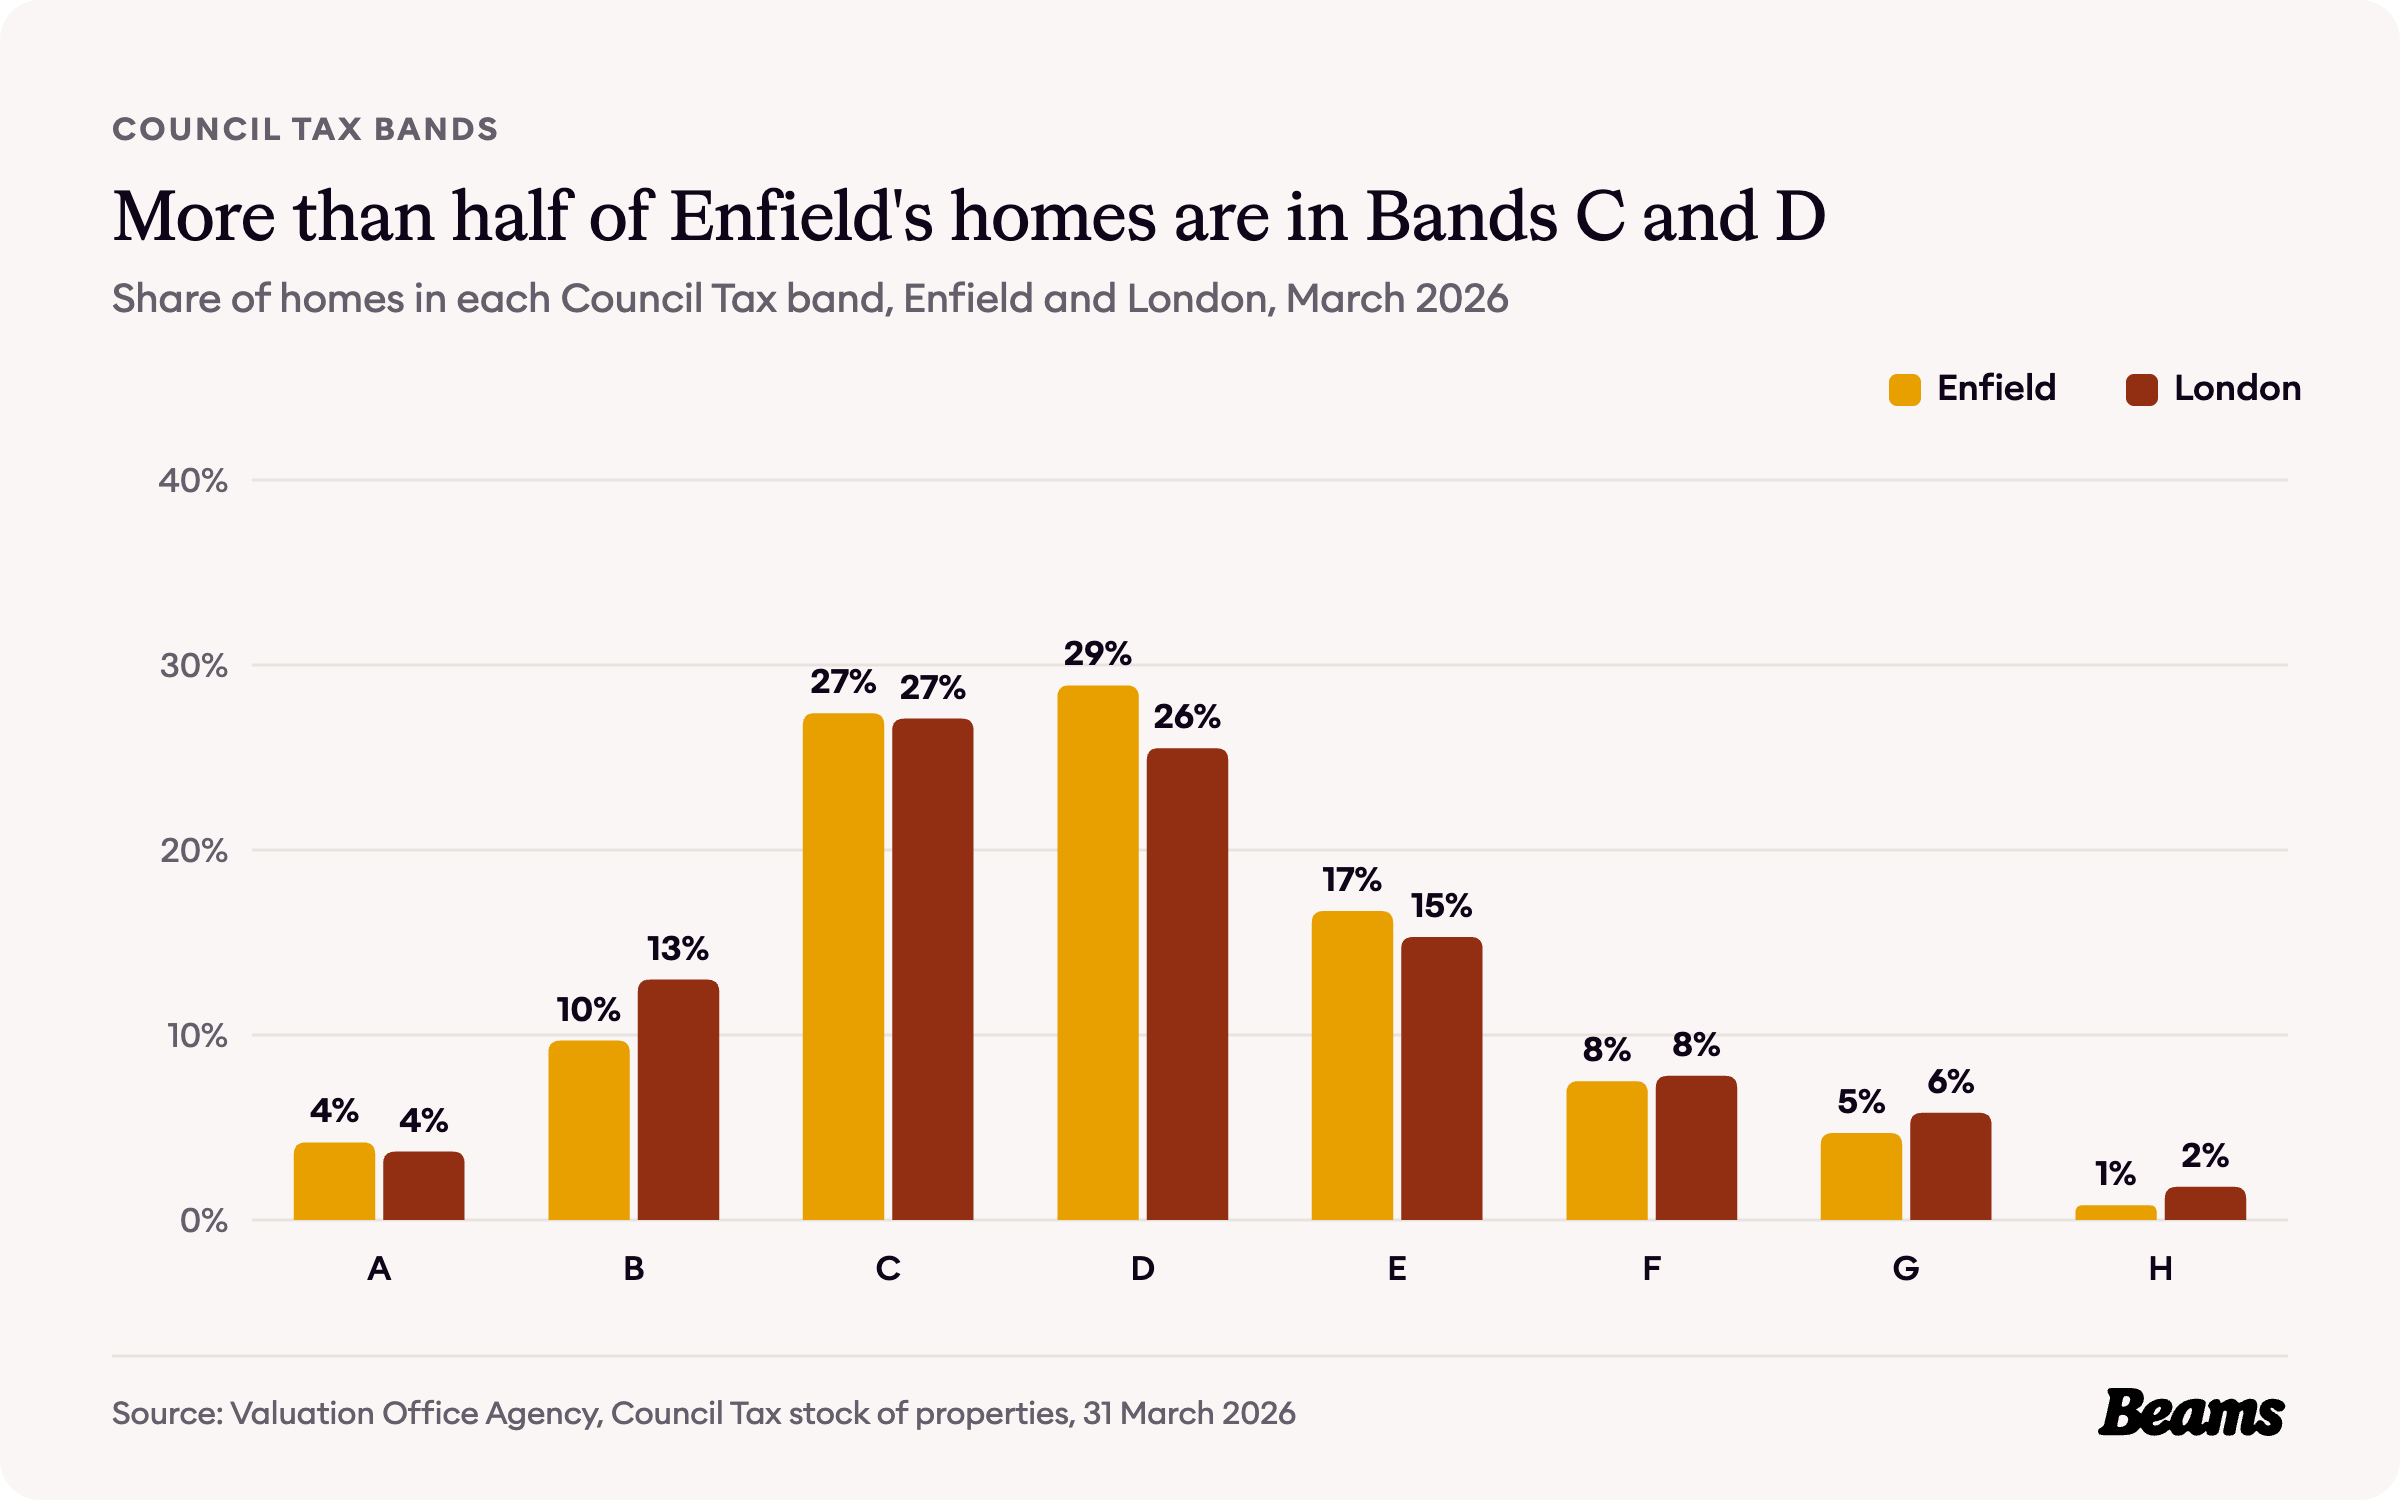
Council Tax bands are based on what a home would have sold for on the open market on 1 April 1991 [7]. Enfield sits close to the London pattern. Band D is the largest, with 28.9% of homes against 25.5% for London, and Bands C and D together hold 56.3% of homes [2].
Only 5.5% of Enfield homes are in Bands G and H, against 7.6% across London, while 13.9% are in Bands A and B, against 16.7% [2].
The rules on your street
Enfield has 22 conservation areas, including Enfield Town, Forty Hill, Bush Hill Park, Winchmore Hill, Grange Park and the Lakes Estate [8].
Article 4 directions, which withdraw permitted development rights for specified works, cover all or part of 15 of them, including Bush Hill Park, Enfield Town, Grange Park, Winchmore Hill and Abbotshall Avenue. Where one applies, a planning application is needed before an owner can carry out those works [9]. Digging down is one of the jobs where those rules matter most, so a basement conversion in Enfield starts with a check of the address.
Enfield Council says it aims to decide minor applications, including householder applications, within 8 weeks of an application being confirmed as valid. It also says applications are decided in the form in which they were validated, with no chance to make amendments unless formal pre-application advice was sought first [10]. That makes it worth getting the drawings right before you apply, and asking up to three vetted builders in Enfield to quote against the same plans.
Enfield housing statistics at a glance
- Average house price, August 2026: £474,855 (London £554,430) [5] [6]
- Change on a year earlier: +0.8% (London -2.2%) [5] [6]
- Average flat or maisonette: £300,325 (London £427,310) [5] [6]
- Average terraced house: £501,658 (London £648,650) [5] [6]
- Average private rent, September 2026: £1,833 a month [5]
- Homes built 1919 to 1939: 35.0% (London 22.0%) [2]
- Homes built since 2000: 11.7% (London 18.5%) [2]
- Households living in a house: 61.2% (London 46.0%) [3]
- Households who own their home: 52.3% (London 45.2%) [4]
- Conservation areas: 22 [8]
Frequently asked questions
References
- British History Online, Enfield: Growth after 1850. Victoria County History of Middlesex, volume 5.
- Valuation Office Agency, Council Tax: stock of properties 2026. Table CTSOP4.1, properties by build period and Council Tax band at 31 March 2026.
- ONS, Census 2021 table TS044: Accommodation type. Households by type of home, Enfield and London.
- ONS, Census 2021 table TS054: Tenure. Households by tenure, Enfield and London.
- ONS, Housing prices in Enfield. UK House Price Index for August 2026 and Price Index of Private Rents for September 2026, published 21 October 2026.
- HM Land Registry, UK House Price Index. Average prices for Enfield, London and England, August 2006 to August 2026.
- GOV.UK, How domestic properties are assessed for Council Tax bands. Accessed 29 October 2026.
- Enfield Council, Conservation areas. Accessed 29 October 2026.
- Enfield Council, Article 4 Directions in conservation areas. Accessed 29 October 2026.
- Enfield Council, Planning application process. Accessed 29 October 2026.
Thinking of improving rather than moving?
Tell us about your Enfield home and what you want to change. We'll give you a free estimate, then up to three vetted builders quote against the same specification.