
Westminster housing statistics 2026
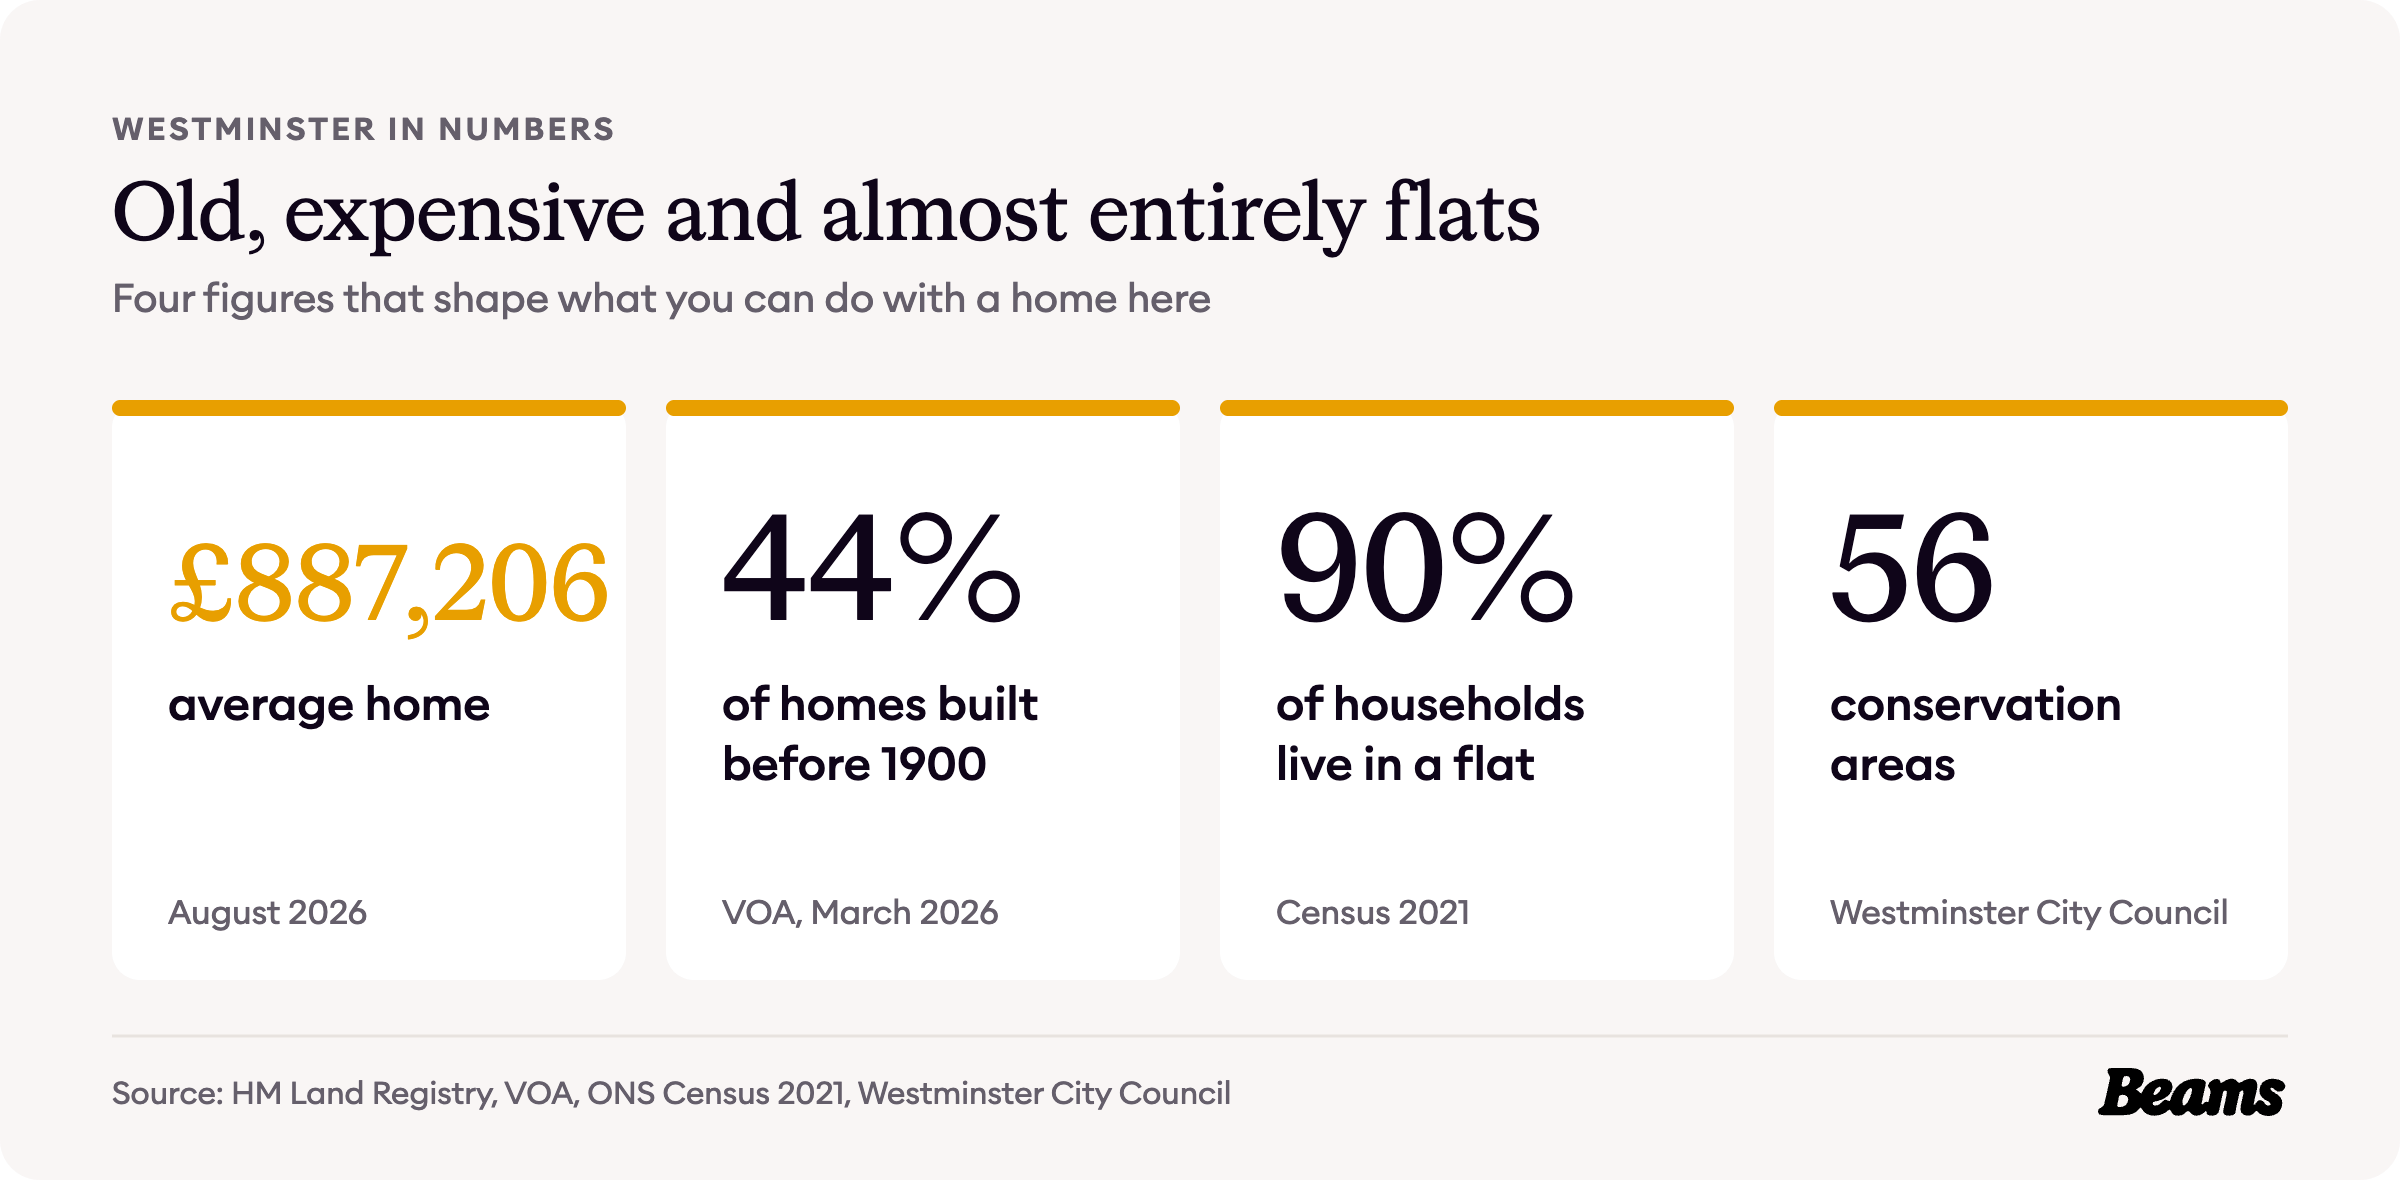
Westminster was laid out by family estates in the 18th century, rebuilt in places as council flats after the war, and is now a city of flats: nine in ten households live in one. These are the numbers behind that story, from the Grosvenor estate in Mayfair to today's £887,206 average home.
Each figure below comes from an official source and carries its date, so you know what you are working with before you plan a home renovation in Westminster. The sources are numbered in brackets and listed in full at the end of the page.
How Westminster was built
Mayfair was built to a plan. In 1720 the Grosvenor family decided to lay out The Hundred Acres in Mayfair for building [1]. Work went on at great pace until 1740, it was more than fifty years before building on the estate was finished, and Horwood's map of 1792 to 1799 shows some 1,375 houses on it [2].
Two centuries later the city council rebuilt a large part of Pimlico. Rather than a string of small schemes, it chose a single, very large site, and Churchill Gardens, public housing that is mainly flats, was built there by Powell and Moya for Westminster City Council in four main phases between 1947 and 1962. It was planned with 1,661 flats, heated by waste heat piped from Battersea Power Station across the river, and Historic England describes it as part of the first large-scale housing development in England after the Second World War [3].
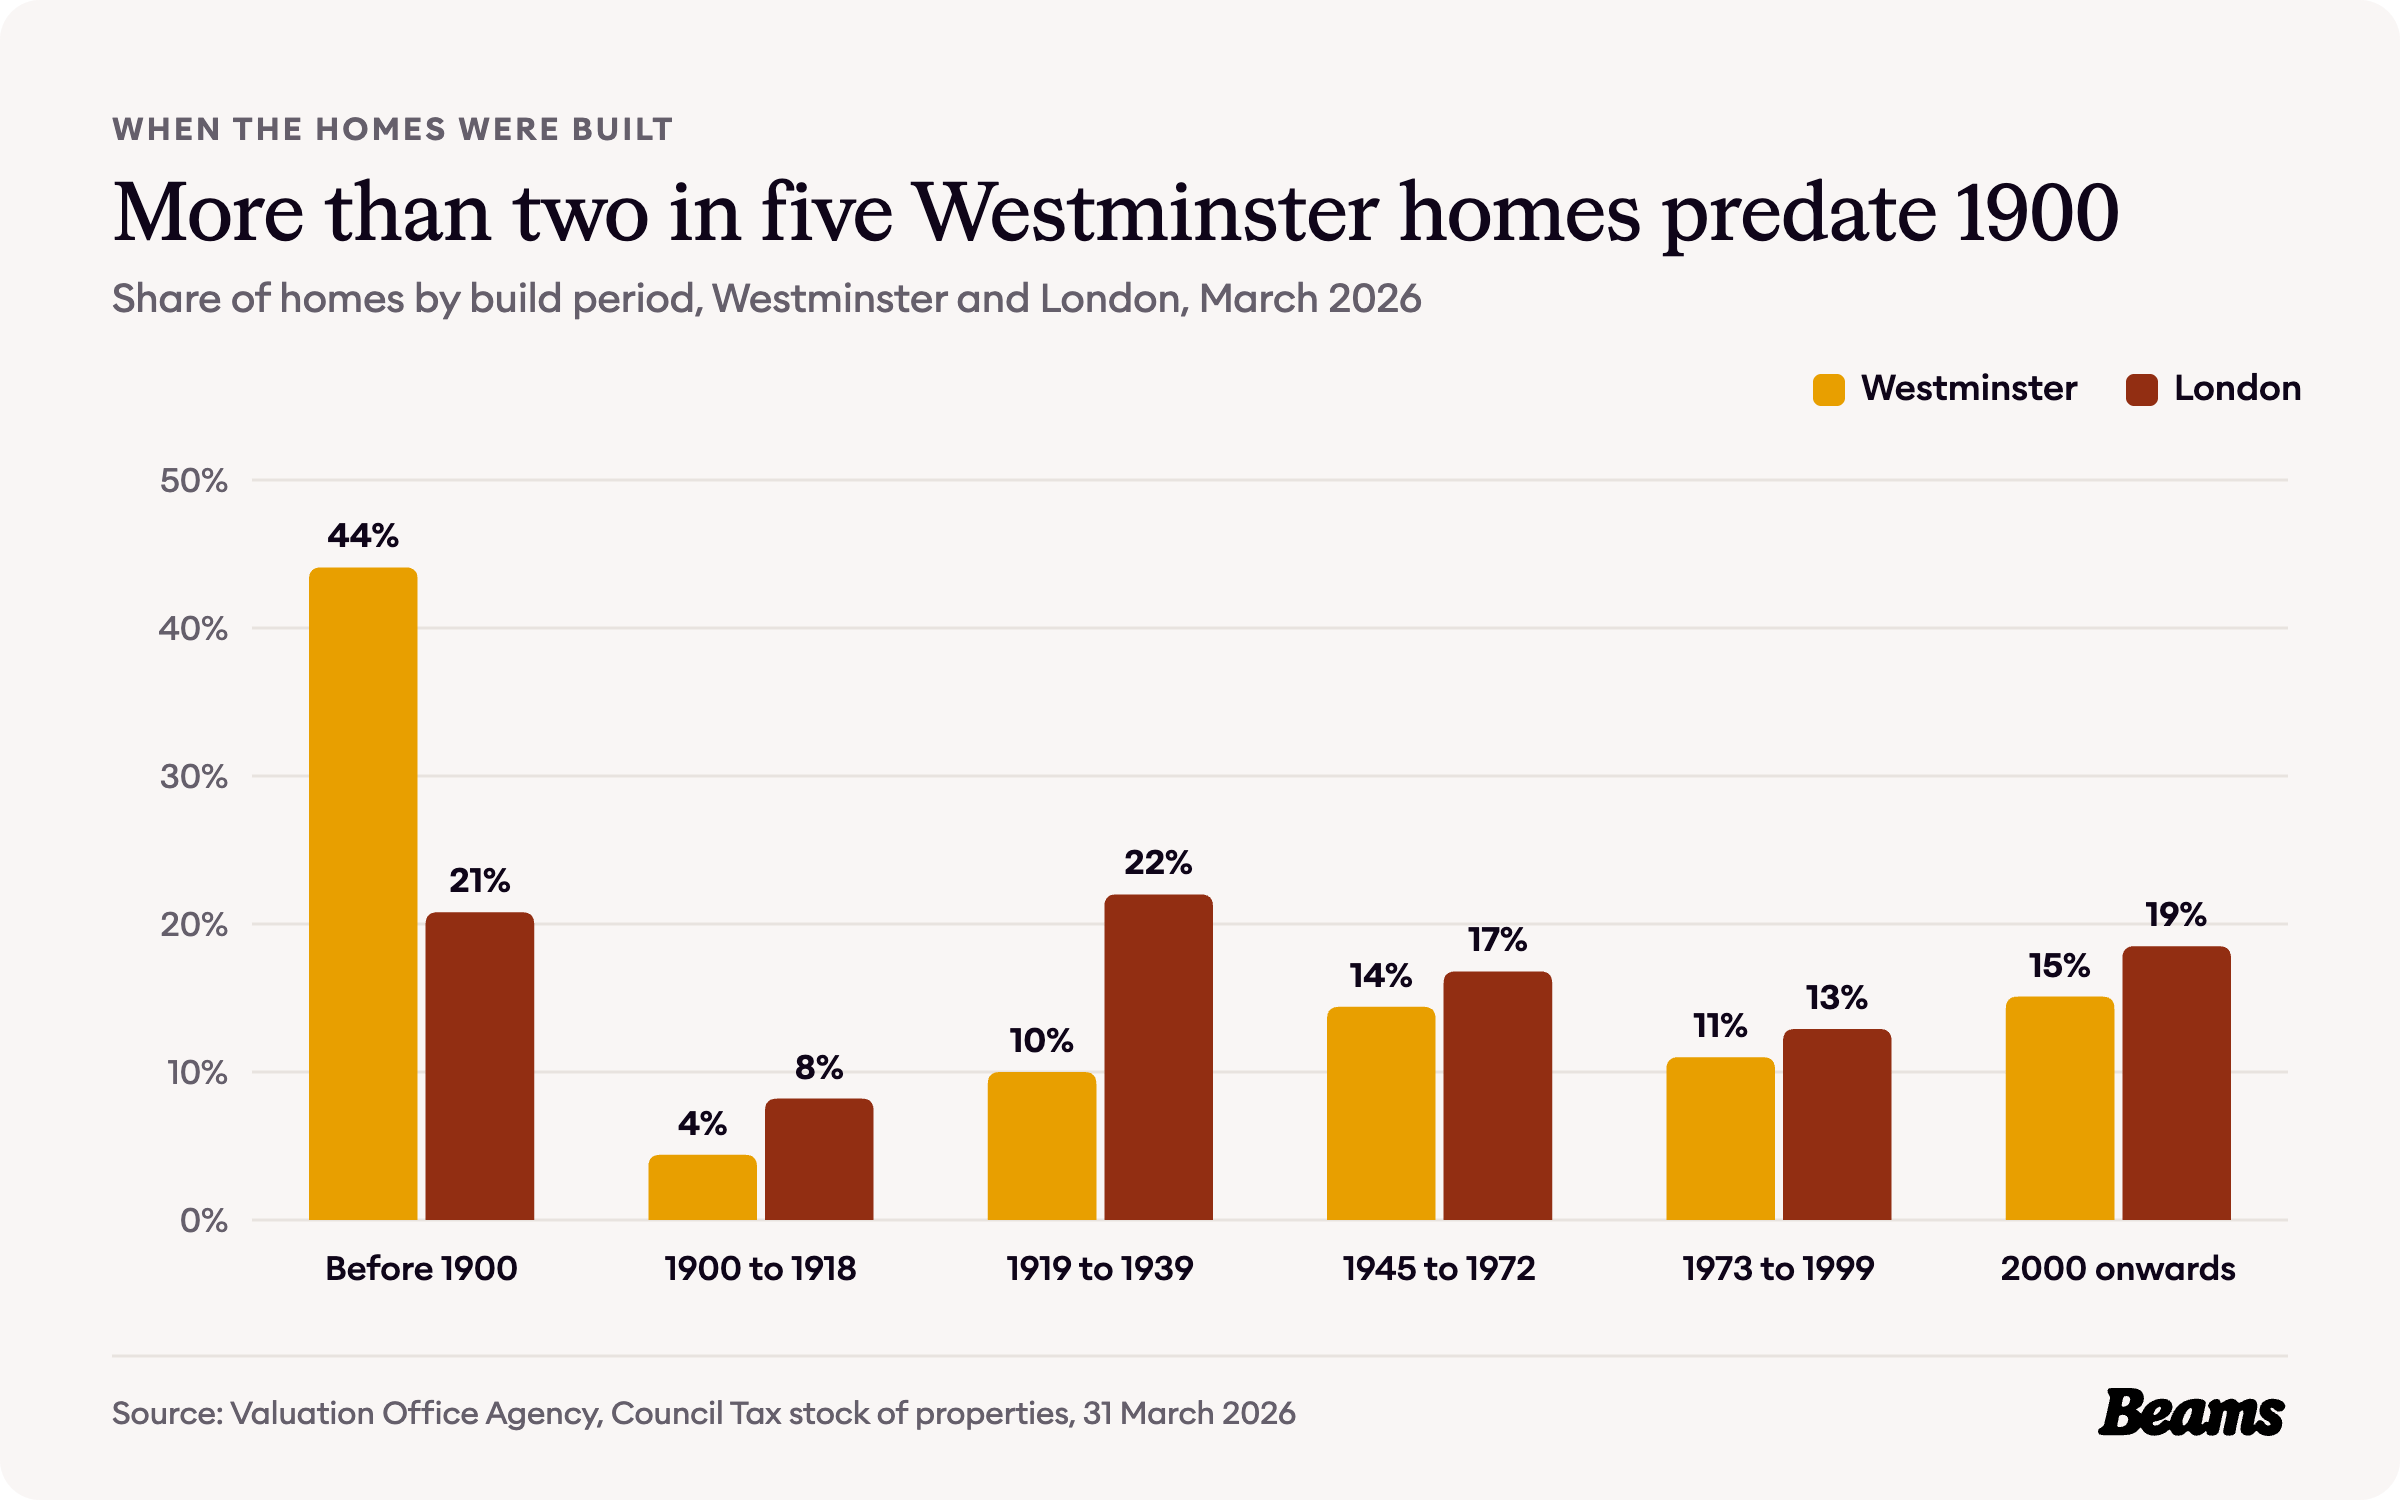
Both layers are still standing. The Valuation Office Agency counts 44.1% of Westminster's 131,940 homes as built before 1900, more than twice London's 20.8%, and 14.4% built between 1945 and 1972 [4]. The interwar years added only 10.0% of today's homes, against 22.0% for London, and 15.1% date from 2000 or later [4].
With more than two in five homes built before 1900, a Westminster renovation often starts with original plasterwork, joinery and proportions, and interior design in Westminster can plan around those features instead of stripping them out.
How Westminster households live
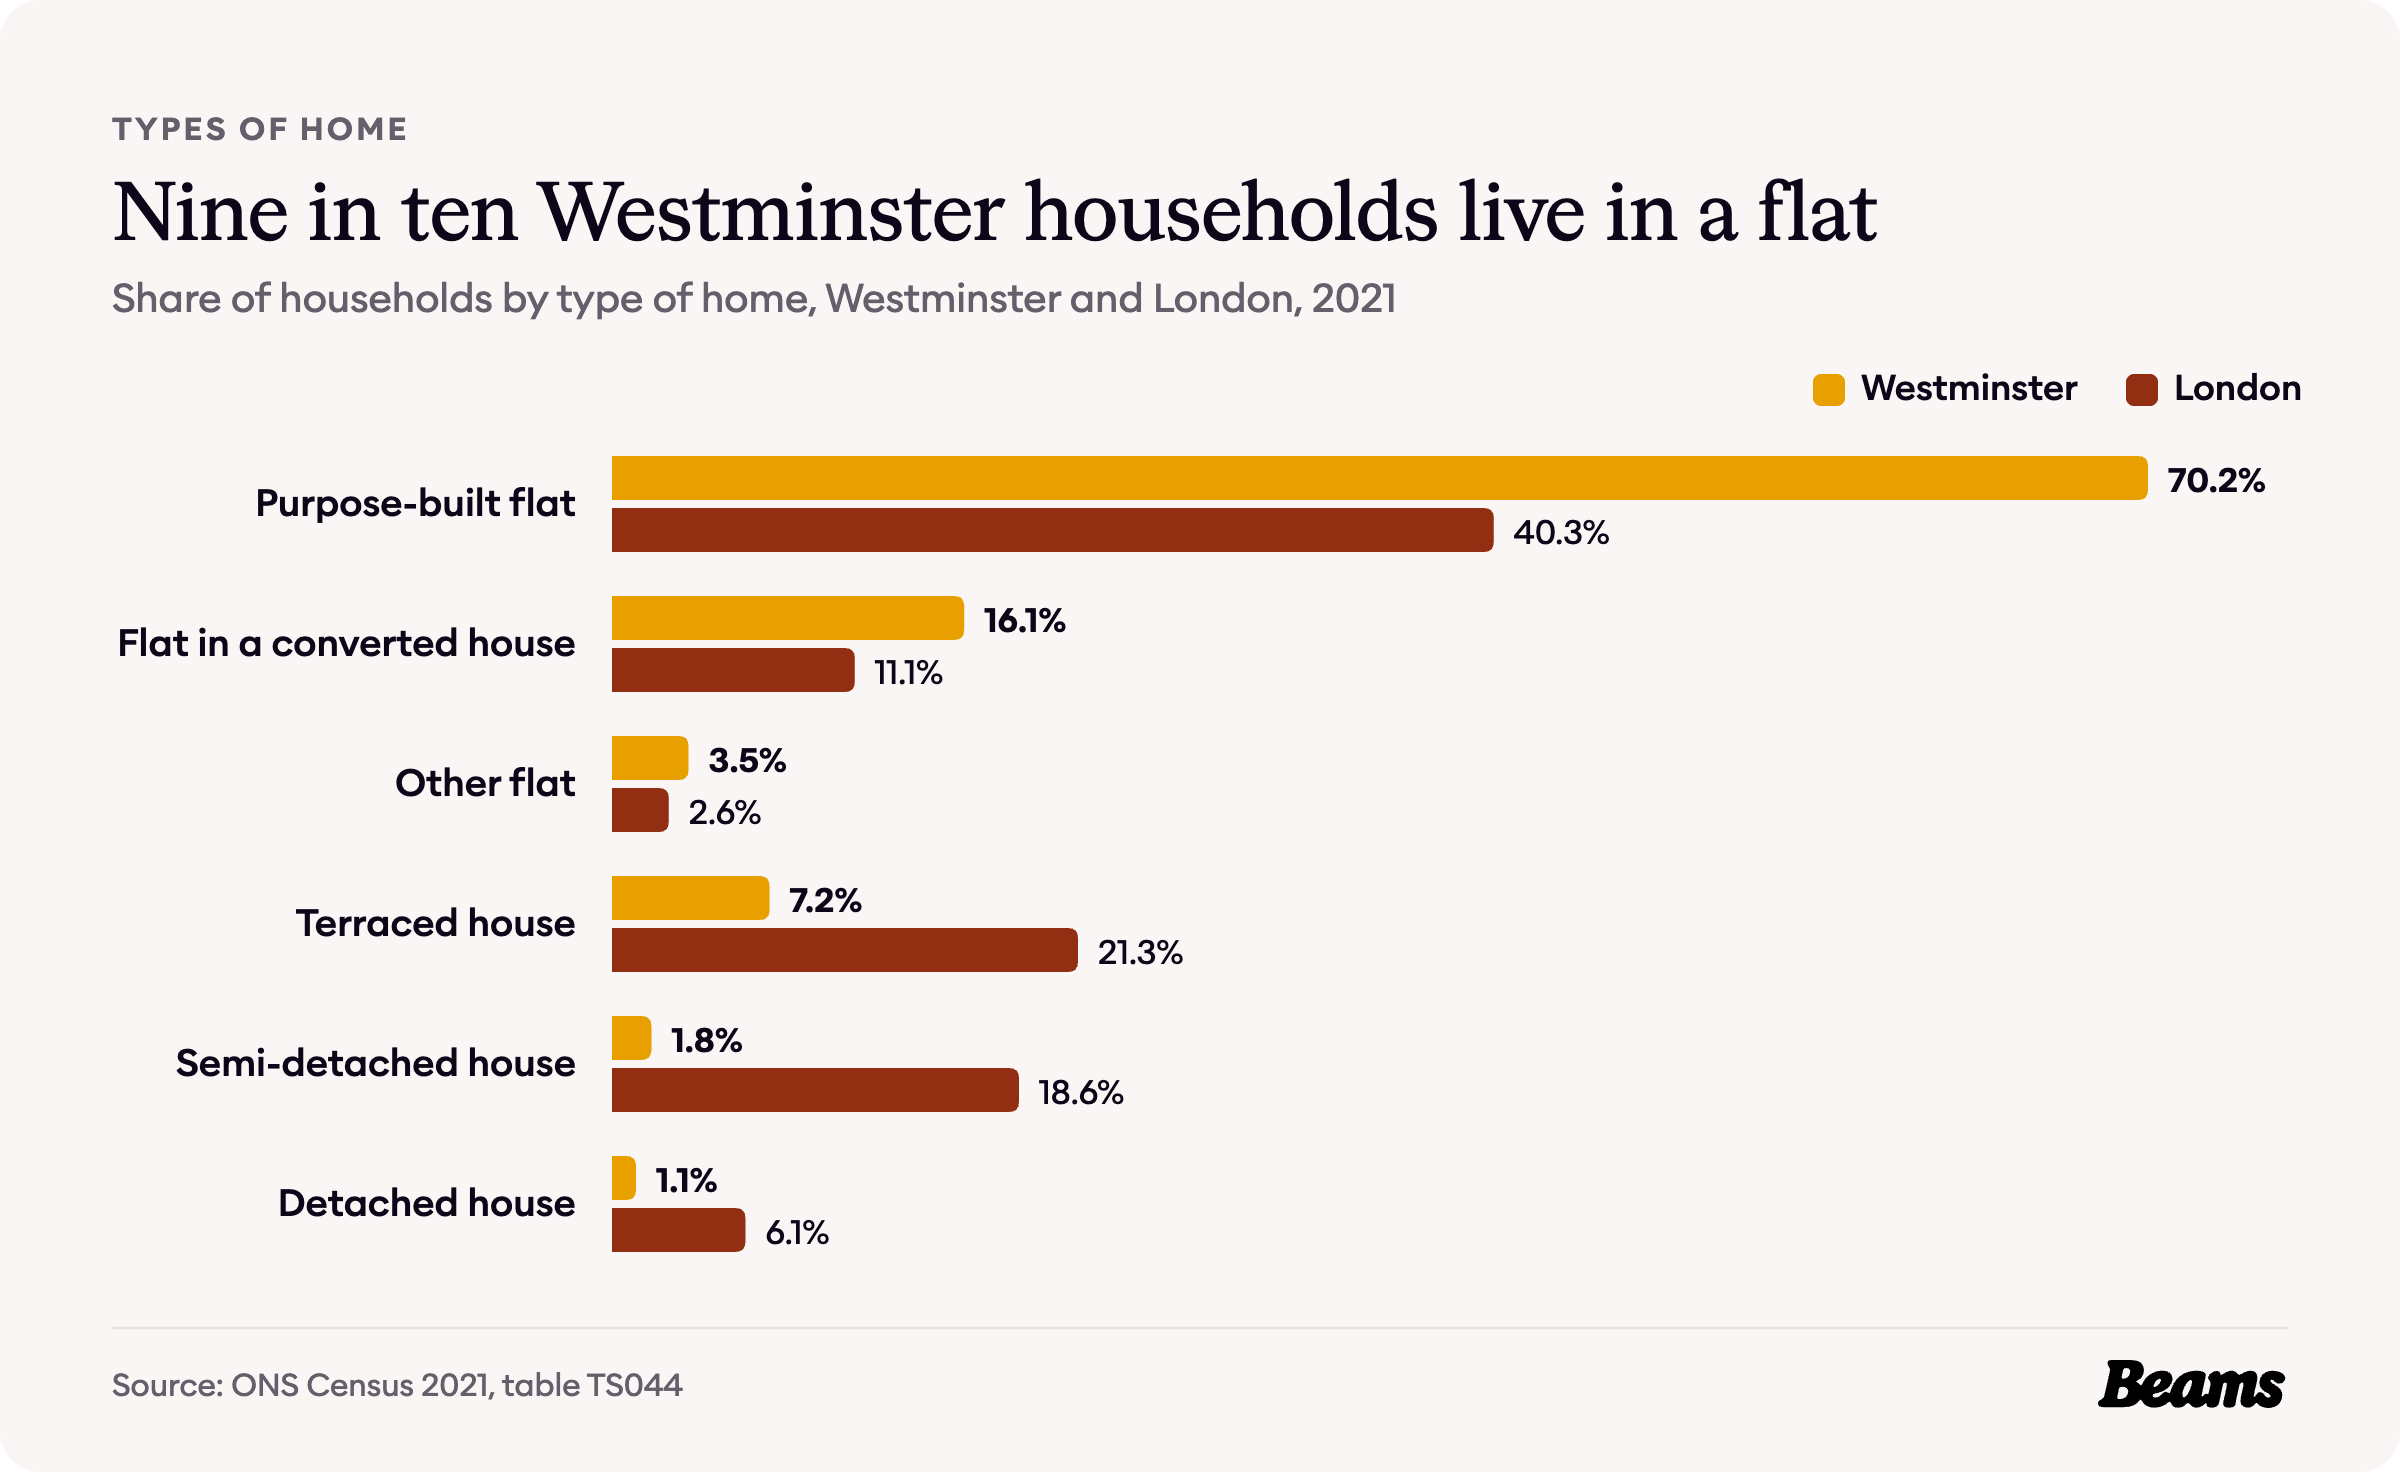
The 2021 Census counted 94,814 households in Westminster. 70.2% of them live in a purpose-built flat, against 40.3% across London, and another 16.1% live in a flat inside a converted house [5].
Count every kind of flat and the figure is 89.8%, against 54.0% for London. Just 10.1% of households live in a house: 7.2% in a terrace, 1.8% in a semi-detached house and 1.1% in a detached one [5].
In a city of flats, most renovation happens inside the existing walls, and a kitchen renovation in Westminster is often about fitting more storage and worktop into the same floor area.
Who owns Westminster's homes
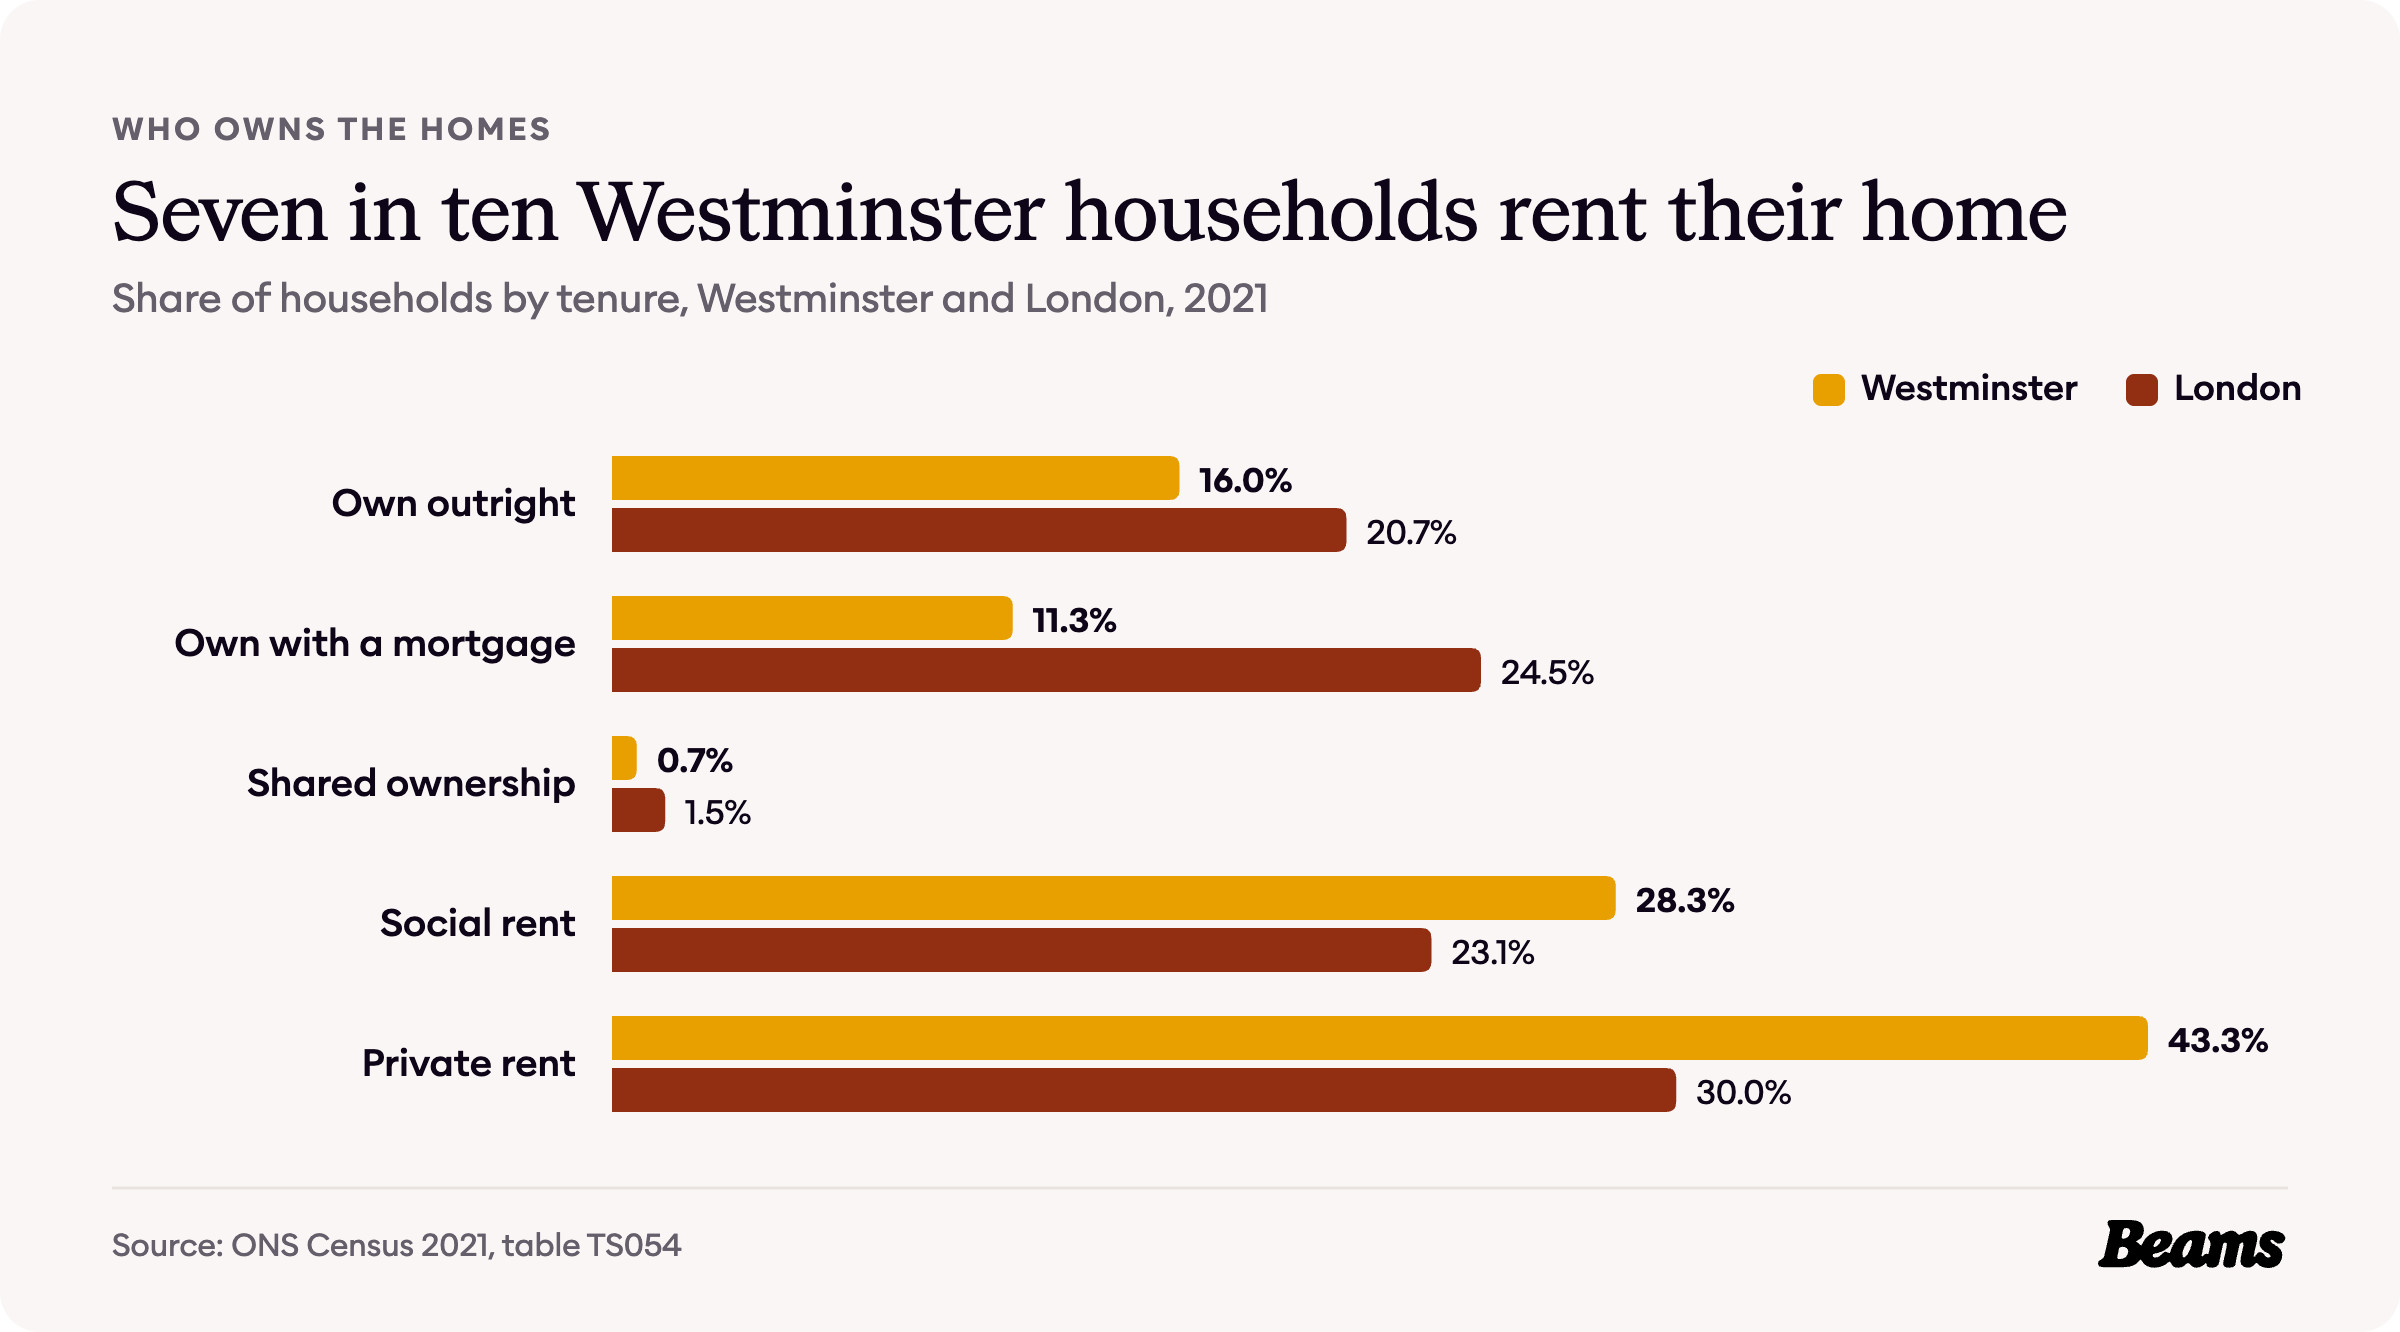
Westminster is a city of renters. Only 27.3% of households own their home, 16.0% outright and 11.3% with a mortgage, against 45.2% across London [6].
Private renting is the largest tenure, at 43.3% of households against 30.0% for London, and a further 28.3% rent from the council or a housing association, against 23.1% [6]. Together that is 71.6% of households renting.
What a Westminster home costs
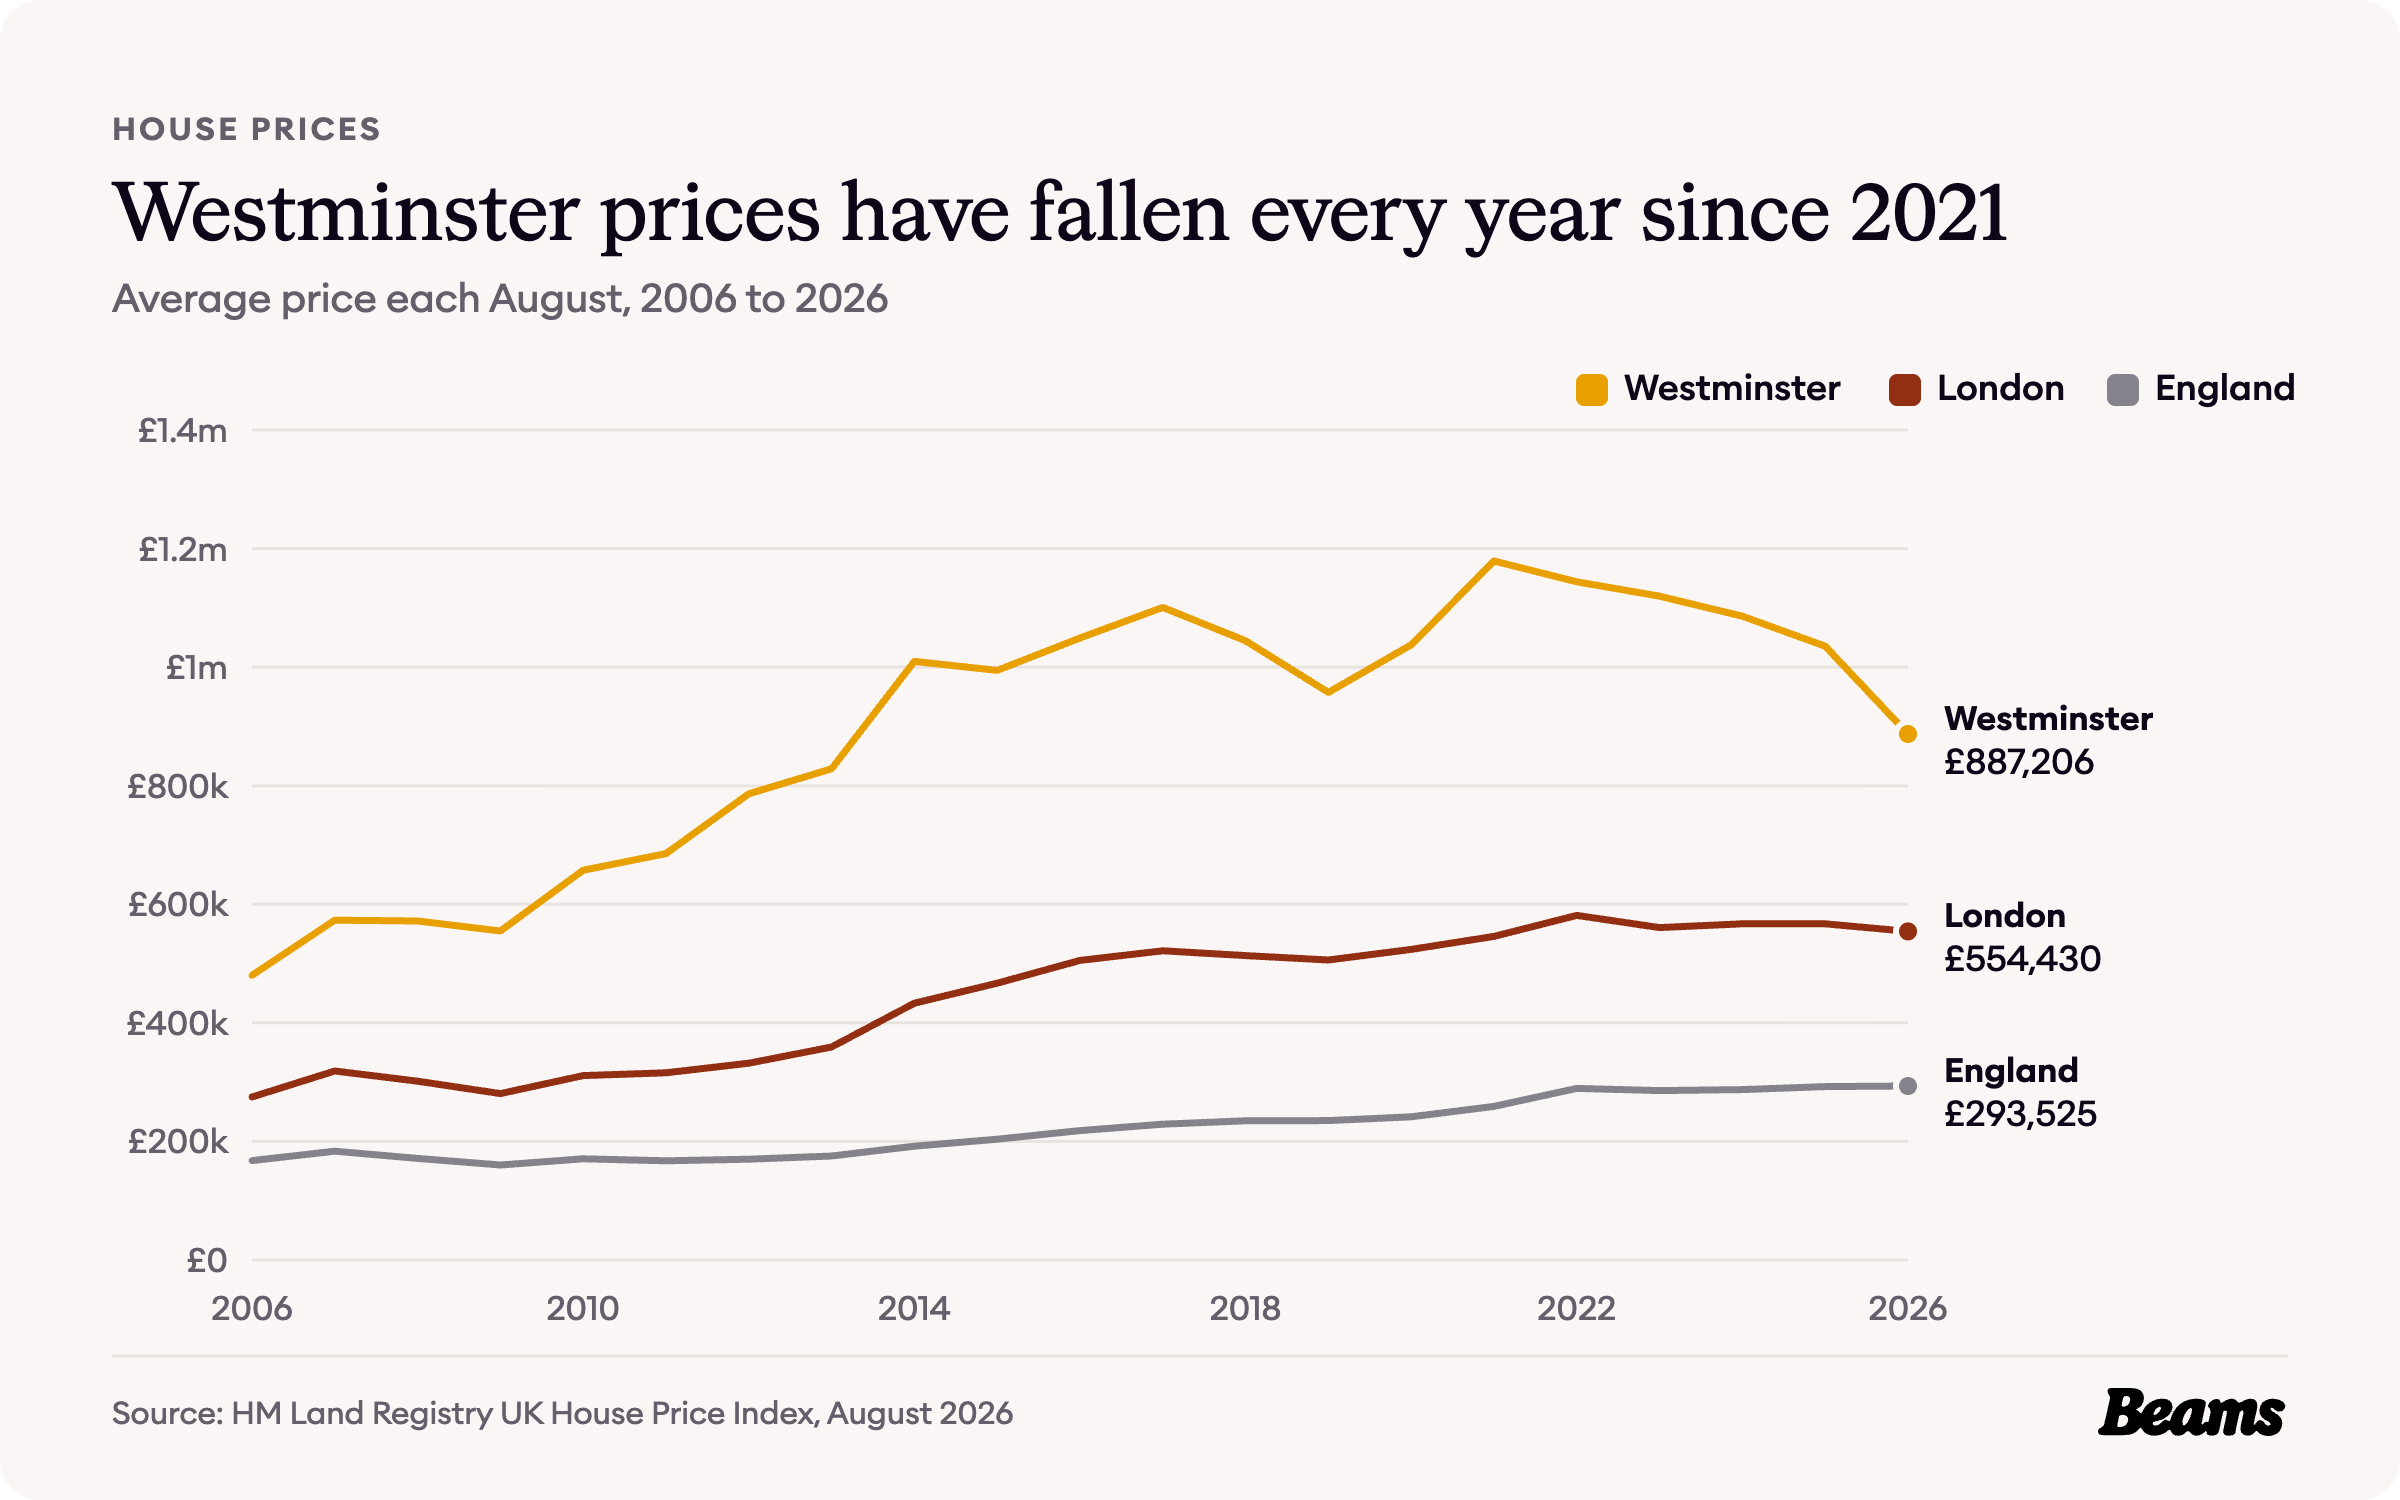
The average Westminster home cost £887,206 in August 2026, 14.3% less than a year earlier [7]. That is 60% above the London average of £554,430, which fell 2.2% over the same year, and about three times the England average of £293,525 [8].
In August 2006 the average was £480,046, already well above London's £274,815. Westminster first passed £1 million in August 2014, at £1,009,601, and peaked at £1,178,953 in August 2021. It has fallen every August since, leaving this year's average about a quarter below that peak but still 1.8 times the 2006 figure [8].
Flats and houses: the price gap
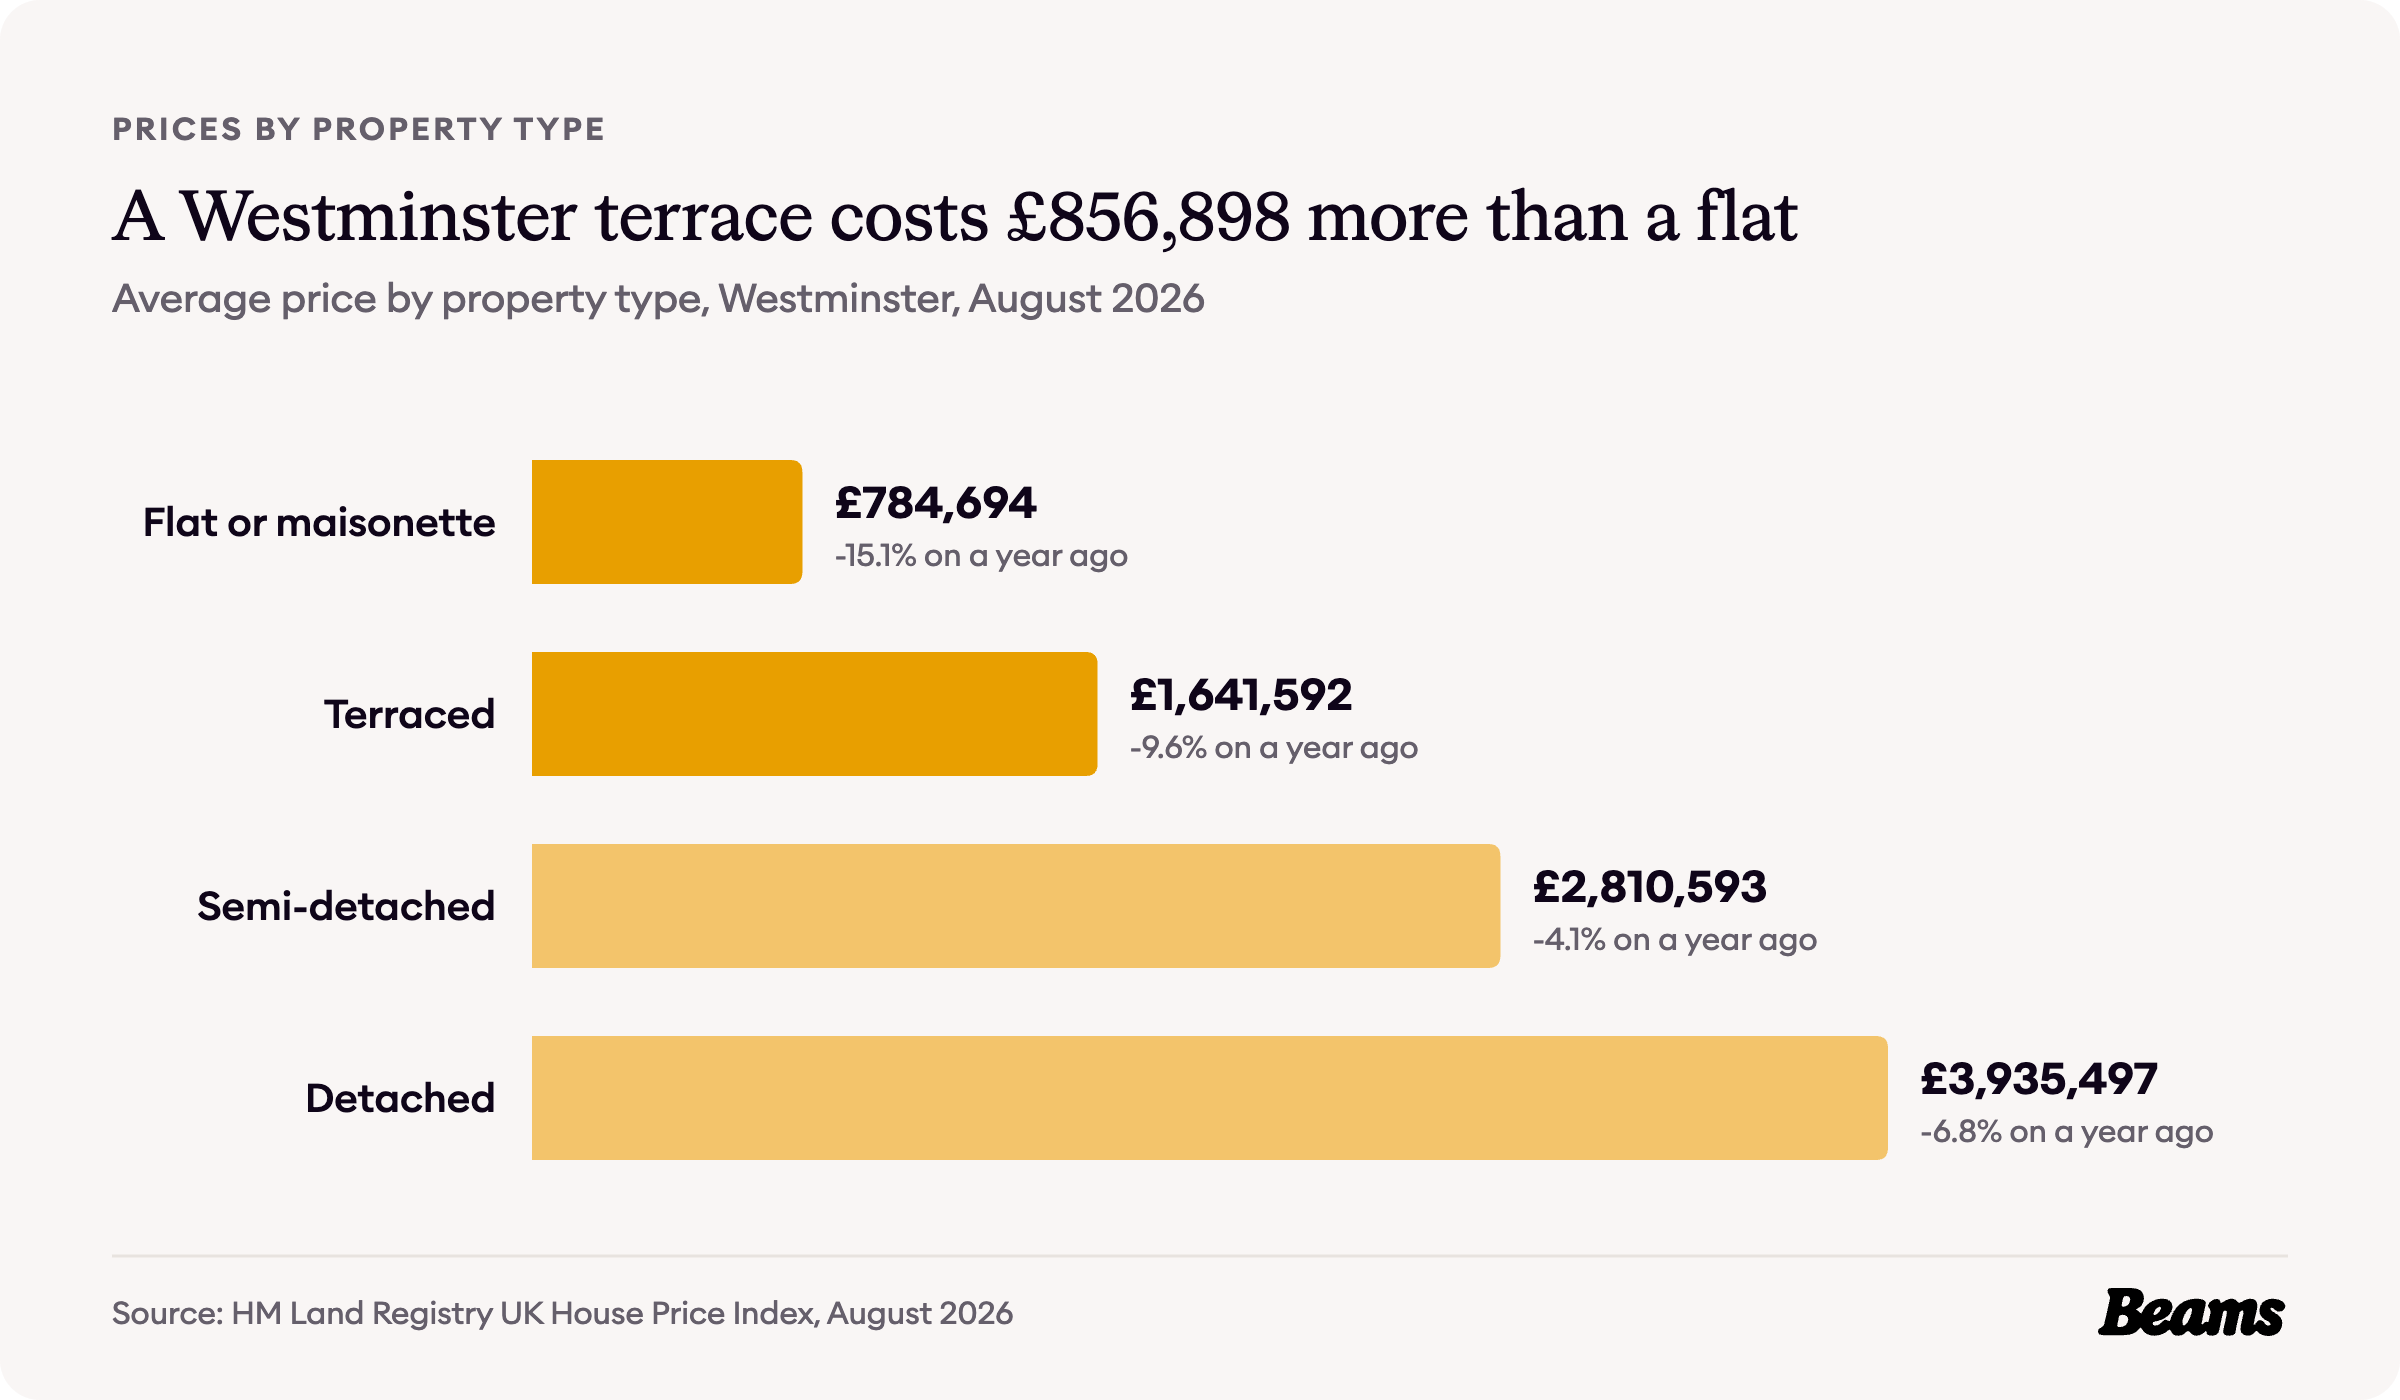
A flat or maisonette averaged £784,694 in August 2026, down 15.1% on a year earlier, and a terraced house £1,641,592, a gap of £856,898 [7]. Semi-detached homes averaged £2,810,593 and detached homes £3,935,497, although only 2.9% of Westminster households live in either [5]. First-time buyers paid an average of £791,770, while owners moving home paid £1,056,470 [7].
For a flat owner who wants a house, that gap is the price of the step up to a terrace. For the one household in ten that already has a house, a house extension in Westminster adds room without paying for the next rung of the ladder.
What it costs to rent in Westminster
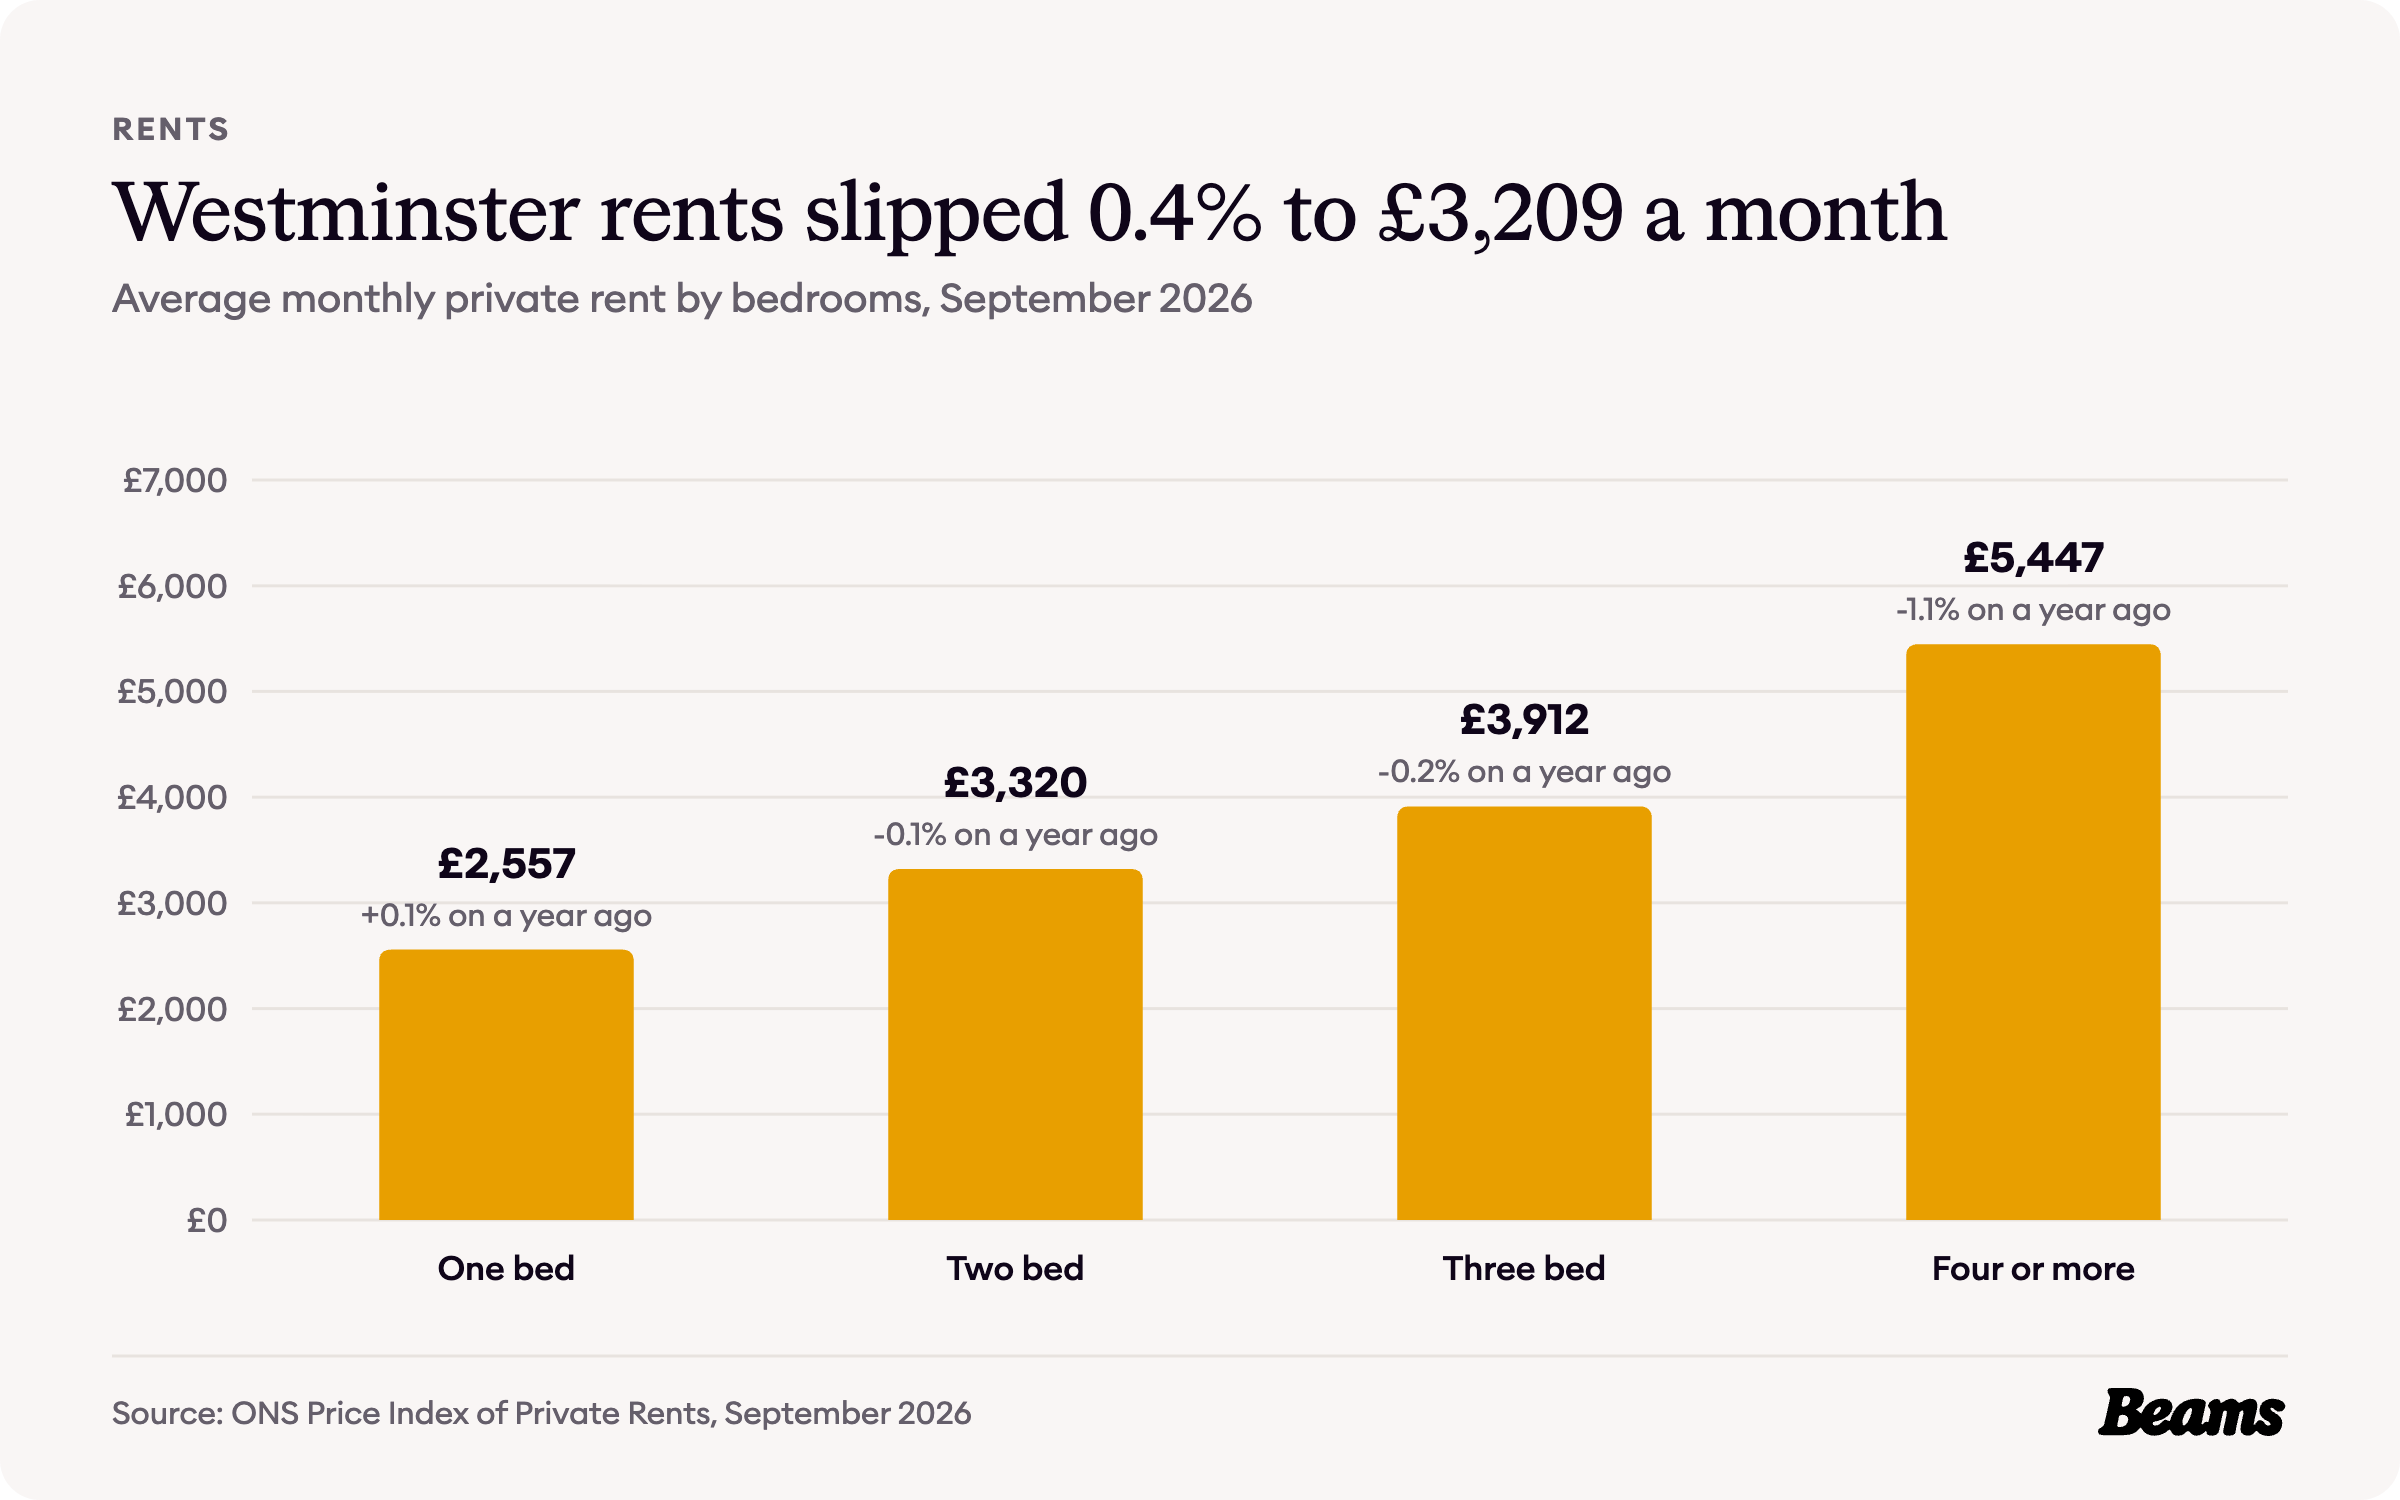
The average private rent in Westminster was £3,209 a month in September 2026, 0.4% lower than a year earlier [7]. A one-bedroom home averaged £2,557 a month, a two-bedroom home £3,320 and a home with four or more bedrooms £5,447 [7].
With 43.3% of households renting privately [6] and rents no longer rising, the condition of a flat counts for more when it is re-let, and a bathroom renovation in Westminster between tenancies is one of the quicker ways to improve it.
Council Tax bands in Westminster
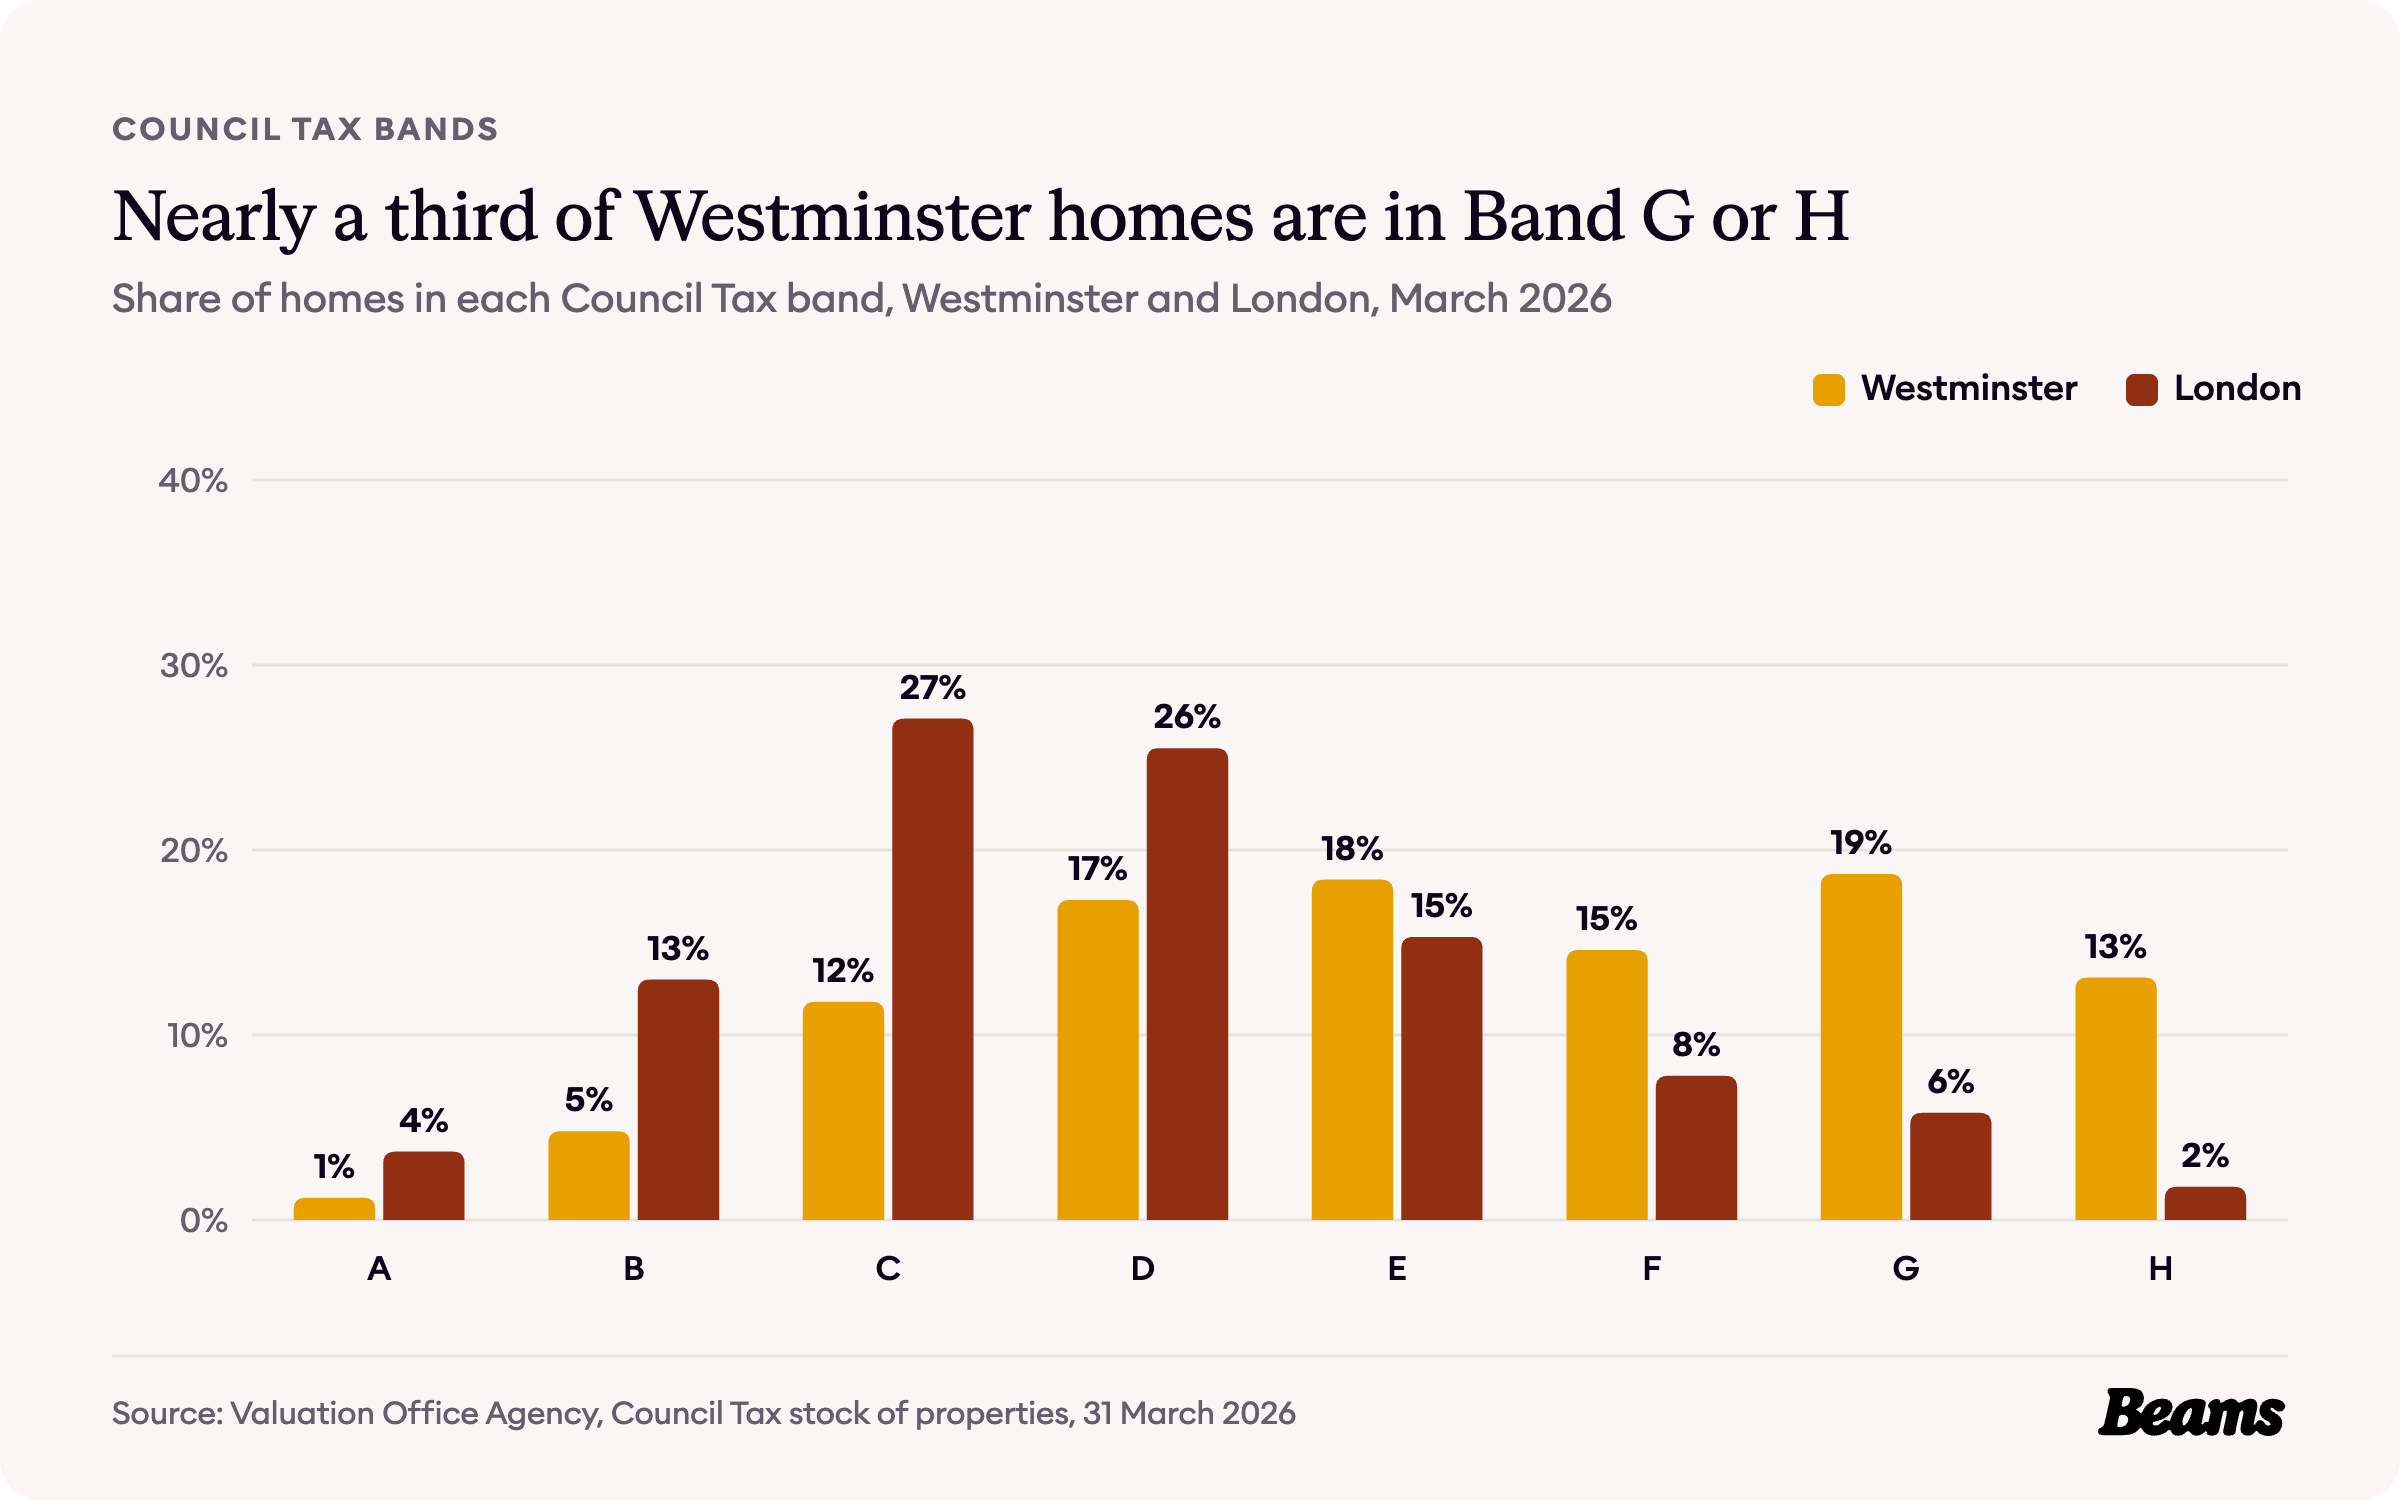
Council Tax bands in England are based on what a home would have sold for on the open market on 1 April 1991 [9], so they are a rough guide to the size and value of the housing.
13.1% of Westminster homes are in Band H, the top band, against 1.8% across London, and another 18.7% are in Band G. That puts 31.8% in the top two bands, more than four times London's 7.6%. Only 17.8% are in Bands A to C, against 43.8% for London [4].
The rules on your street
Westminster has 56 conservation areas, designated by the council for their special architectural and historic interest [10]. Inside them you need planning permission for demolition and for some alterations or extensions that would not need it elsewhere, and you must give the council six weeks' notice before pruning or felling a tree [10].
Article 4 directions add to that. One, in force since 31 July 2016, removes permitted development rights for basement development throughout the city, so a basement conversion in Westminster needs planning permission wherever the home is. Others remove permitted development rights for certain minor alterations in eight conservation areas, at places such as Abbey Gardens in NW8, Queen's Park Estate in W10 and Sussex Gardens in W2 [11].
On timing, the council says decisions on householder and non-major applications are usually made within 8 weeks, and major applications may take 13 weeks or longer. It aims to decide within the statutory period but says this is not always possible, and most applications must be decided by officers under the government's National Scheme of Delegation [12]. Check your address on the council's conservation area and Article 4 maps before you ask builders in Westminster to price the work.
Westminster housing statistics at a glance
- Average house price, August 2026: £887,206 (London £554,430) [7] [8]
- Change on a year earlier: -14.3% (London -2.2%) [7] [8]
- Average flat or maisonette: £784,694 (London £427,310) [7] [8]
- Average terraced house: £1,641,592 (London £648,650) [7] [8]
- Average private rent, September 2026: £3,209 a month [7]
- Homes built before 1900: 44.1% (London 20.8%) [4]
- Households living in a flat: 89.8% (London 54.0%) [5]
- Households who own their home: 27.3% (London 45.2%) [6]
- Homes in Council Tax Band G or H: 31.8% (London 7.6%) [4]
- Conservation areas: 56 [10]
Frequently asked questions
References
- British History Online, The Development of the Estate 1720 to 1785: Introduction. Survey of London, volume 39, the Grosvenor Estate in Mayfair.
- British History Online, The Development of the Estate 1720 to 1785: Conclusion. Survey of London, volume 39, the Grosvenor Estate in Mayfair.
- Historic England, Landscape to Churchill Gardens Estate. National Heritage List for England, list entry 1469043.
- Valuation Office Agency, Council Tax: stock of properties 2026. Table CTSOP4.1, properties by build period and Council Tax band at 31 March 2026, Westminster and London.
- ONS, Census 2021 table TS044: Accommodation type. Households by type of home, Westminster and London.
- ONS, Census 2021 table TS054: Tenure. Households by tenure, Westminster and London.
- ONS, Housing prices in Westminster. UK House Price Index for August 2026 and Price Index of Private Rents for September 2026, updated 21 October 2026.
- HM Land Registry, UK House Price Index. Average prices for Westminster, London and England, August 2006 to August 2026.
- GOV.UK, How domestic properties are assessed for Council Tax bands. Accessed 29 October 2026.
- Westminster City Council, Conservation areas. Accessed 29 October 2026.
- Westminster City Council, Article 4 Directions in Westminster. Accessed 29 October 2026.
- Westminster City Council, When you will get a decision. Accessed 29 October 2026.
Thinking of improving rather than moving?
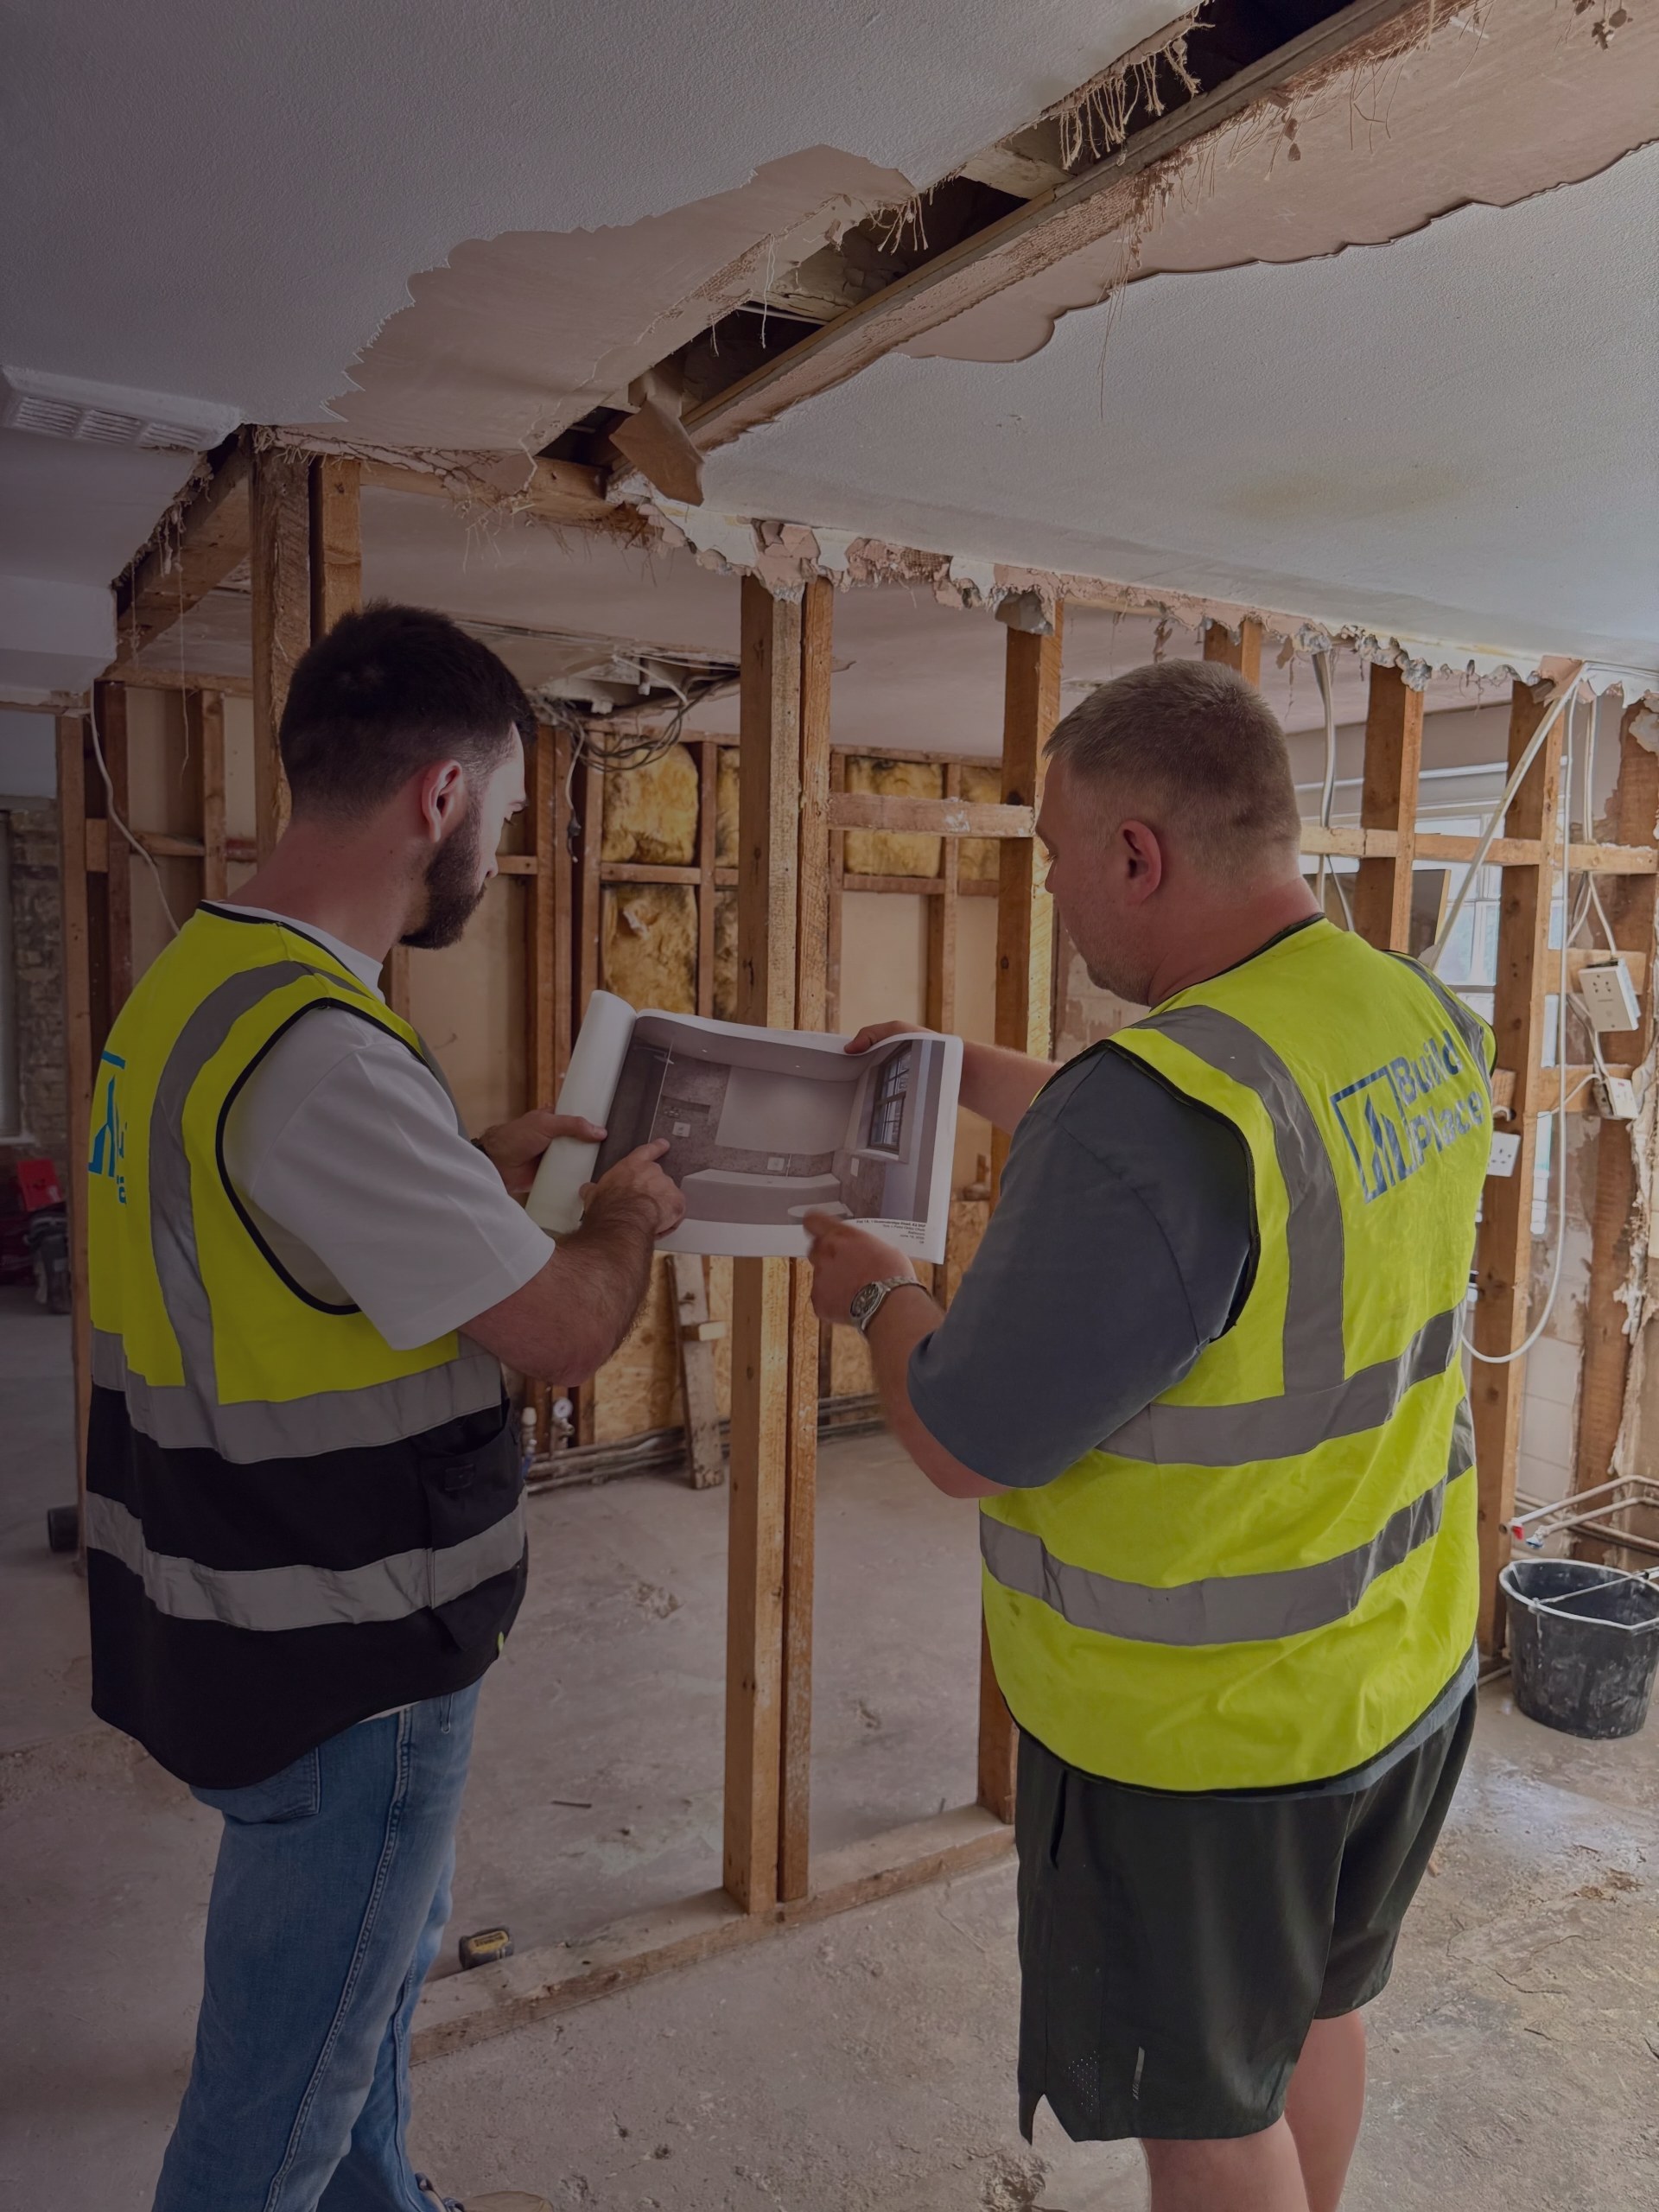
Tell us about your Westminster home and what you want to change. We'll give you a free estimate, then up to three vetted builders quote against the same specification.