

Redbridge housing statistics 2026
House prices, rents, home types and planning rules in Redbridge, with every figure from an official source.
Redbridge grew around Ilford, which went from 10,913 people in 1891 to 78,188 in 1911. Today 26.7% of its homes date from before 1919, households are spread across terraces, semis and flats, and the average home cost £484,378 in August 2026, 2.8% less than a year earlier.
Every figure comes from an official source and is dated, so you can see exactly what you are working with before you plan a home renovation in Redbridge. The sources are numbered in brackets and listed in full at the end of the page.
When Redbridge's homes were built
Ilford's growth came suddenly. The town had 1,959 inhabited houses in 1891, 7,649 in 1901 and 15,832 in 1911, and its population rose by 277.6% in the 1890s alone [1].
Woodford grew more slowly, from 11,024 people in 1891 to 18,496 in 1911 [1]. Much of the building in Ilford was done by Cameron Corbett, who developed several large housing estates, among them the Grange estate, and north Ilford did not expand rapidly until the 1930s [2].
The Valuation Office Agency figures show both phases. Of Redbridge's 108,740 homes, 18.3% were built between 1900 and 1918, more than twice London's 8.2%, and 34.1% between the wars, against 22.0% for London [3]. Those Edwardian and interwar houses are a common starting point for a loft conversion.
How Redbridge households live
The 2021 Census found Redbridge households spread across three types of home: 32.3% in a terraced house, 27.0% in a semi-detached house and 25.4% in a purpose-built flat [4].
66.3% live in a house of some kind, against 46.0% for London, and 7.0% in a detached house [4]. With so many households in houses, a kitchen renovation here is often part of a bigger plan for the ground floor.
Who owns Redbridge's homes
57.1% of Redbridge households own their home, 27.0% outright and 30.1% with a mortgage, against 45.2% across London [5].
Private renting is as common here as across London, at 30.4% of households against 30.0%, but only 11.3% rent from a social landlord, about half London's 23.1% [5].
What a Redbridge home costs
The average Redbridge home cost £484,378 in August 2026, 2.8% less than a year earlier [6]. That is about 13% below the London average of £554,430, where prices fell by 2.2%, and about 65% above the England average of £293,525 [7].
Prices peaked at £498,404 in August 2025, after rising 4.6% that year. In August 2006 the average home here cost £238,551, so prices have roughly doubled. The biggest rises came in 2014, 2015 and 2016, at 10.8%, 13.0% and 13.6%, and the biggest fall in 2009, at 11.1% [7].
Flats, terraces and the gap between them
A flat or maisonette in Redbridge averaged £301,680 in August 2026 and a terraced house £539,955, a gap of £238,275. Semi-detached homes averaged £687,150 and detached homes £1,100,507 [6].
Every type fell over the year, flats most of all at 5.5%, while terraces and semis each fell 1.5% [6]. Flats here cost about £125,600 less than the London average of £427,310, and terraces about £108,700 less than London's £648,650 [7].
With £147,195 between a terrace and a semi, a house extension is the obvious cost to compare before moving.
What it costs to rent in Redbridge
The average private rent in Redbridge was £1,734 a month in September 2026, up 2.1% on a year earlier [6]. A one-bedroom home averaged £1,373 a month and a home with four or more bedrooms £2,724.
With 30.4% of households renting privately, a dated bathroom is often the first thing a bathroom renovation puts right between tenancies.
Council Tax bands in Redbridge
Council Tax bands are based on what a home would have sold for on the open market on 1 April 1991 [8]. In Redbridge, Band D is the largest, with 29.8% of homes against 25.5% for London, and Bands C and D together hold 55.7% [3].
15.7% of Redbridge homes are in Bands A and B, against 16.7% for London, and 3.3% are in Bands G and H, against 7.6% [3].
The rules on your street
Redbridge has 16 conservation areas, according to the council, including Wanstead Village, Woodford Green and Woodford Wells, Snaresbrook and the Bungalow Estate [9].
The council lists 11 Article 4 directions. Two cover whole conservation areas, the Bungalow Estate (2017) and Aldersbrook and Lake House (2020), and one covers small houses in multiple occupation across the borough [9]. The council says an Article 4 direction can mean you need planning permission for changes such as new porches, replacement windows and doors, replacement roof coverings and exterior painting [9]. A basement conversion or any change to the front of a house in those areas starts with a check of the address.
Councils in England have 8 weeks to decide most planning applications and 13 weeks for major development [10]. Check your street before anyone starts drawing, then plan a home renovation in Redbridge with up to three vetted builders quoting against the same plans.
Redbridge housing statistics at a glance
- Average house price, August 2026: £484,378 (London £554,430) [6] [7]
- Change on a year earlier: -2.8% (London -2.2%) [6] [7]
- Average flat or maisonette: £301,680 (London £427,310) [6] [7]
- Average terraced house: £539,955 (London £648,650) [6] [7]
- Average private rent, September 2026: £1,734 a month [6]
- Homes built between 1900 and 1918: 18.3% (London 8.2%) [3]
- Households living in a house: 66.3% (London 46.0%) [4]
- Households who own their home: 57.1% (London 45.2%) [5]
- Households renting privately: 30.4% (London 30.0%) [5]
- Conservation areas: 16, with 11 Article 4 directions in the borough [9]
Frequently asked questions
References
- British History Online, Metropolitan Essex since 1850: Population growth and the built-up area. Victoria County History of Essex, volume 5.
- British History Online, The ancient parish of Barking: Introduction. Victoria County History of Essex, volume 5.
- Valuation Office Agency, Council Tax: stock of properties 2026. Table CTSOP4.1, properties by build period and Council Tax band at 31 March 2026.
- ONS, Census 2021 table TS044: Accommodation type. Households by type of home, Redbridge and London.
- ONS, Census 2021 table TS054: Tenure. Households by tenure, Redbridge and London.
- ONS, Housing prices in Redbridge. UK House Price Index for August 2026 and Price Index of Private Rents for September 2026, published 21 October 2026.
- HM Land Registry, UK House Price Index. Average prices for Redbridge, London and England, August 2006 to August 2026.
- GOV.UK, How domestic properties are assessed for Council Tax bands. Accessed 29 October 2026.
- Redbridge Council, Protected buildings and conservation areas. Accessed 6 November 2026.
- GOV.UK, Determining a planning application. Accessed 6 November 2026.
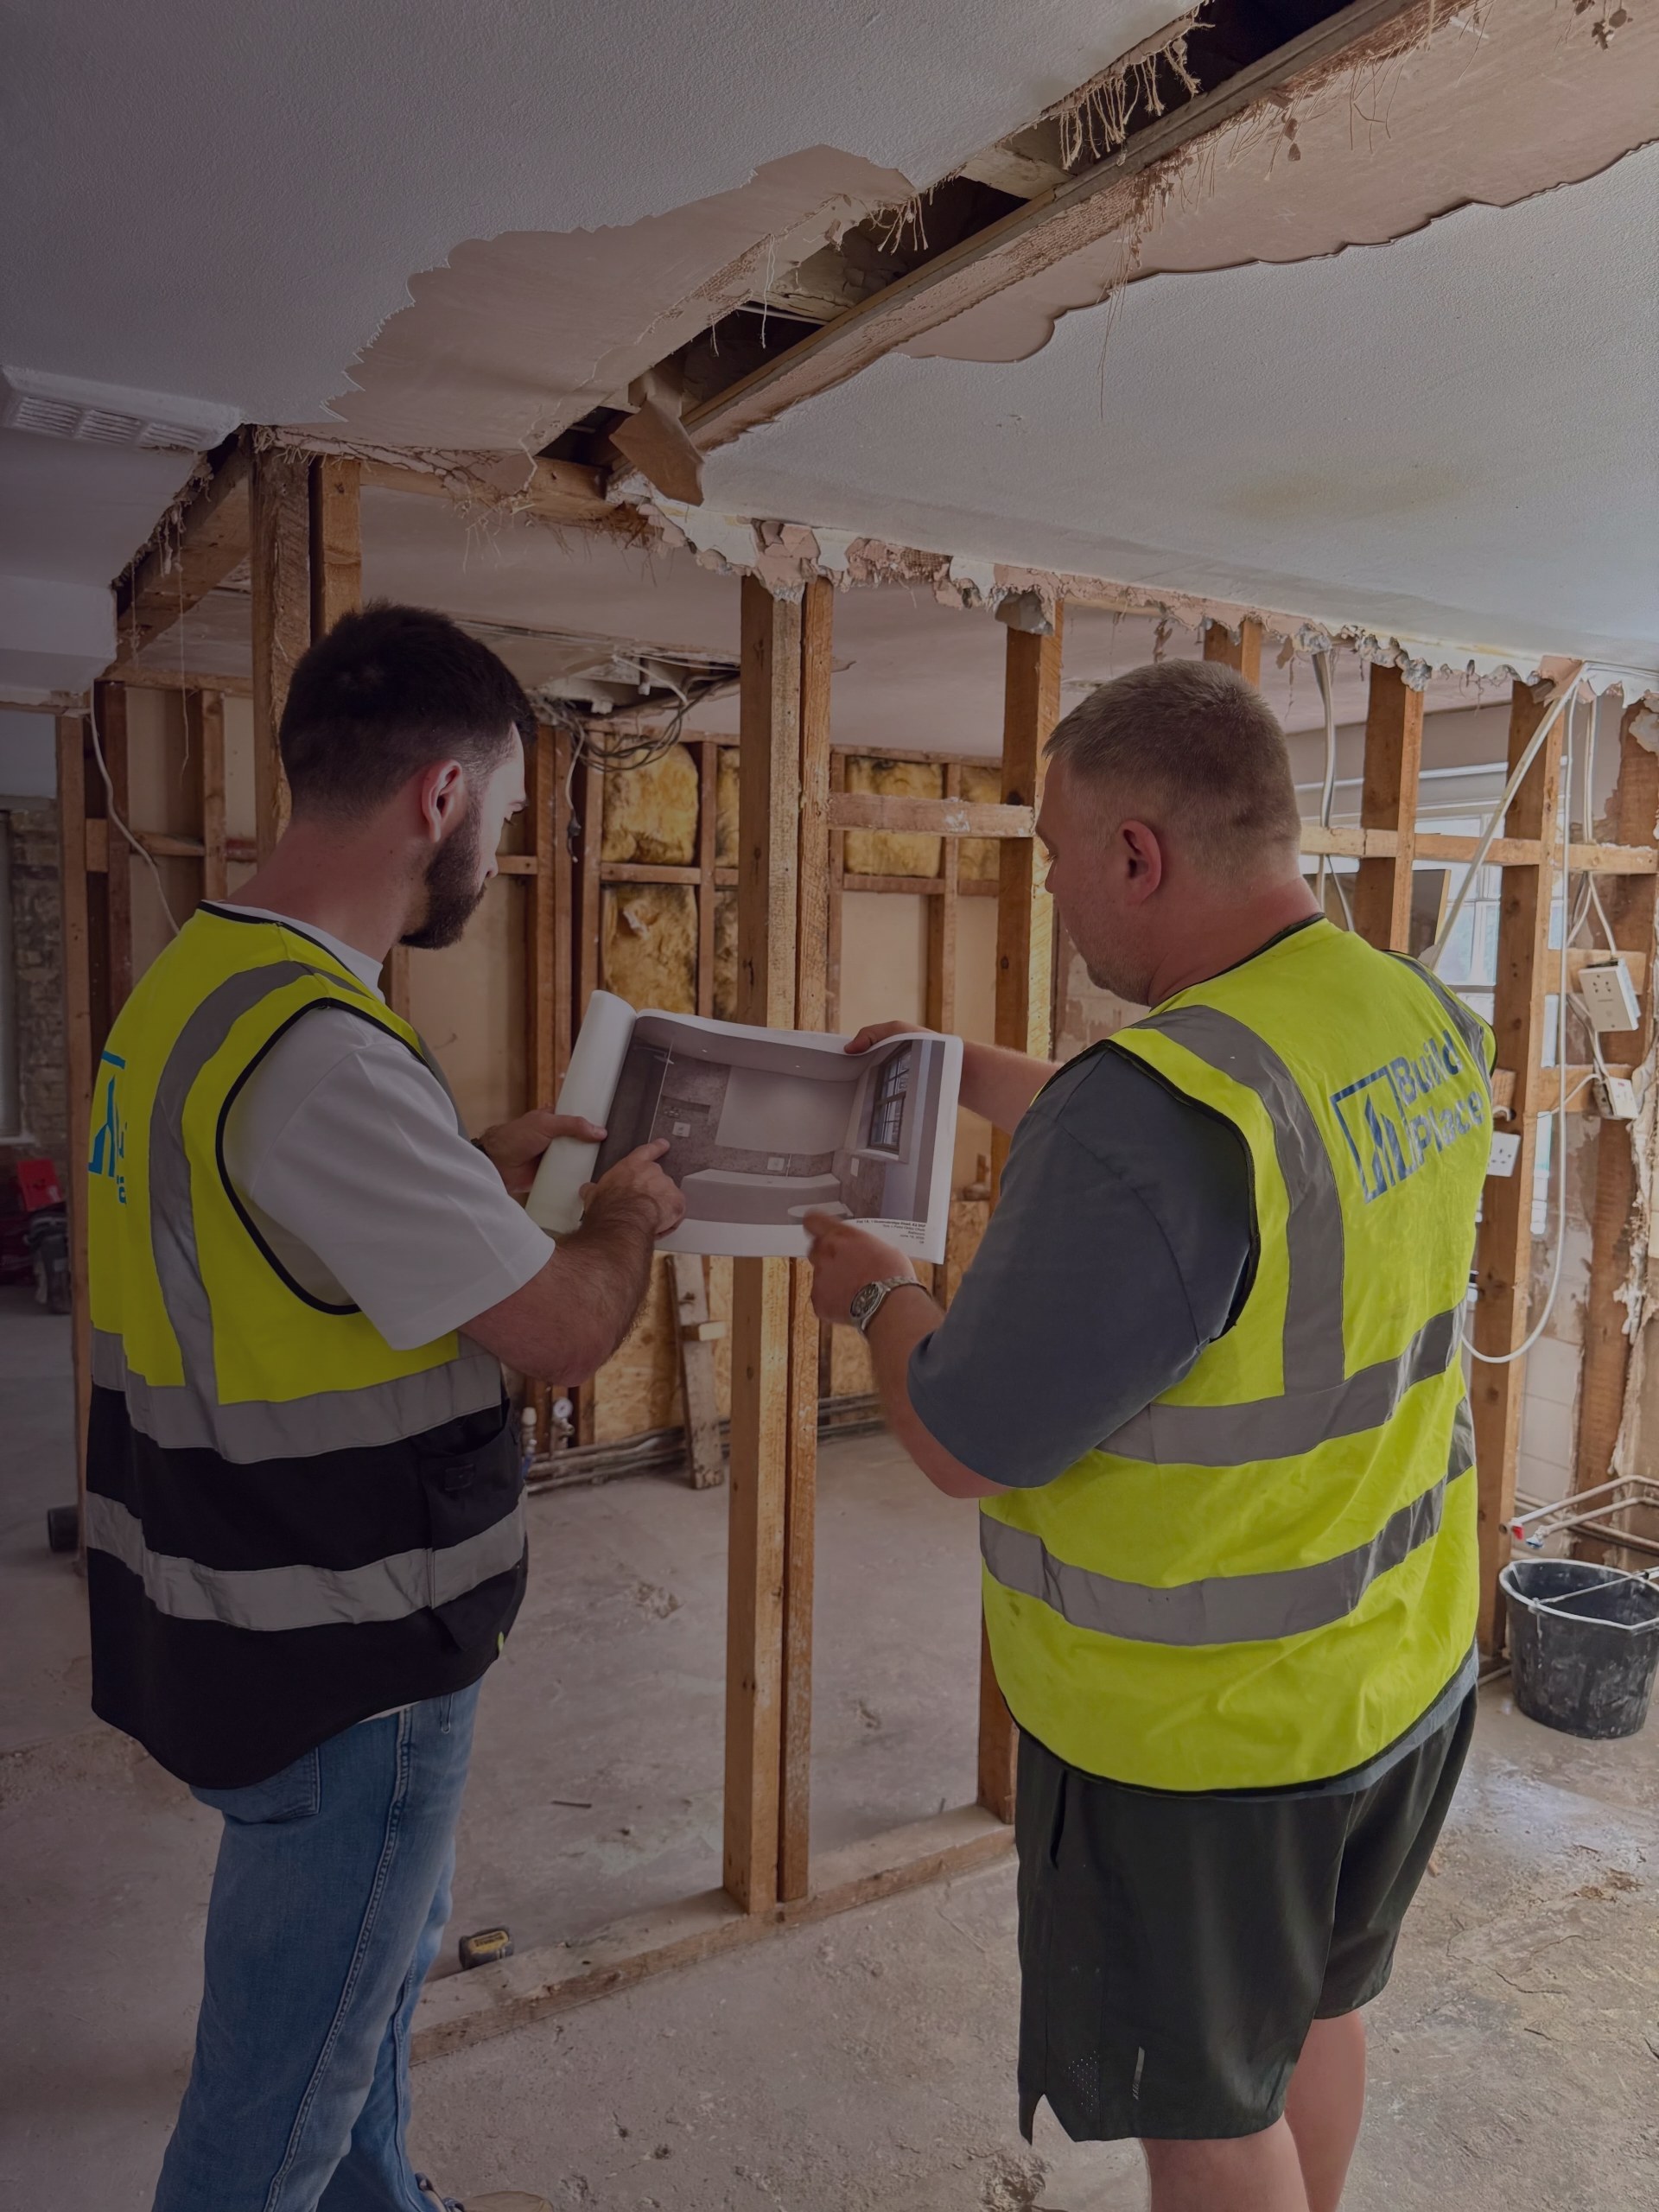
Thinking of improving rather than moving?
Tell us about your Redbridge home and what you want to change. We'll give you a free estimate, then up to three vetted builders quote against the same specification.