
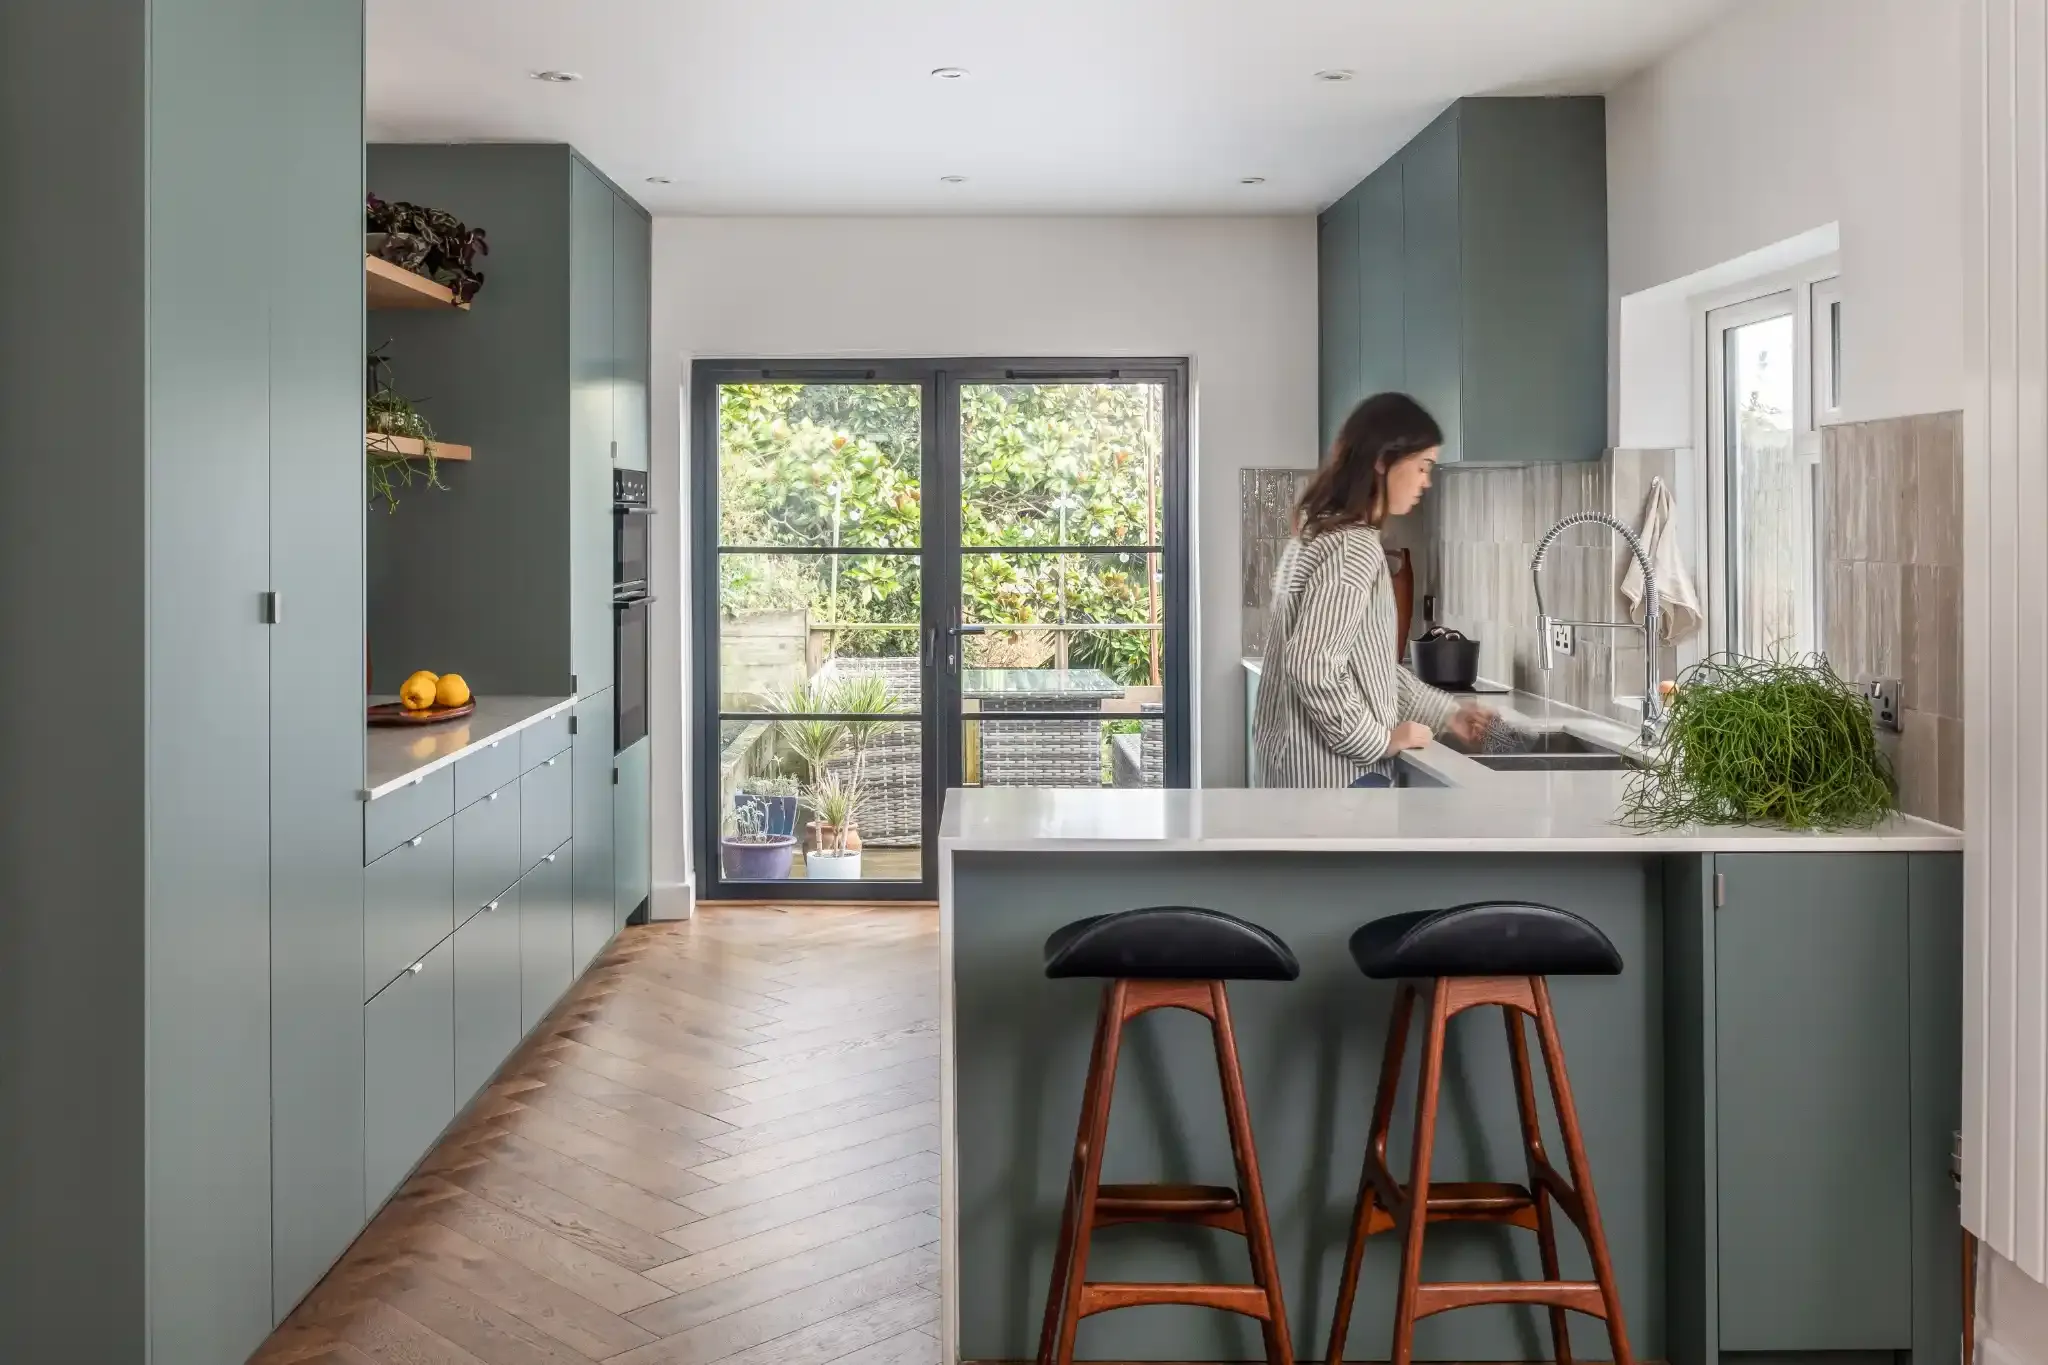
Hillingdon housing statistics 2026
House prices, rents, home types and planning rules in Hillingdon, with every figure from an official source.
Most of Hillingdon was villages and farmland until the Metropolitan Railway and the builders of the 1930s arrived. Today more than a third of its homes date from between the wars, 35.1% of households live in a semi-detached house, and the average home cost £482,137 in August 2026, unchanged on a year earlier while London prices fell by 2.2%.
Every figure comes from an official source and is dated, so you can see exactly what you are working with before you plan a home renovation in Hillingdon. The sources are numbered in brackets and listed in full at the end of the page.
When Hillingdon's homes were built
Ruislip shows how fast the change came. The parish had only 1,012 inhabitants in 1801, and the Metropolitan Railway did not arrive until 1904. By 1911 the population was 6,217, and by 1939 Ruislip-Northwood had 47,760 people, as thousands of homes went up along the line in the 1930s [1].
At Ruislip Manor, George Ball's Manor Homes estate was built between 1933 and 1939. They were mainly small houses for people who wanted to own their first home, and a larger station opened in 1938 to serve them. The council says it took only six years to turn a quiet country area into suburb [1].
The Valuation Office Agency figures show the same story across the borough. Of Hillingdon's 119,060 homes, 36.5% were built between 1919 and 1939, against 22.0% across London, and a further 25.1% between 1945 and 1972. Only 1.8% date from before 1900, against 20.8% for London [2]. Interwar houses like these are a common starting point for a loft conversion.
How Hillingdon households live
The 2021 Census found 35.1% of Hillingdon households living in a semi-detached house, almost twice London's 18.6%. A further 13.9% live in a detached house, against 6.1% for London, and 19.9% in a terrace [3].
Only 30.9% of households live in a flat, against 54.0% across London. Most of those are in purpose-built blocks, at 26.2%, with just 2.9% in a flat inside a converted house [3]. With so many family houses, a kitchen renovation here is often about joining the kitchen to the garden.
Who owns Hillingdon's homes
56.6% of Hillingdon households own their home, 26.5% outright and 30.1% with a mortgage, against 45.2% across London [4].
A quarter of households, 25.9%, rent privately, below London's 30.0%, and 16.1% rent from a council or housing association, against 23.1% for London [4].
What a Hillingdon home costs
The average Hillingdon home cost £482,137 in August 2026, the same as a year earlier [5]. That is about 13% below the London average of £554,430, where prices fell by 2.2%, and about 64% above the England average of £293,525 [6].
Hillingdon has been below the London average every August for twenty years. In August 2006 the average home here cost £240,862, against London's £274,815. The biggest jump came between 2015 and 2016, when the average rose from £366,733 to £418,422, and August 2026 is the highest point in the series, so the average has doubled in twenty years [6].
Semis, flats and the gap between them
A flat or maisonette in Hillingdon averaged £291,852 in August 2026 and a terraced house £469,539, a gap of £177,687. A semi-detached house, the most common home here, averaged £597,163, and a detached house £962,371 [5] [6].
Flats fell by 2.4% over the year while semi-detached houses rose by 1.4% [5]. Flats and terraces both cost well below the London averages of £427,310 and £648,650 [6].
Moving from a semi to a detached house costs another £365,208 on average. For a family that likes its street, a house extension adds room without paying for that step.
What it costs to rent in Hillingdon
The average private rent in Hillingdon was £1,581 a month in September 2026, up 3.4% on a year earlier [5]. A one-bedroom home averaged £1,260 a month and a home with four or more bedrooms £2,654.
With a quarter of households renting privately, a dated bathroom is often the first thing a bathroom renovation puts right between tenancies.
Council Tax bands in Hillingdon
Council Tax bands are based on what a home would have sold for on the open market on 1 April 1991 [7]. In Hillingdon, Band D is the largest by a wide margin, with 39.9% of homes against 25.5% for London, and Bands C and D together hold 64.2% of homes [2].
Only 6.6% of Hillingdon homes are in Bands A and B, against 16.7% for London, and 4.9% are in Bands G and H, against 7.6% [2].
The rules on your street
Hillingdon has 31 conservation areas, from village centres such as Harefield and Ickenham to the canal locks at Cowley and Uxbridge. The first, Ruislip Village and West Drayton Green, were designated on 10 November 1969, and the newest, Rockingham Bridge, on 19 December 2012 [8].
One rule applies across the whole borough. Since 22 September 2014 an Article 4 direction has removed permitted development rights for single-storey rear extensions that reach more than 4 metres beyond the back wall of the original house, so those need planning permission anywhere in Hillingdon [9]. The council has further Article 4 directions on houses in multiple occupation and on turning commercial premises into homes [9].
Nationally, councils have 8 weeks to decide most planning applications, and 13 weeks for major development [10]. With the rear extension rule in force on every street, it is worth checking what needs permission before anyone starts drawing, then asking up to three vetted builders to quote for your renovation project in Hillingdon against the same plans.
Hillingdon housing statistics at a glance
- Average house price, August 2026: £482,137 (London £554,430) [5] [6]
- Change on a year earlier: 0.0% (London -2.2%) [5] [6]
- Average flat or maisonette: £291,852 (London £427,310) [5] [6]
- Average semi-detached house: £597,163 (London £730,580) [5] [6]
- Average private rent, September 2026: £1,581 a month [5]
- Homes built 1919 to 1939: 36.5% (London 22.0%) [2]
- Households living in a semi-detached house: 35.1% (London 18.6%) [3]
- Households who own their home: 56.6% (London 45.2%) [4]
- Homes in Council Tax Band D: 39.9% (London 25.5%) [2]
- Conservation areas: 31, with a borough-wide Article 4 direction on large rear extensions [8] [9]
Frequently asked questions
References
- Hillingdon Council, Ruislip, the River Pinn and Ruislip Lido. Historical towns and rivers. Accessed 6 November 2026
- Valuation Office Agency, Council Tax: stock of properties 2026. Table CTSOP4.1, properties by build period and Council Tax band at 31 March 2026
- ONS, Census 2021 table TS044: Accommodation type. Households by type of home, Hillingdon and London
- ONS, Census 2021 table TS054: Tenure. Households by tenure, Hillingdon and London
- ONS, Housing prices in Hillingdon. UK House Price Index for August 2026 and Price Index of Private Rents for September 2026, published 21 October 2026
- HM Land Registry, UK House Price Index. Average prices for Hillingdon, London and England, August 2006 to August 2026
- GOV.UK, How domestic properties are assessed for Council Tax bands. Accessed 29 October 2026
- Hillingdon Council, Conservation areas in Hillingdon. Accessed 6 November 2026
- Hillingdon Council, Article 4 Directions: Large rear extensions. Accessed 6 November 2026
- GOV.UK, Determining a planning application. Planning practice guidance, paragraph 001, Accessed 6 November 2026
Thinking of improving rather than moving?
Tell us about your Hillingdon home and what you want to change. We'll give you a free estimate, then up to three vetted builders quote against the same specification.