
Wimbledon housing statistics 2026
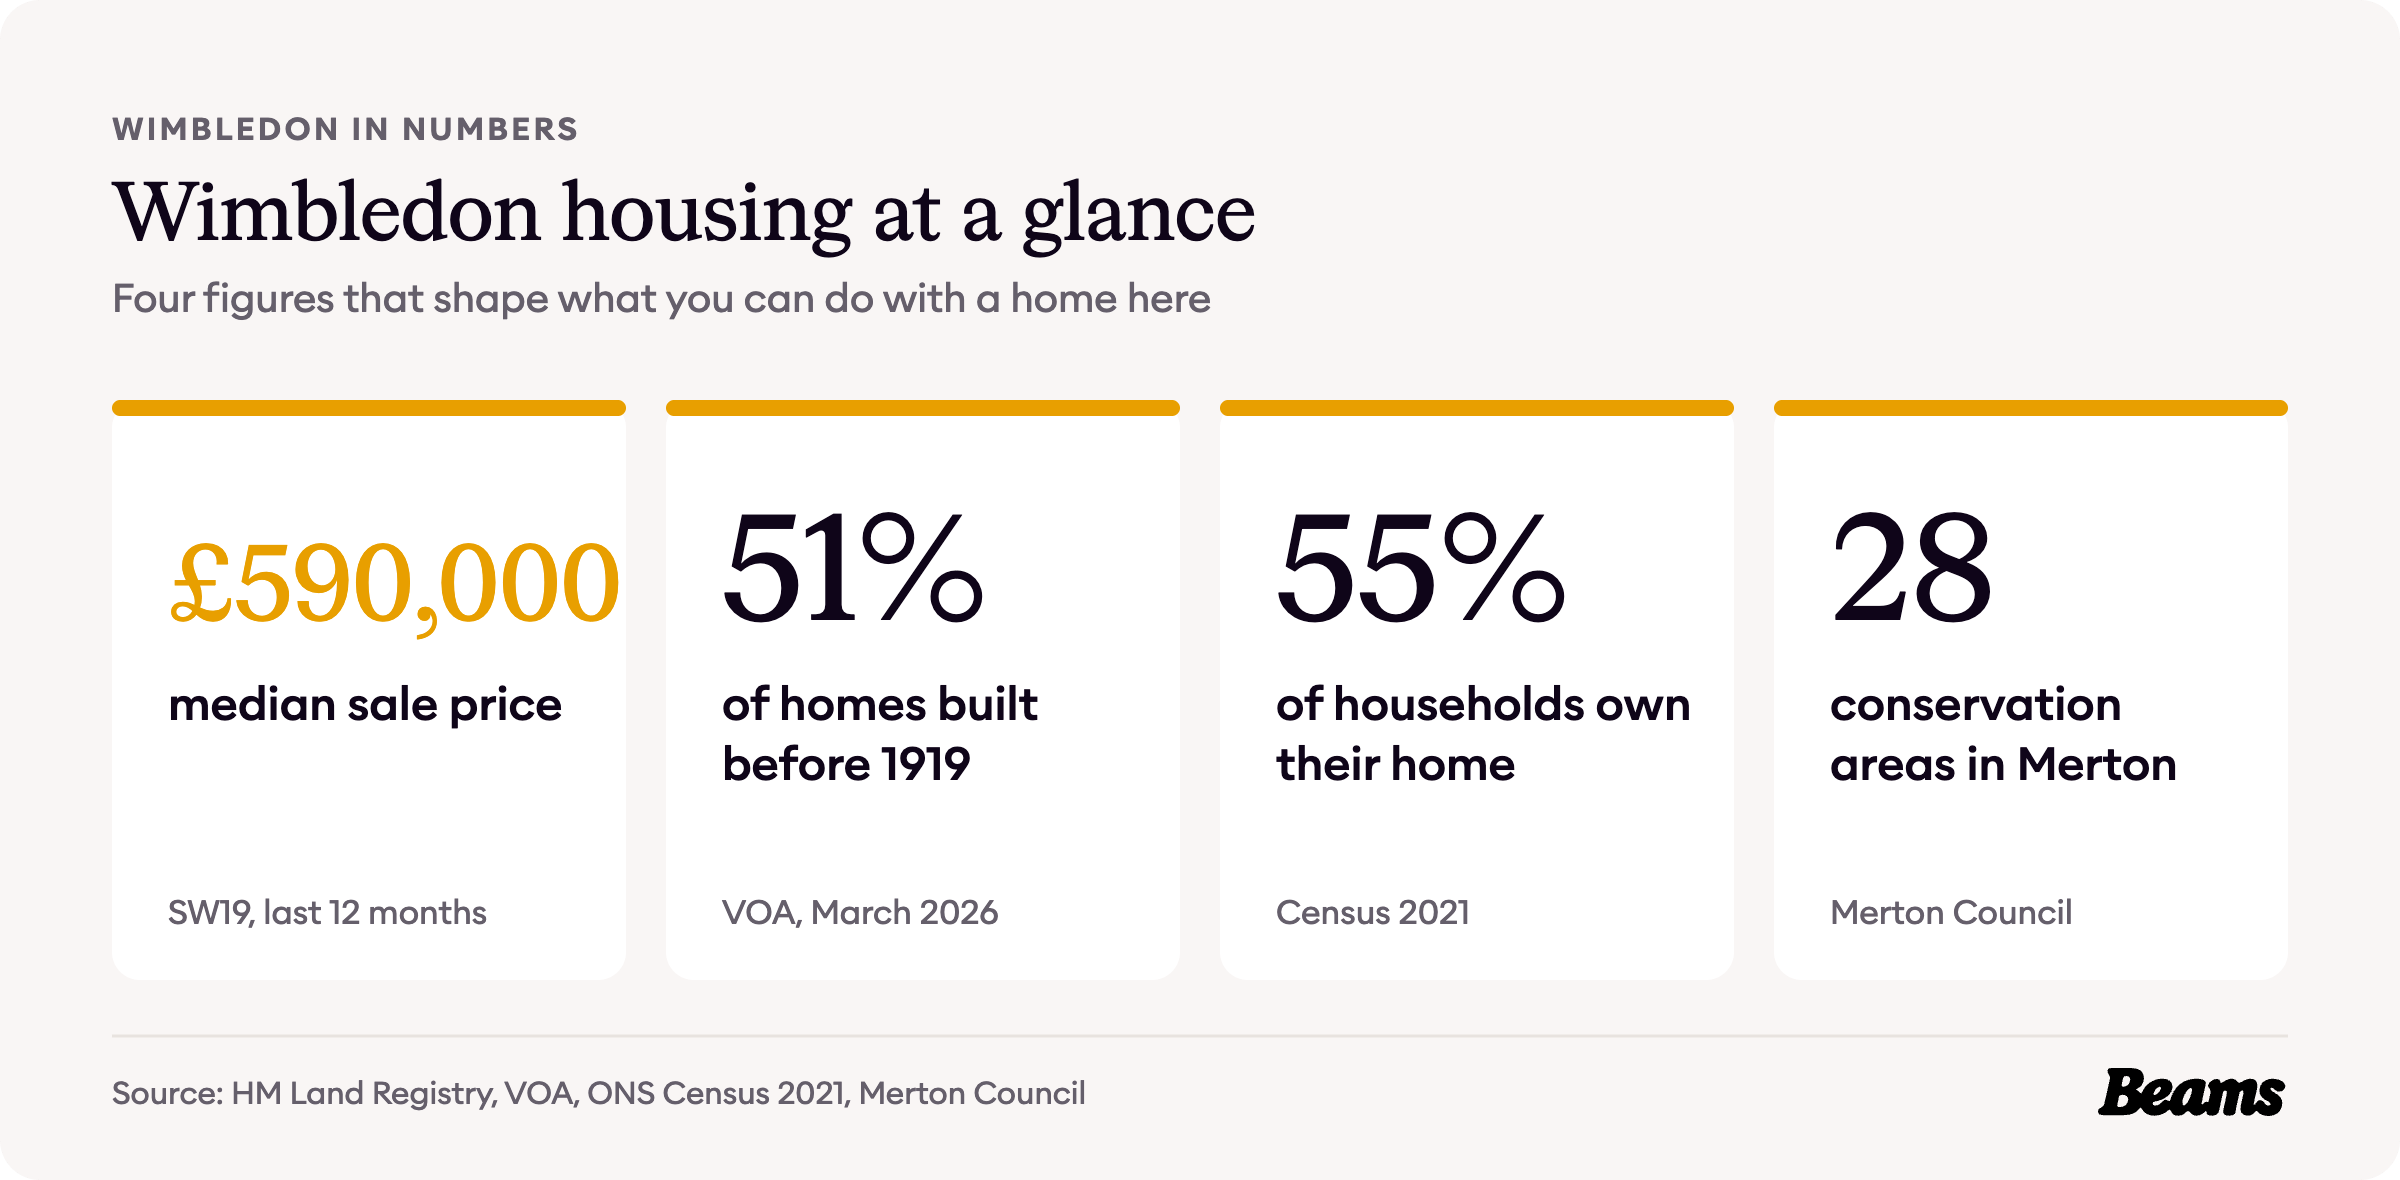
Wimbledon became a railway suburb after the line to London opened in 1838, and its housing still shows it. More than half of its homes were built before 1919, most households own their home, and the typical SW19 home sold for £590,000 in the year to September 2026.
Every figure on this page comes from an official source and is dated, so you know what you are working with before you plan a home renovation in Wimbledon. Sources are numbered in brackets and listed in full at the end.
How Wimbledon was built
The railway made Wimbledon. The main line of the London and South-Western Railway opened in 1838, and by 1912 the Victoria County History described Wimbledon as "a very favourite and accessible suburb" [1].
The growth came late and it came fast. The parish had about 6,000 people in 1865, 25,777 in 1891 and 41,652 by 1901 [1]. The common was kept out of the builders' hands: an Act of Parliament of 1871 preserved it for the public [1].
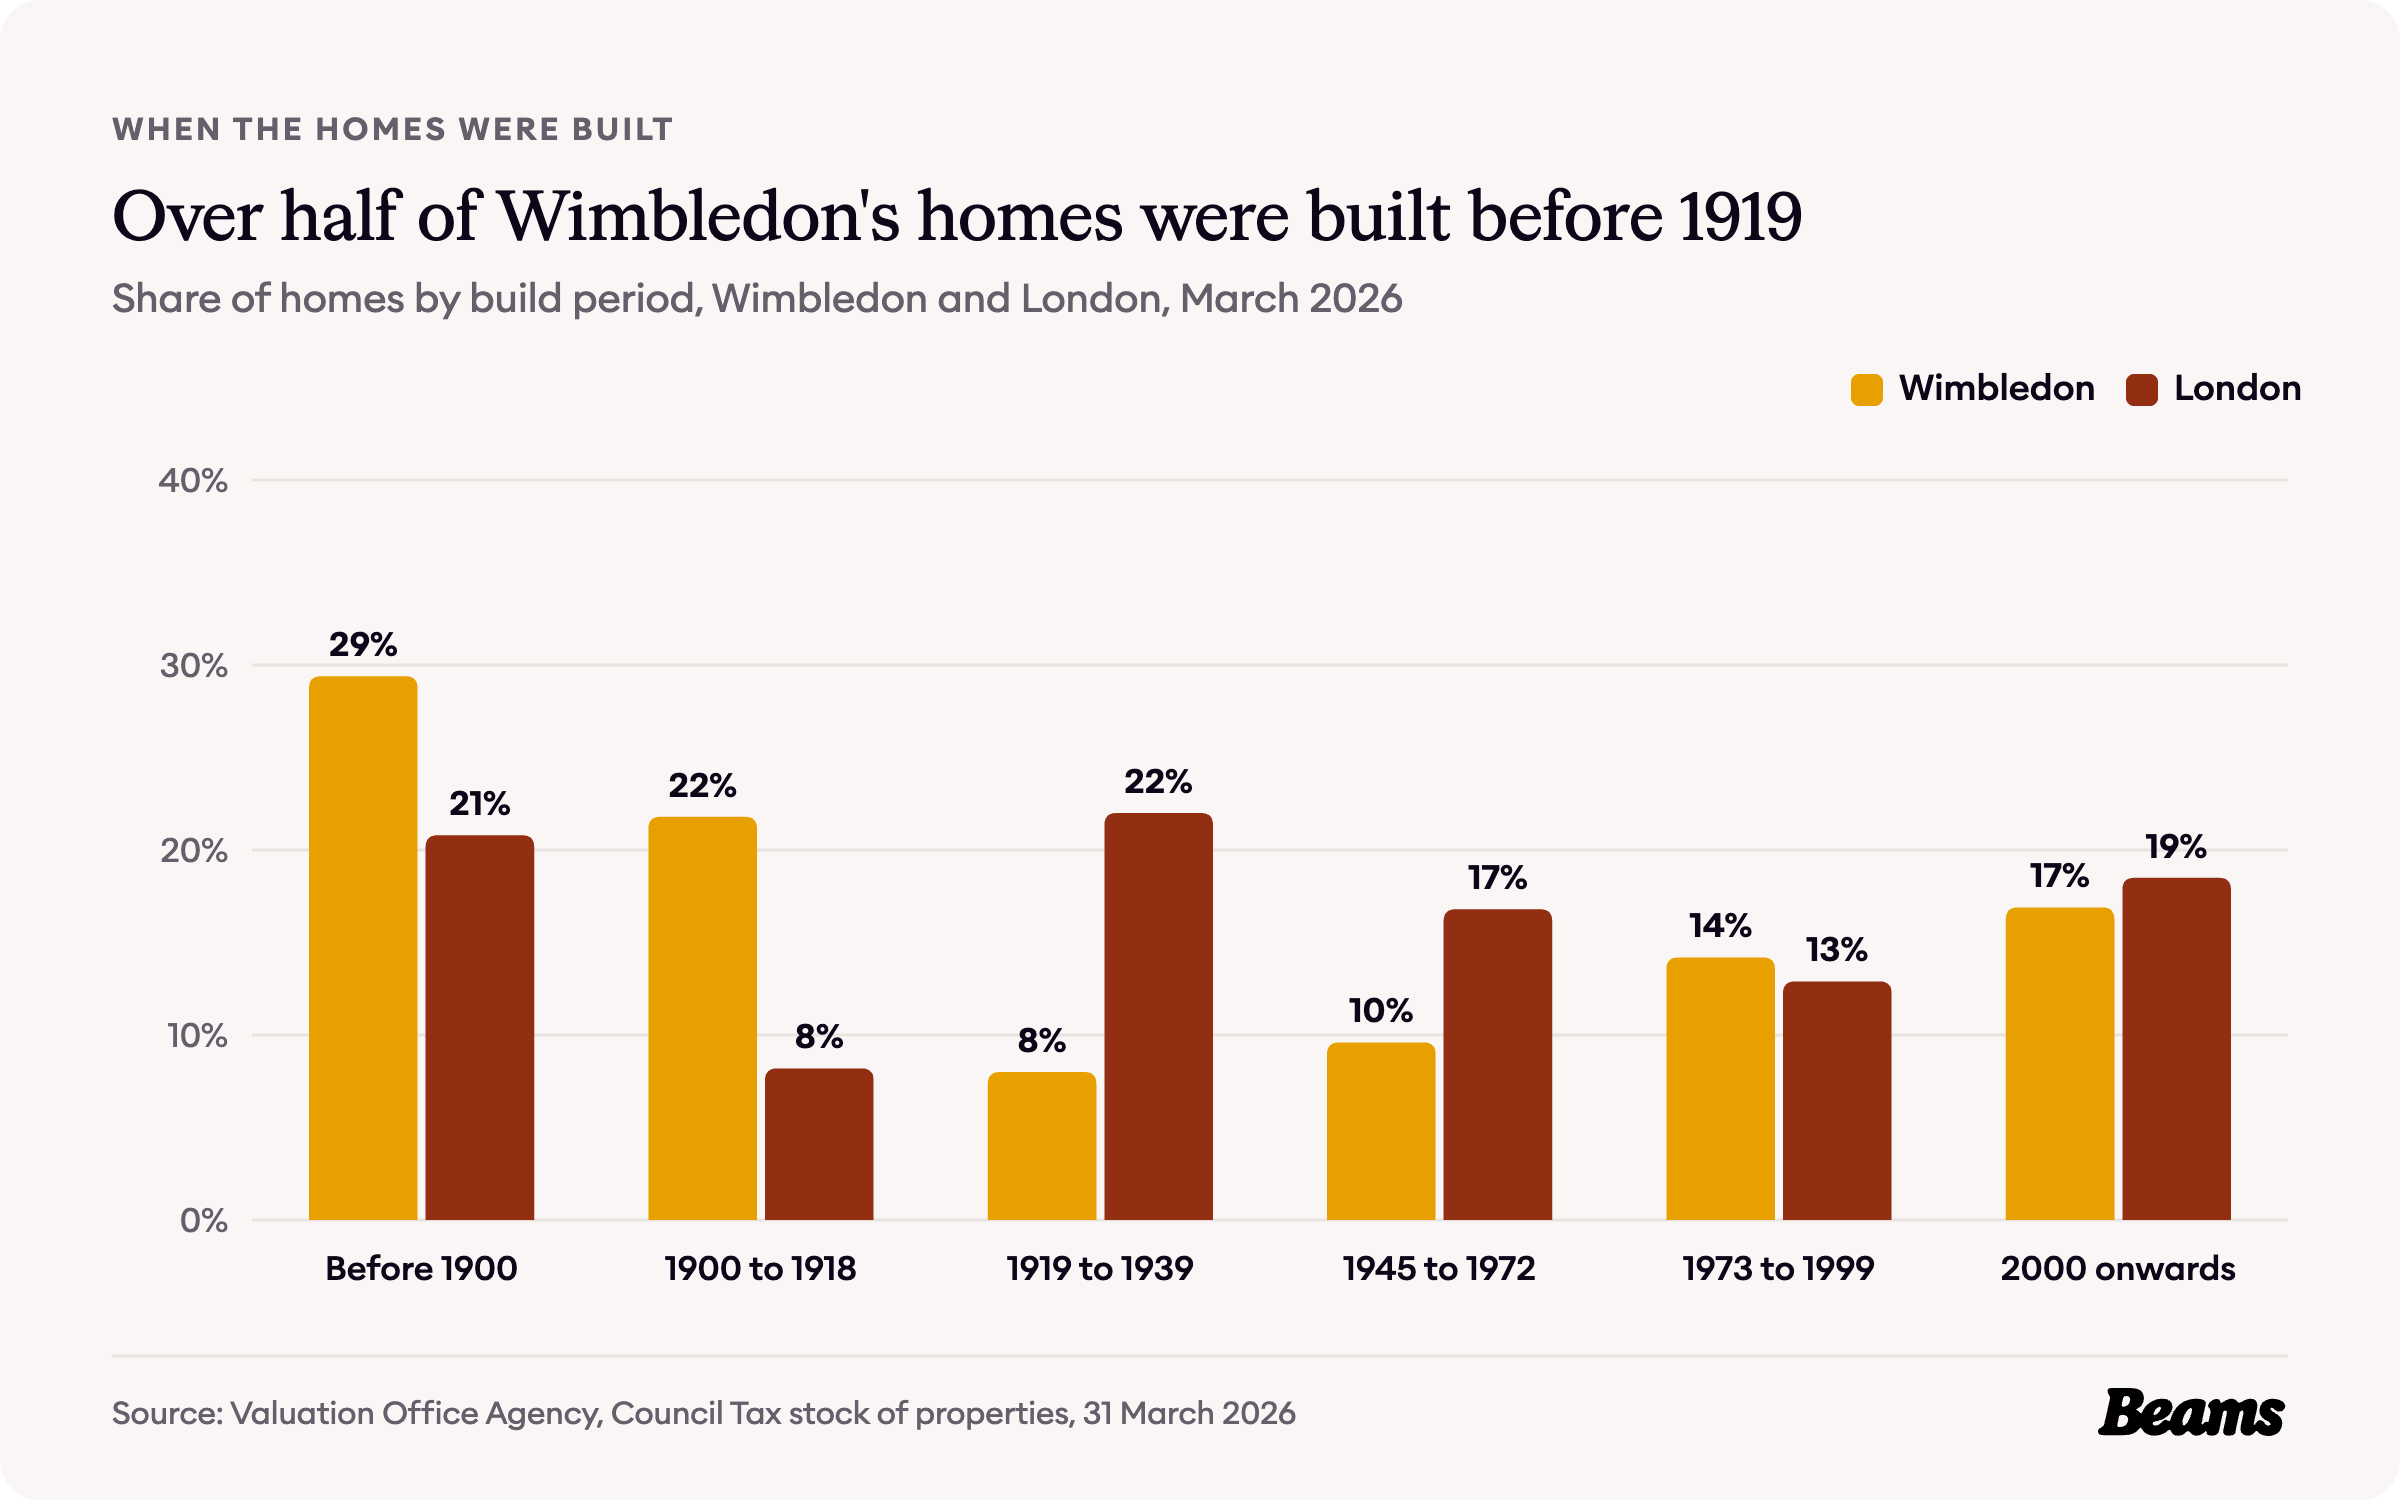
You can still read that boom in the housing. The Valuation Office Agency counts 22,290 homes in the six census areas that make up Wimbledon. 29.4% were built before 1900 and another 21.8% between 1900 and 1918, so 51.2% date from before 1919. Across London the two figures add up to 29.0% [2].
Very little was built between the wars, 8.0% of homes against 22.0% for London, and 16.9% have gone up since 2000, a little below London's 18.5% [2]. Those Victorian and Edwardian houses, with their tall pitched roofs, are where most loft conversions in Wimbledon begin.
How Wimbledon households live
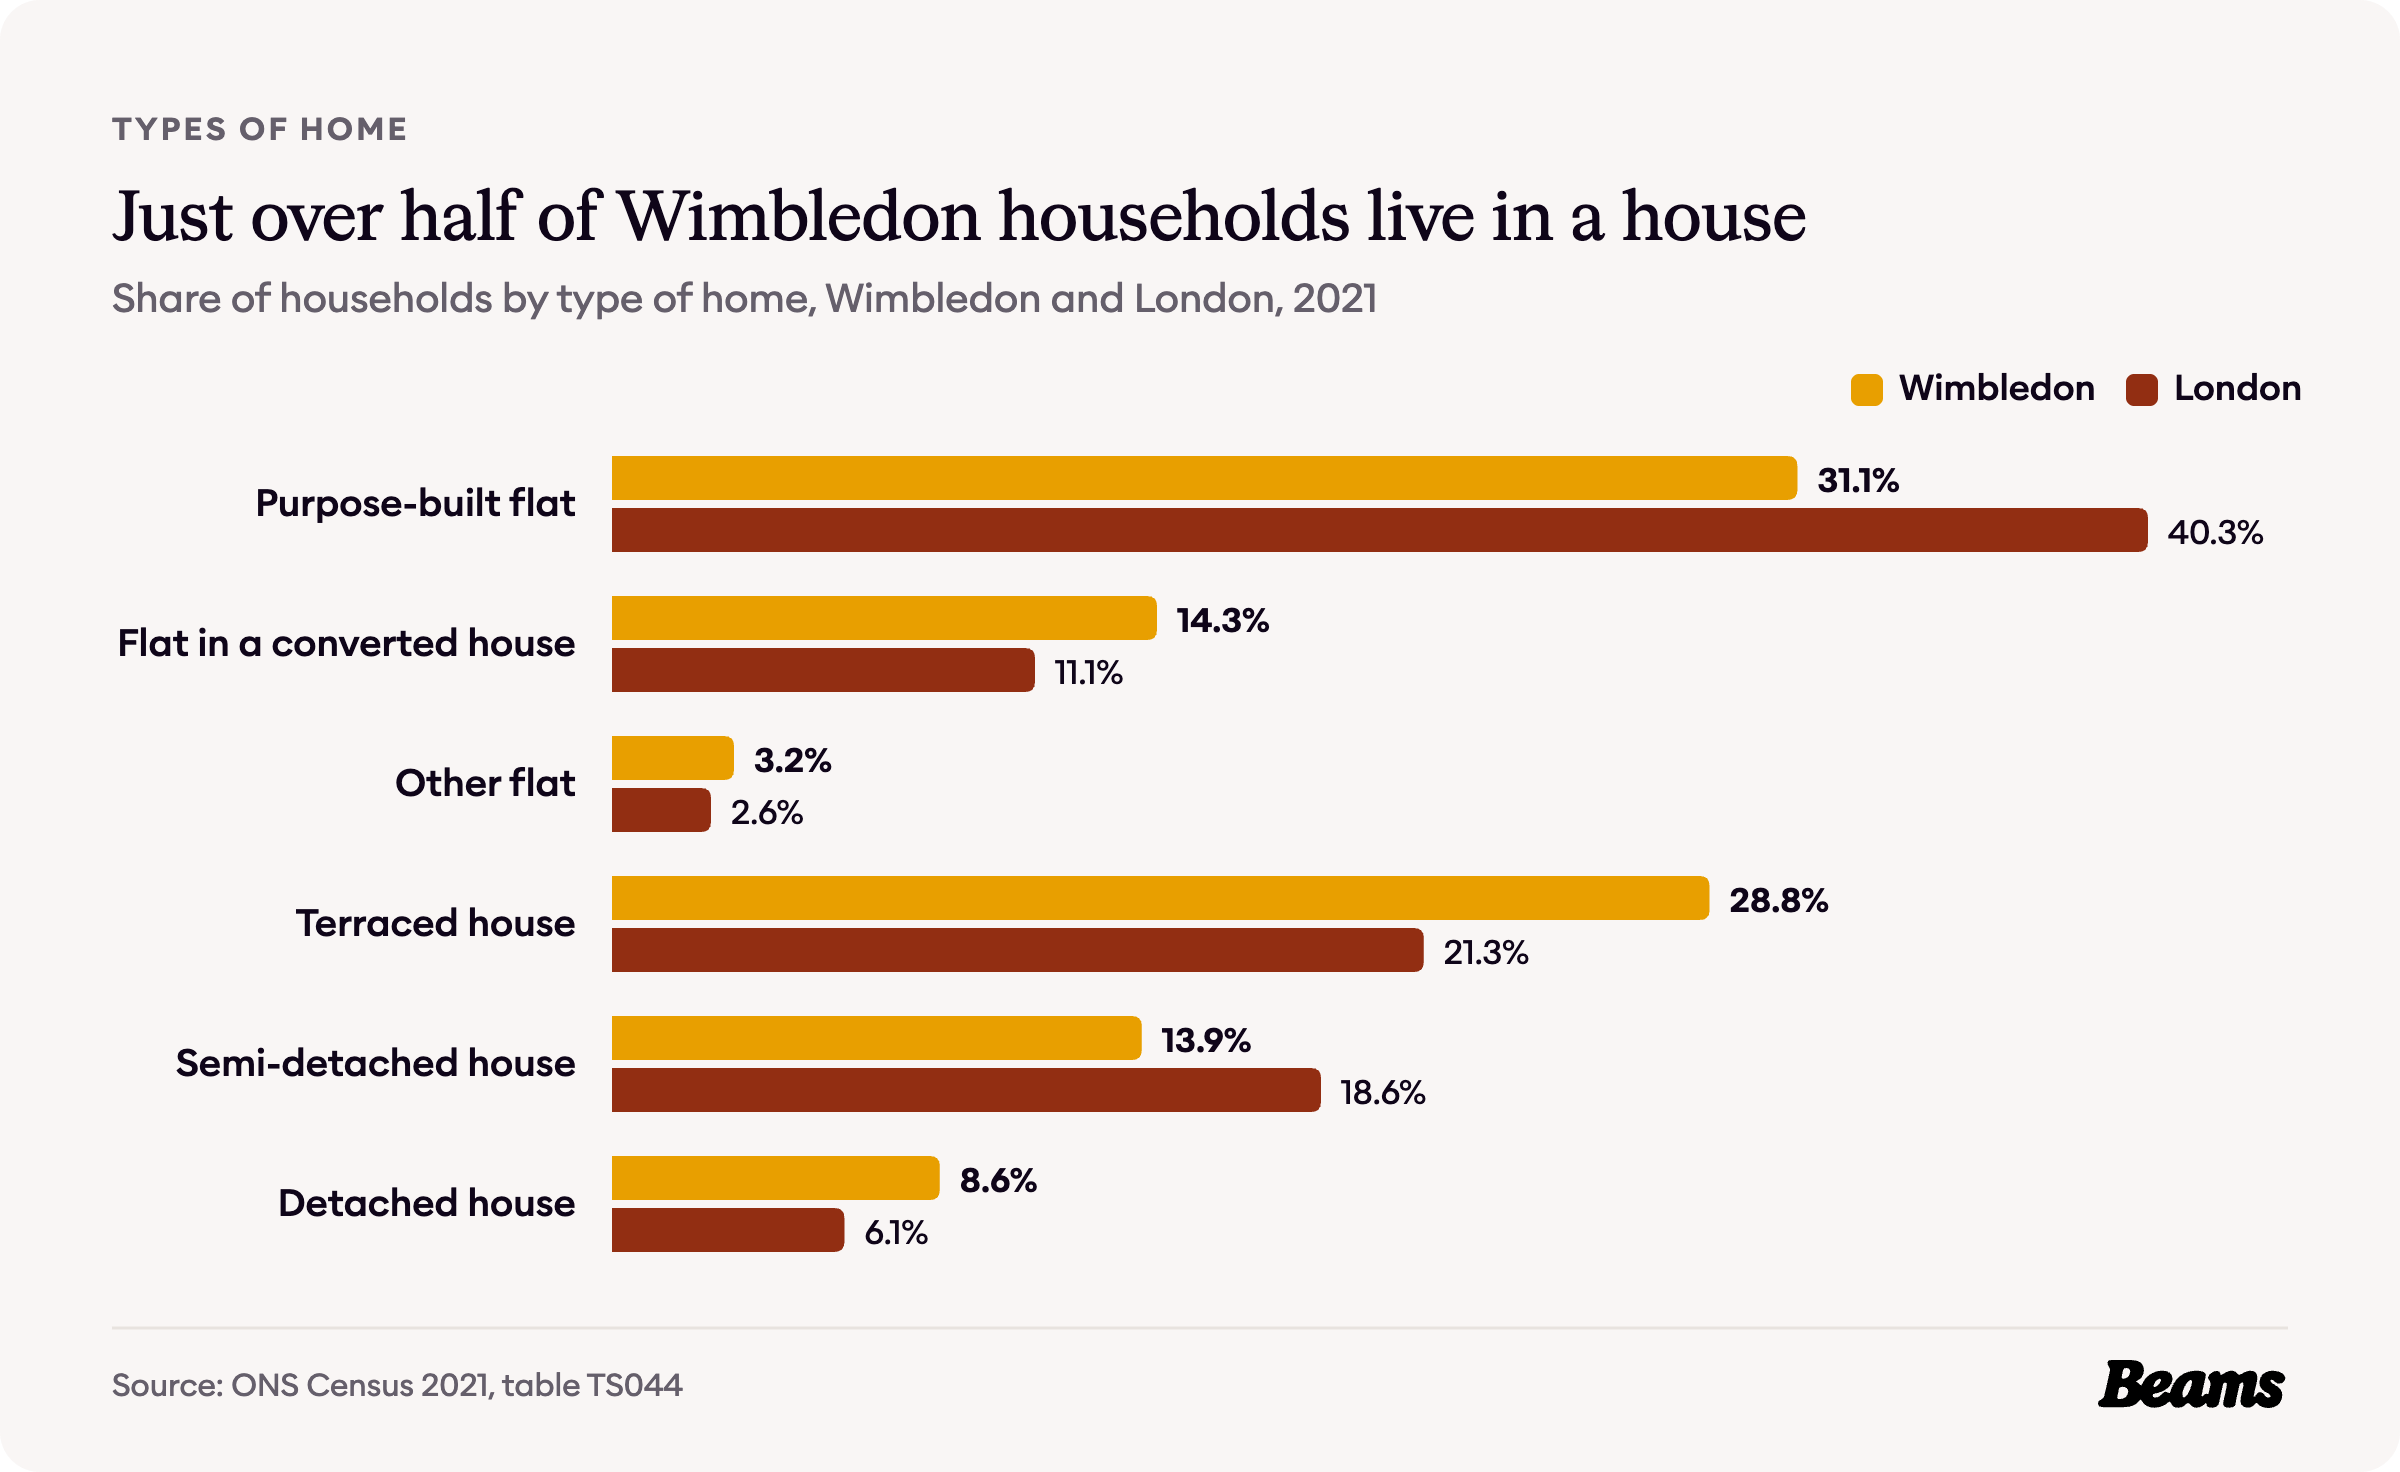
Wimbledon is more of a house neighbourhood than London as a whole. The 2021 Census found 28.8% of households in a terraced house, 13.9% in a semi-detached house and 8.6% in a detached house, 51.3% in all, against 46.0% across London [3].
The rest live in flats: 31.1% in a purpose-built block and 14.3% in a flat inside a converted house, against 40.3% and 11.1% for London [3]. Merton Council points out that permitted development rights for householder extensions do not apply to flats, apartments and maisonettes [4]. For the many Wimbledon households in a flat, the big project usually happens inside, and a kitchen renovation in Wimbledon is often the change that makes the most difference.
Who owns Wimbledon's homes
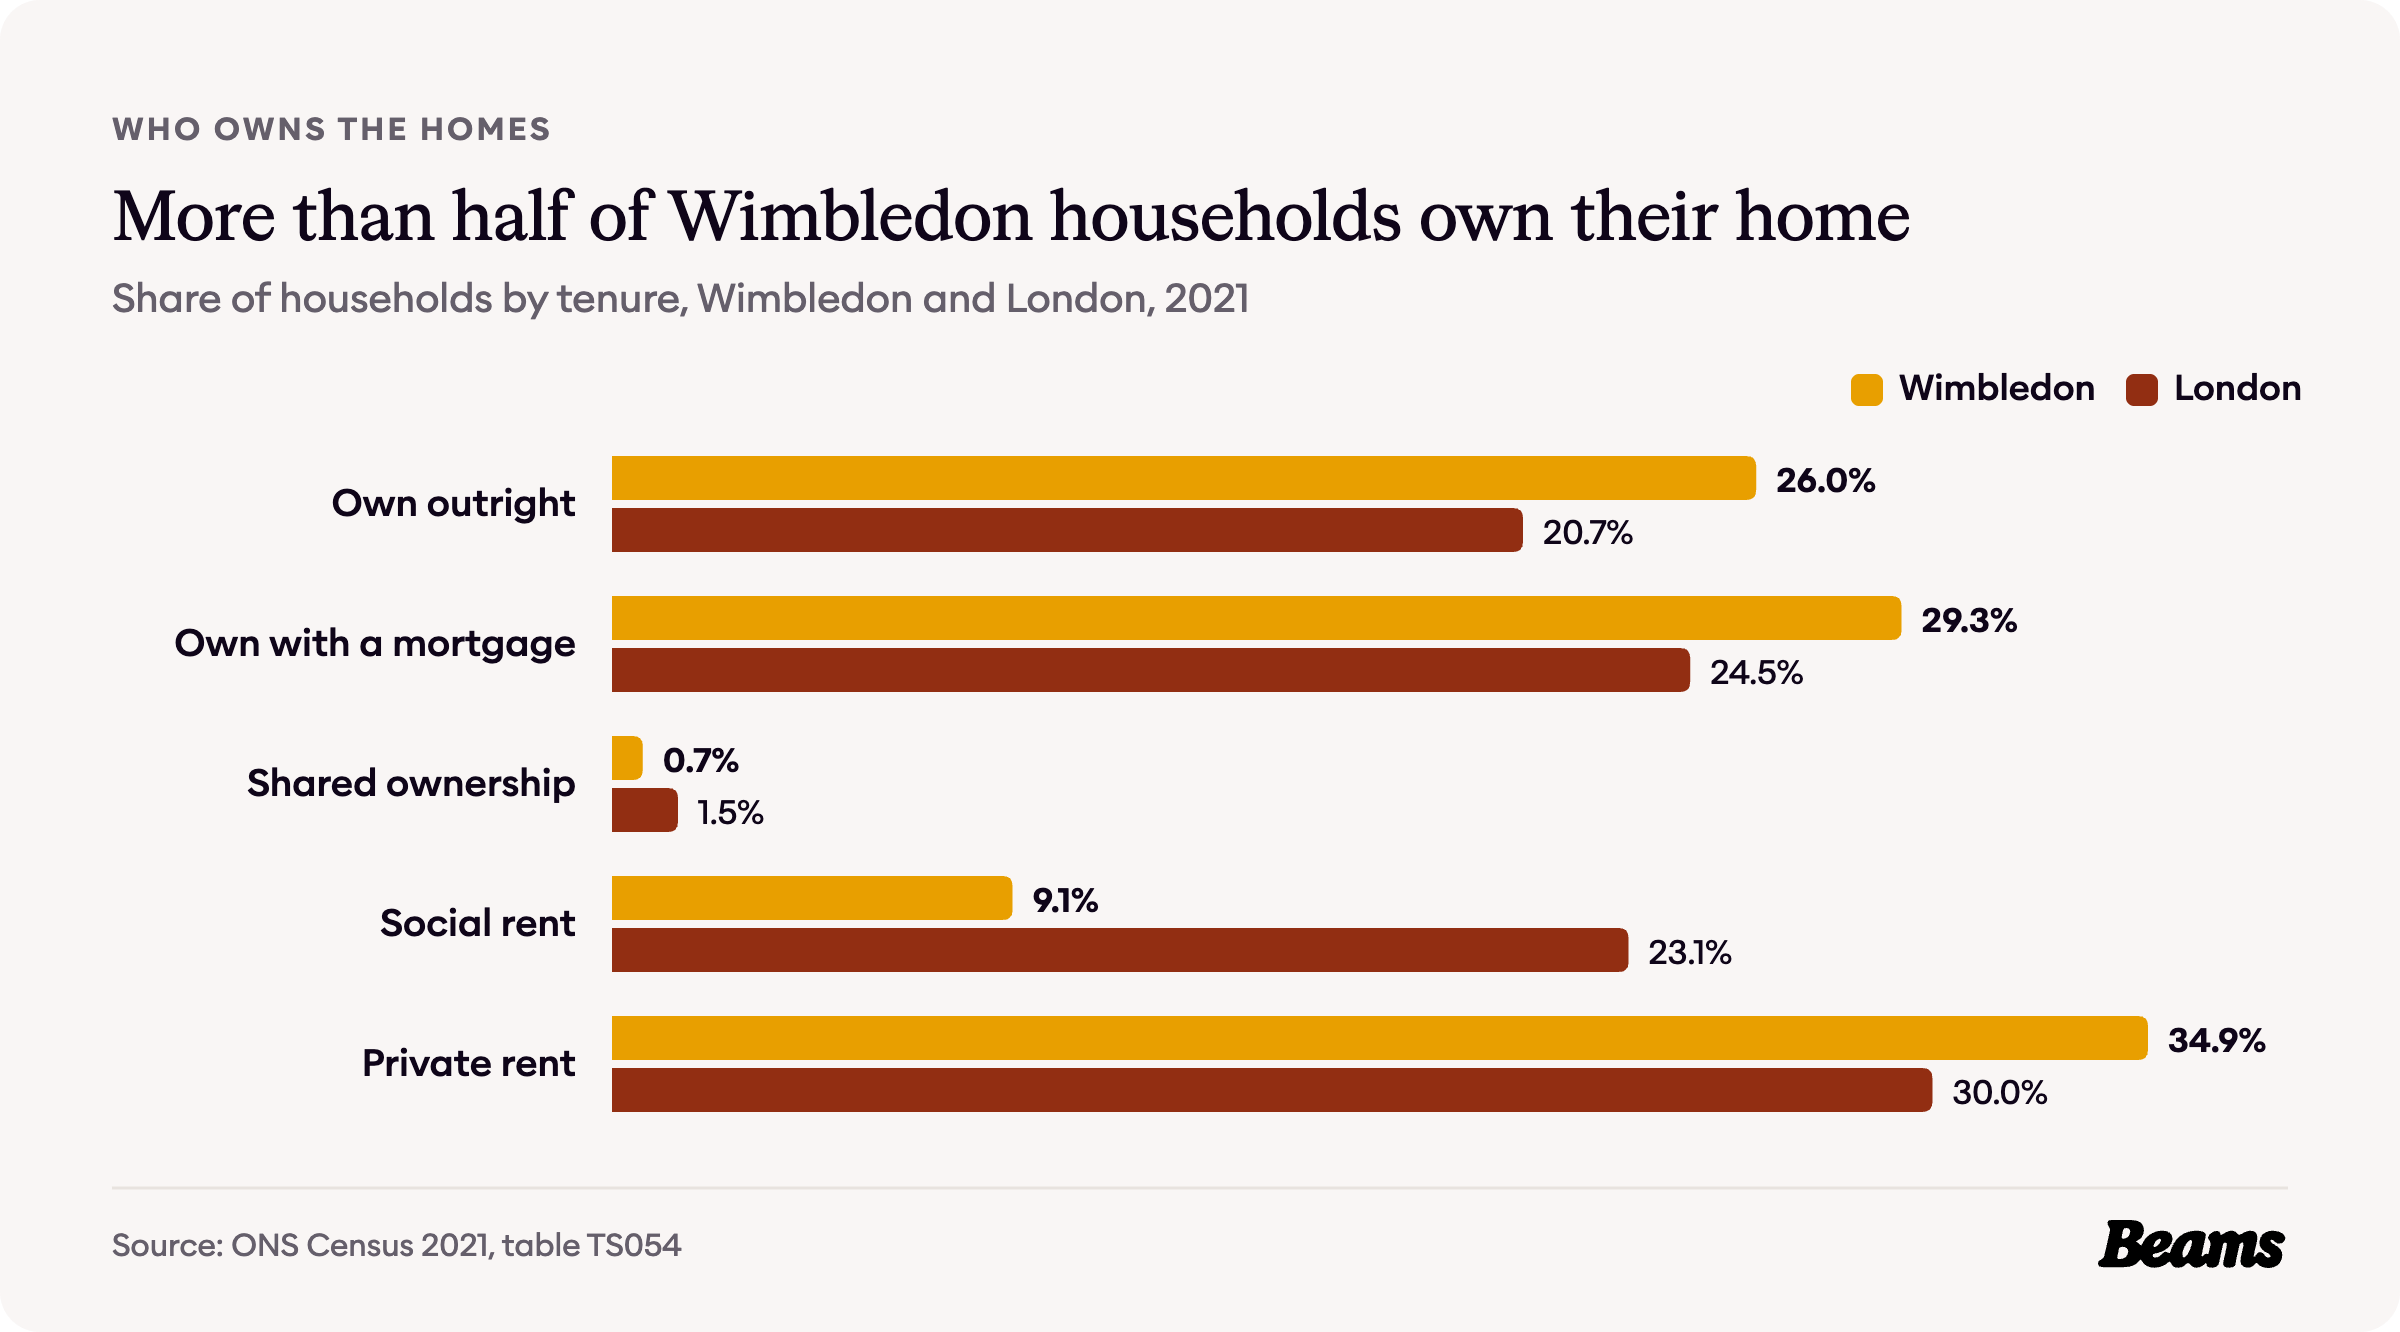
Most Wimbledon households own their home. 26.0% own it outright and 29.3% with a mortgage, 55.3% in all, against 45.2% across London [5].
Private renting is common too, at 34.9% of households against 30.0% for London. Social renting is far rarer than in most of the capital, at 9.1% of households against 23.1% [5].
What a Wimbledon home costs
First, a note on where the figures come from. The UK House Price Index and the rent figures cover the whole London Borough of Merton. The census and VOA figures on this page cover Wimbledon's six census areas: Wimbledon Park & Durnsford Road, Wimbledon Common, Wimbledon Broadway North, Wimbledon Hill, South Wimbledon and Wimbledon Broadway South. The local sale prices cover the SW19 postcode district.
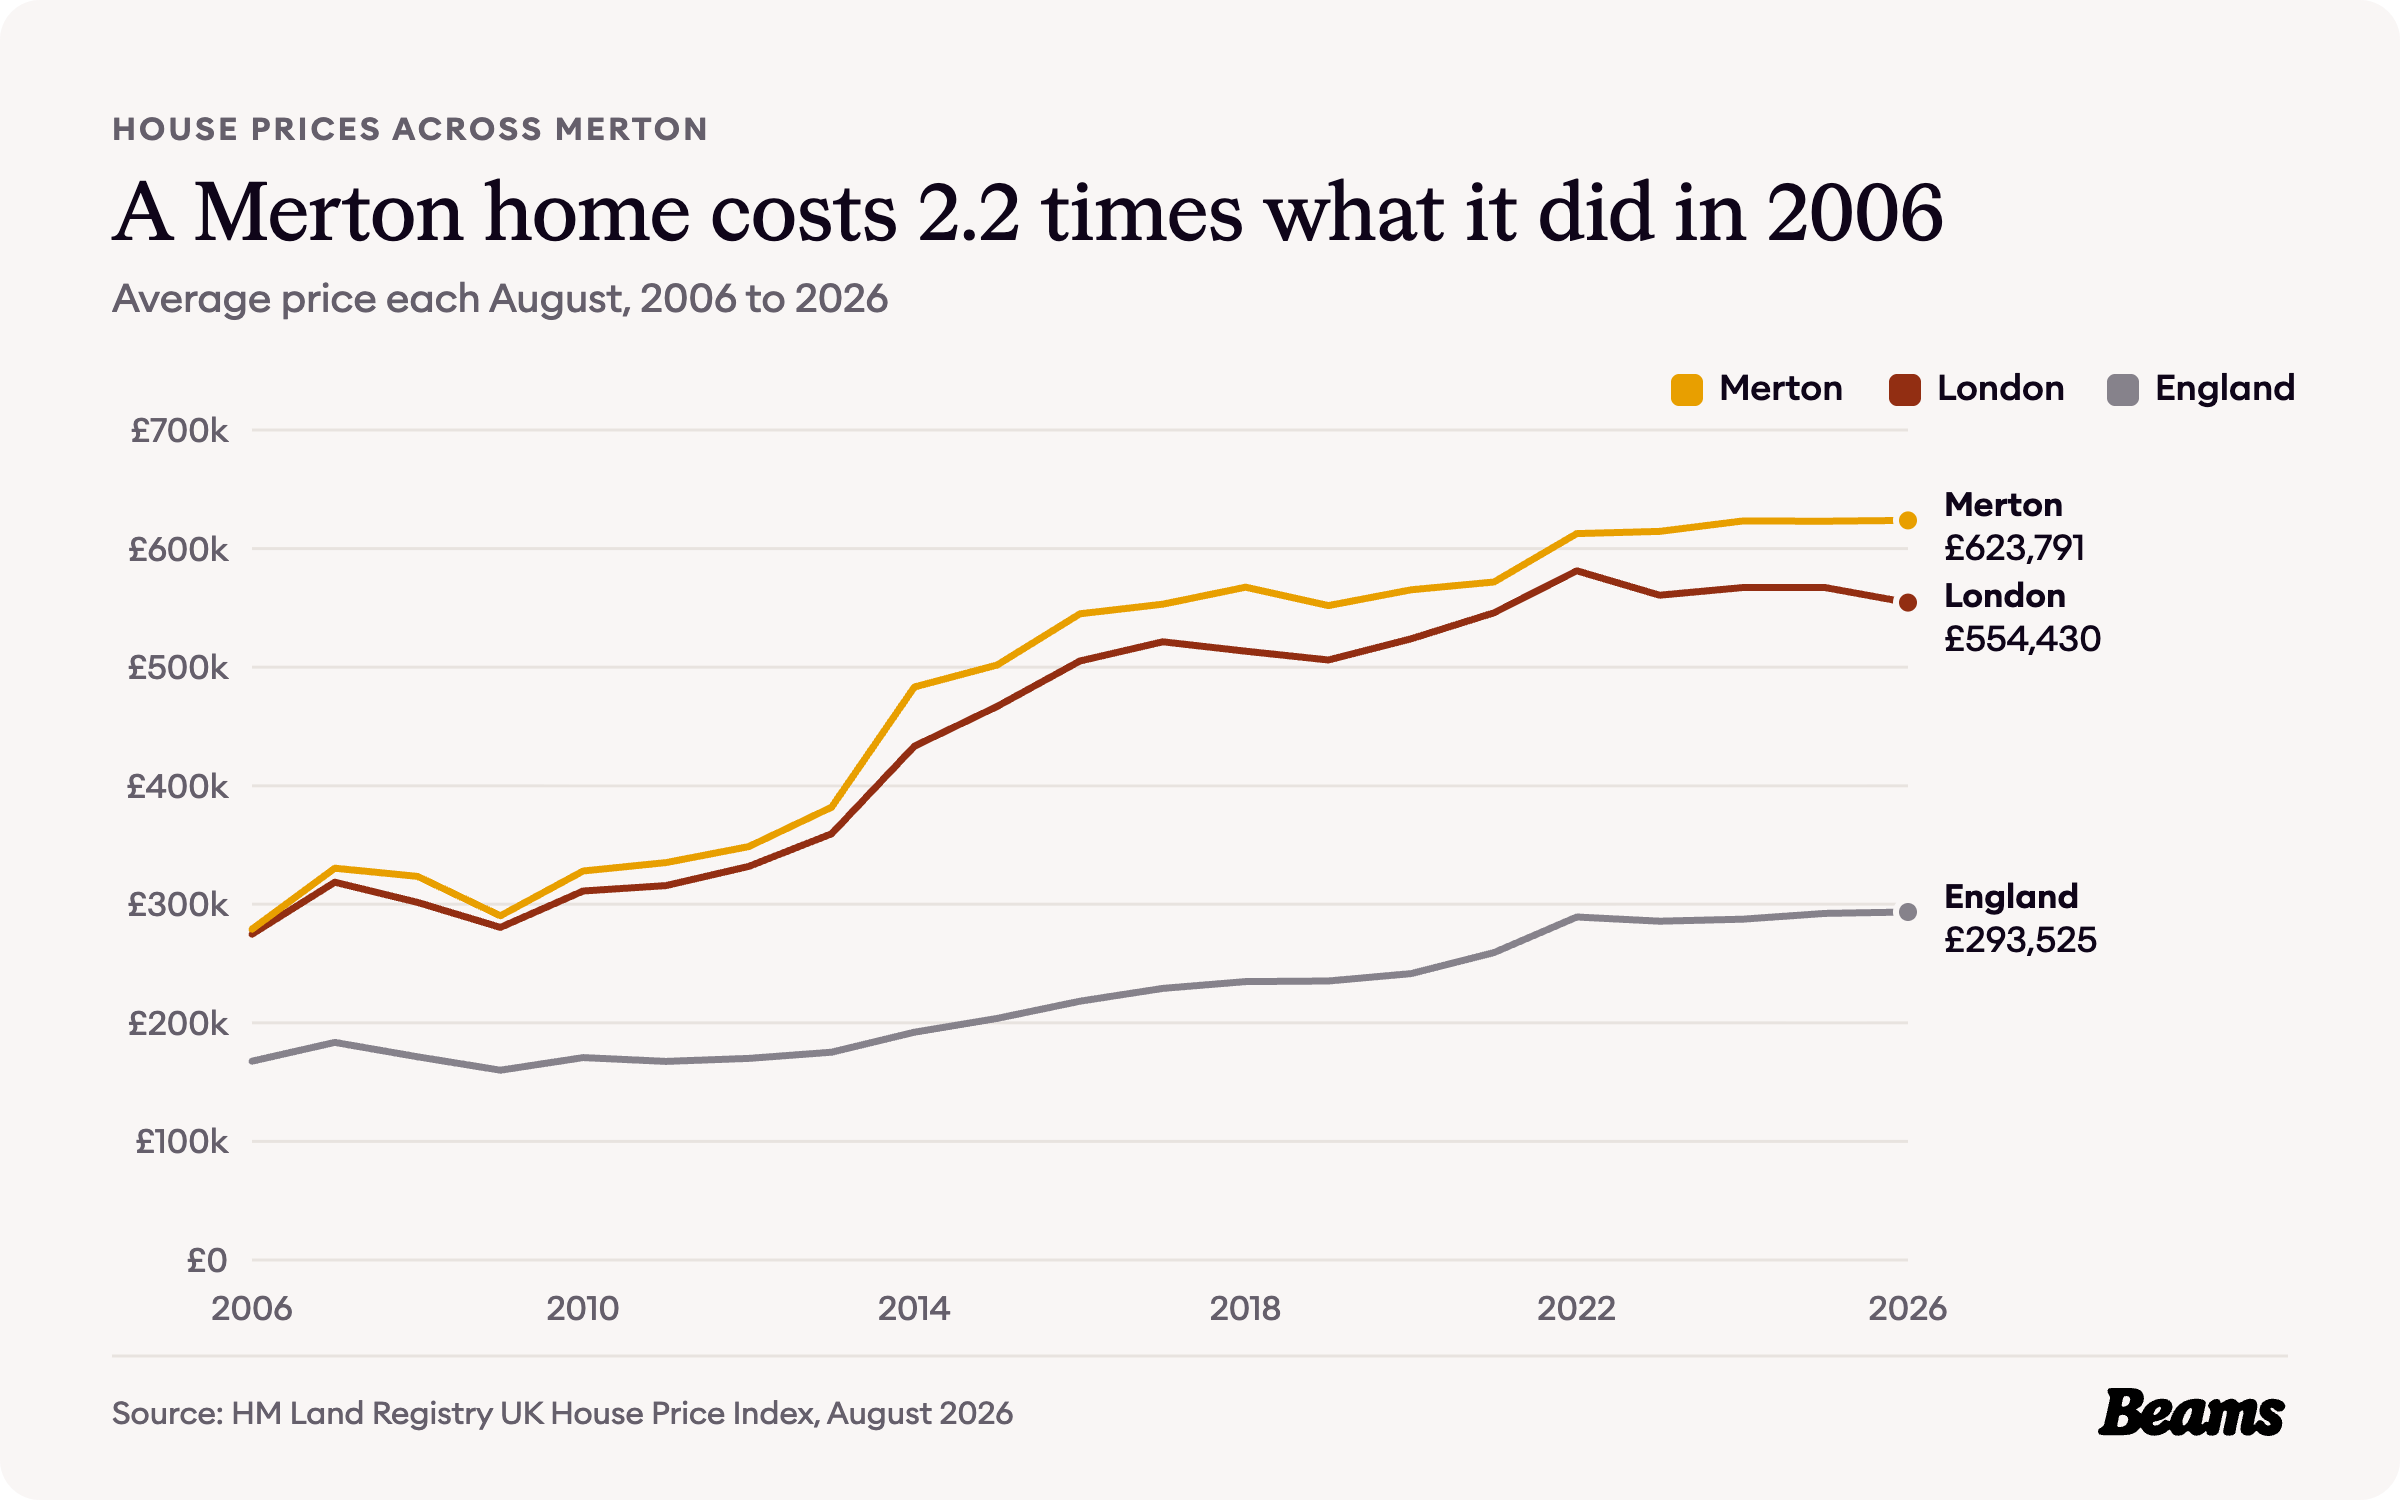
The average Merton home cost £623,791 in August 2026, 0.1% more than a year earlier [6]. That is about 12.5% above the London average of £554,430, which fell 2.2% over the same year, and more than twice the England average of £293,525 [7].
Merton has stayed ahead of London for twenty years. In August 2006 its average was £279,012, just above London's £274,815, and it has been higher every August since. The biggest single jump came between 2013 and 2014, when the Merton average rose from £381,940 to £483,287 [7].
Flats, terraces and what sells in SW19
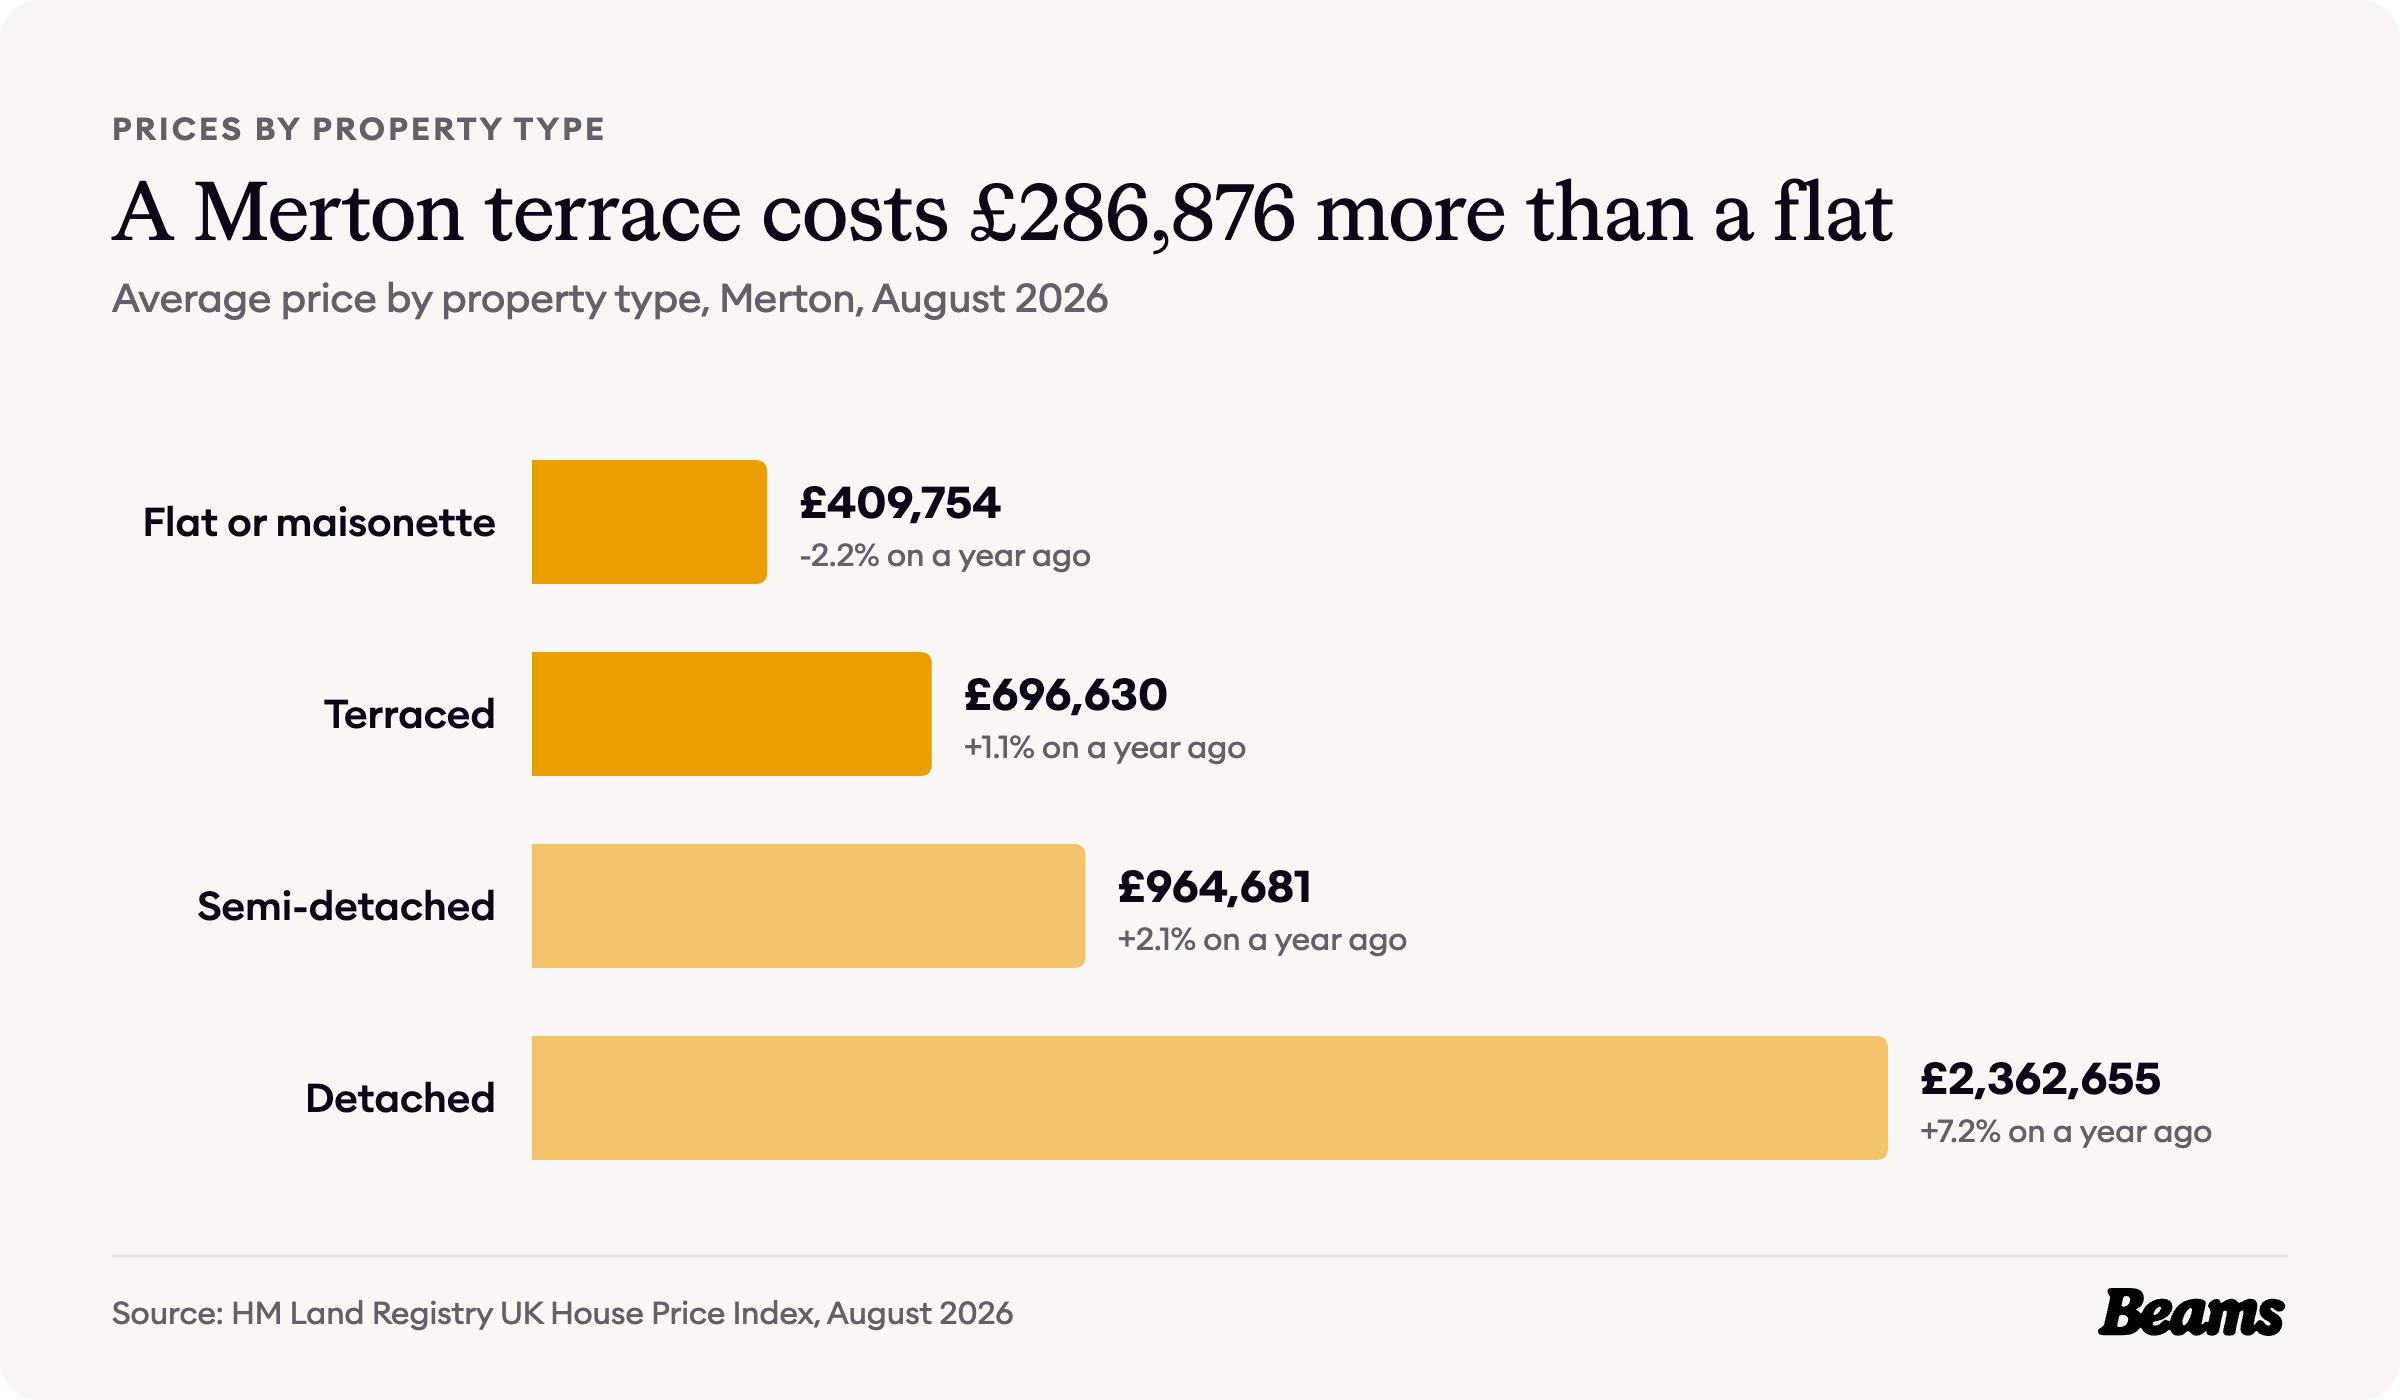
Across Merton, a flat or maisonette averaged £409,754 in August 2026 and a terraced house £696,630, a gap of £286,876 [6]. Semi-detached homes averaged £964,681 and detached homes £2,362,655, up 7.2% on a year earlier.
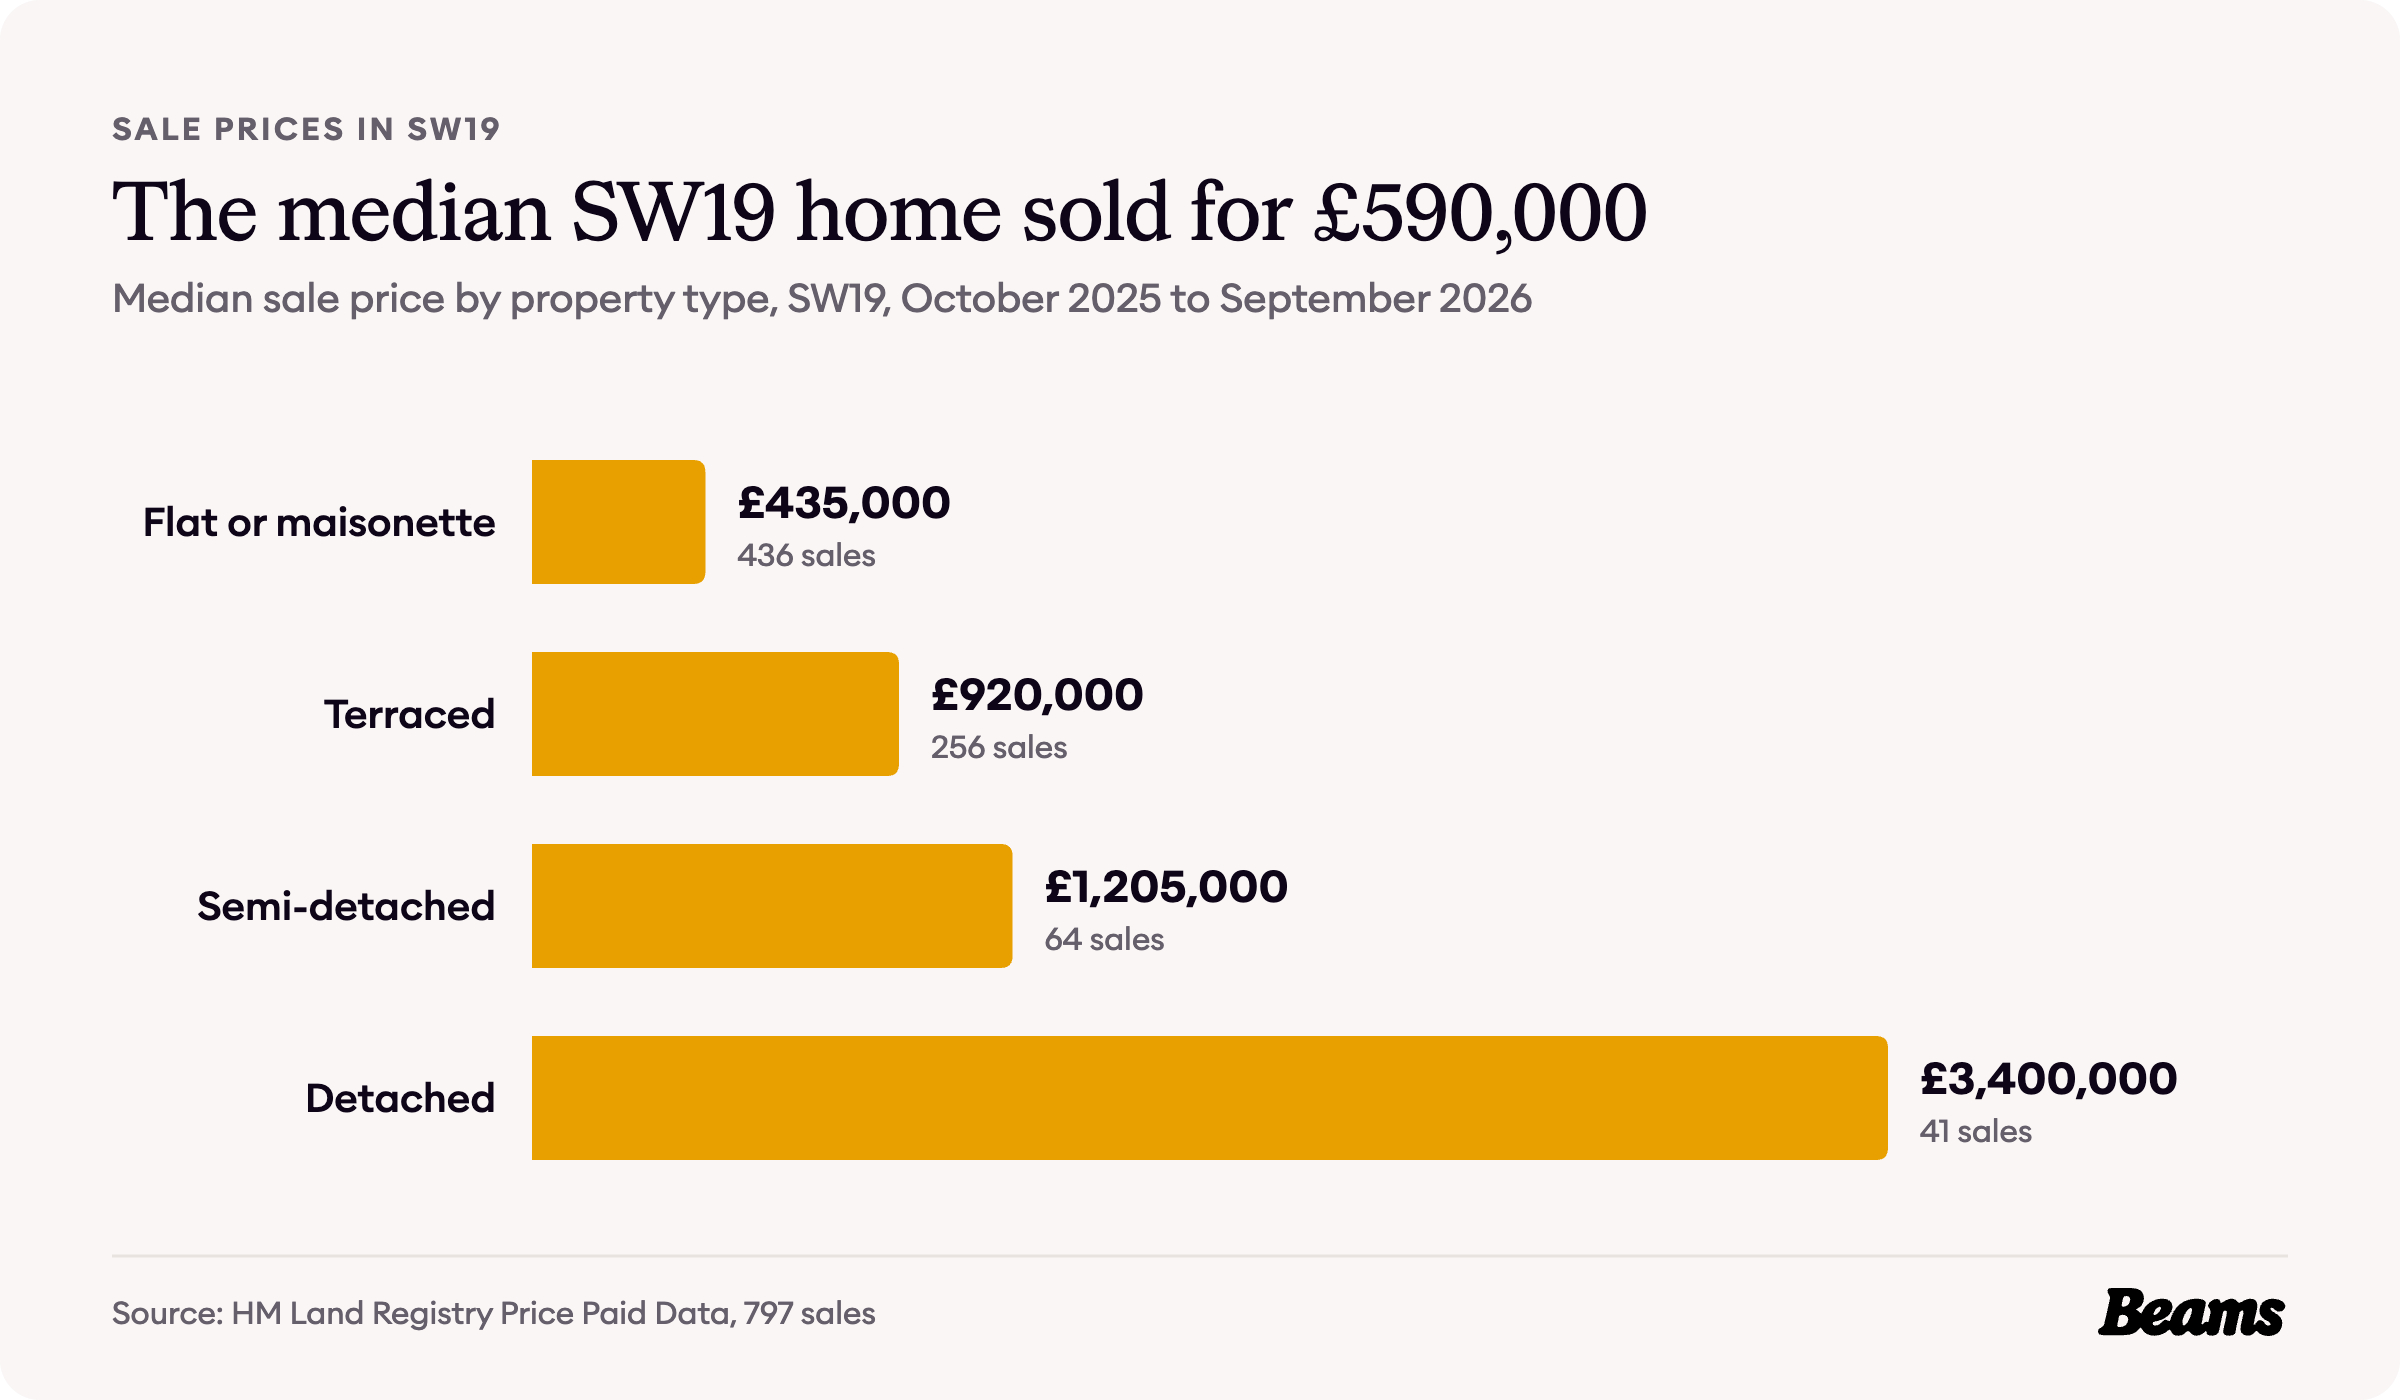
Sale prices in SW19 sit well above those borough averages for houses. HM Land Registry recorded 797 sales in the district between October 2025 and September 2026, at a median price of £590,000. The median flat sold for £435,000, the median terraced house for £920,000 and the median semi-detached house for £1,205,000, and the 41 detached houses that sold had a median of £3,400,000 [8].
Those steps are what Wimbledon owners weigh up before they move. Across Merton, first-time buyers paid an average of £515,923 in August 2026 and home movers £790,649 [6]. For a family already in a terrace, a house extension in Wimbledon adds the room without paying for the jump from £920,000 to £1,205,000.
What it costs to rent in Wimbledon
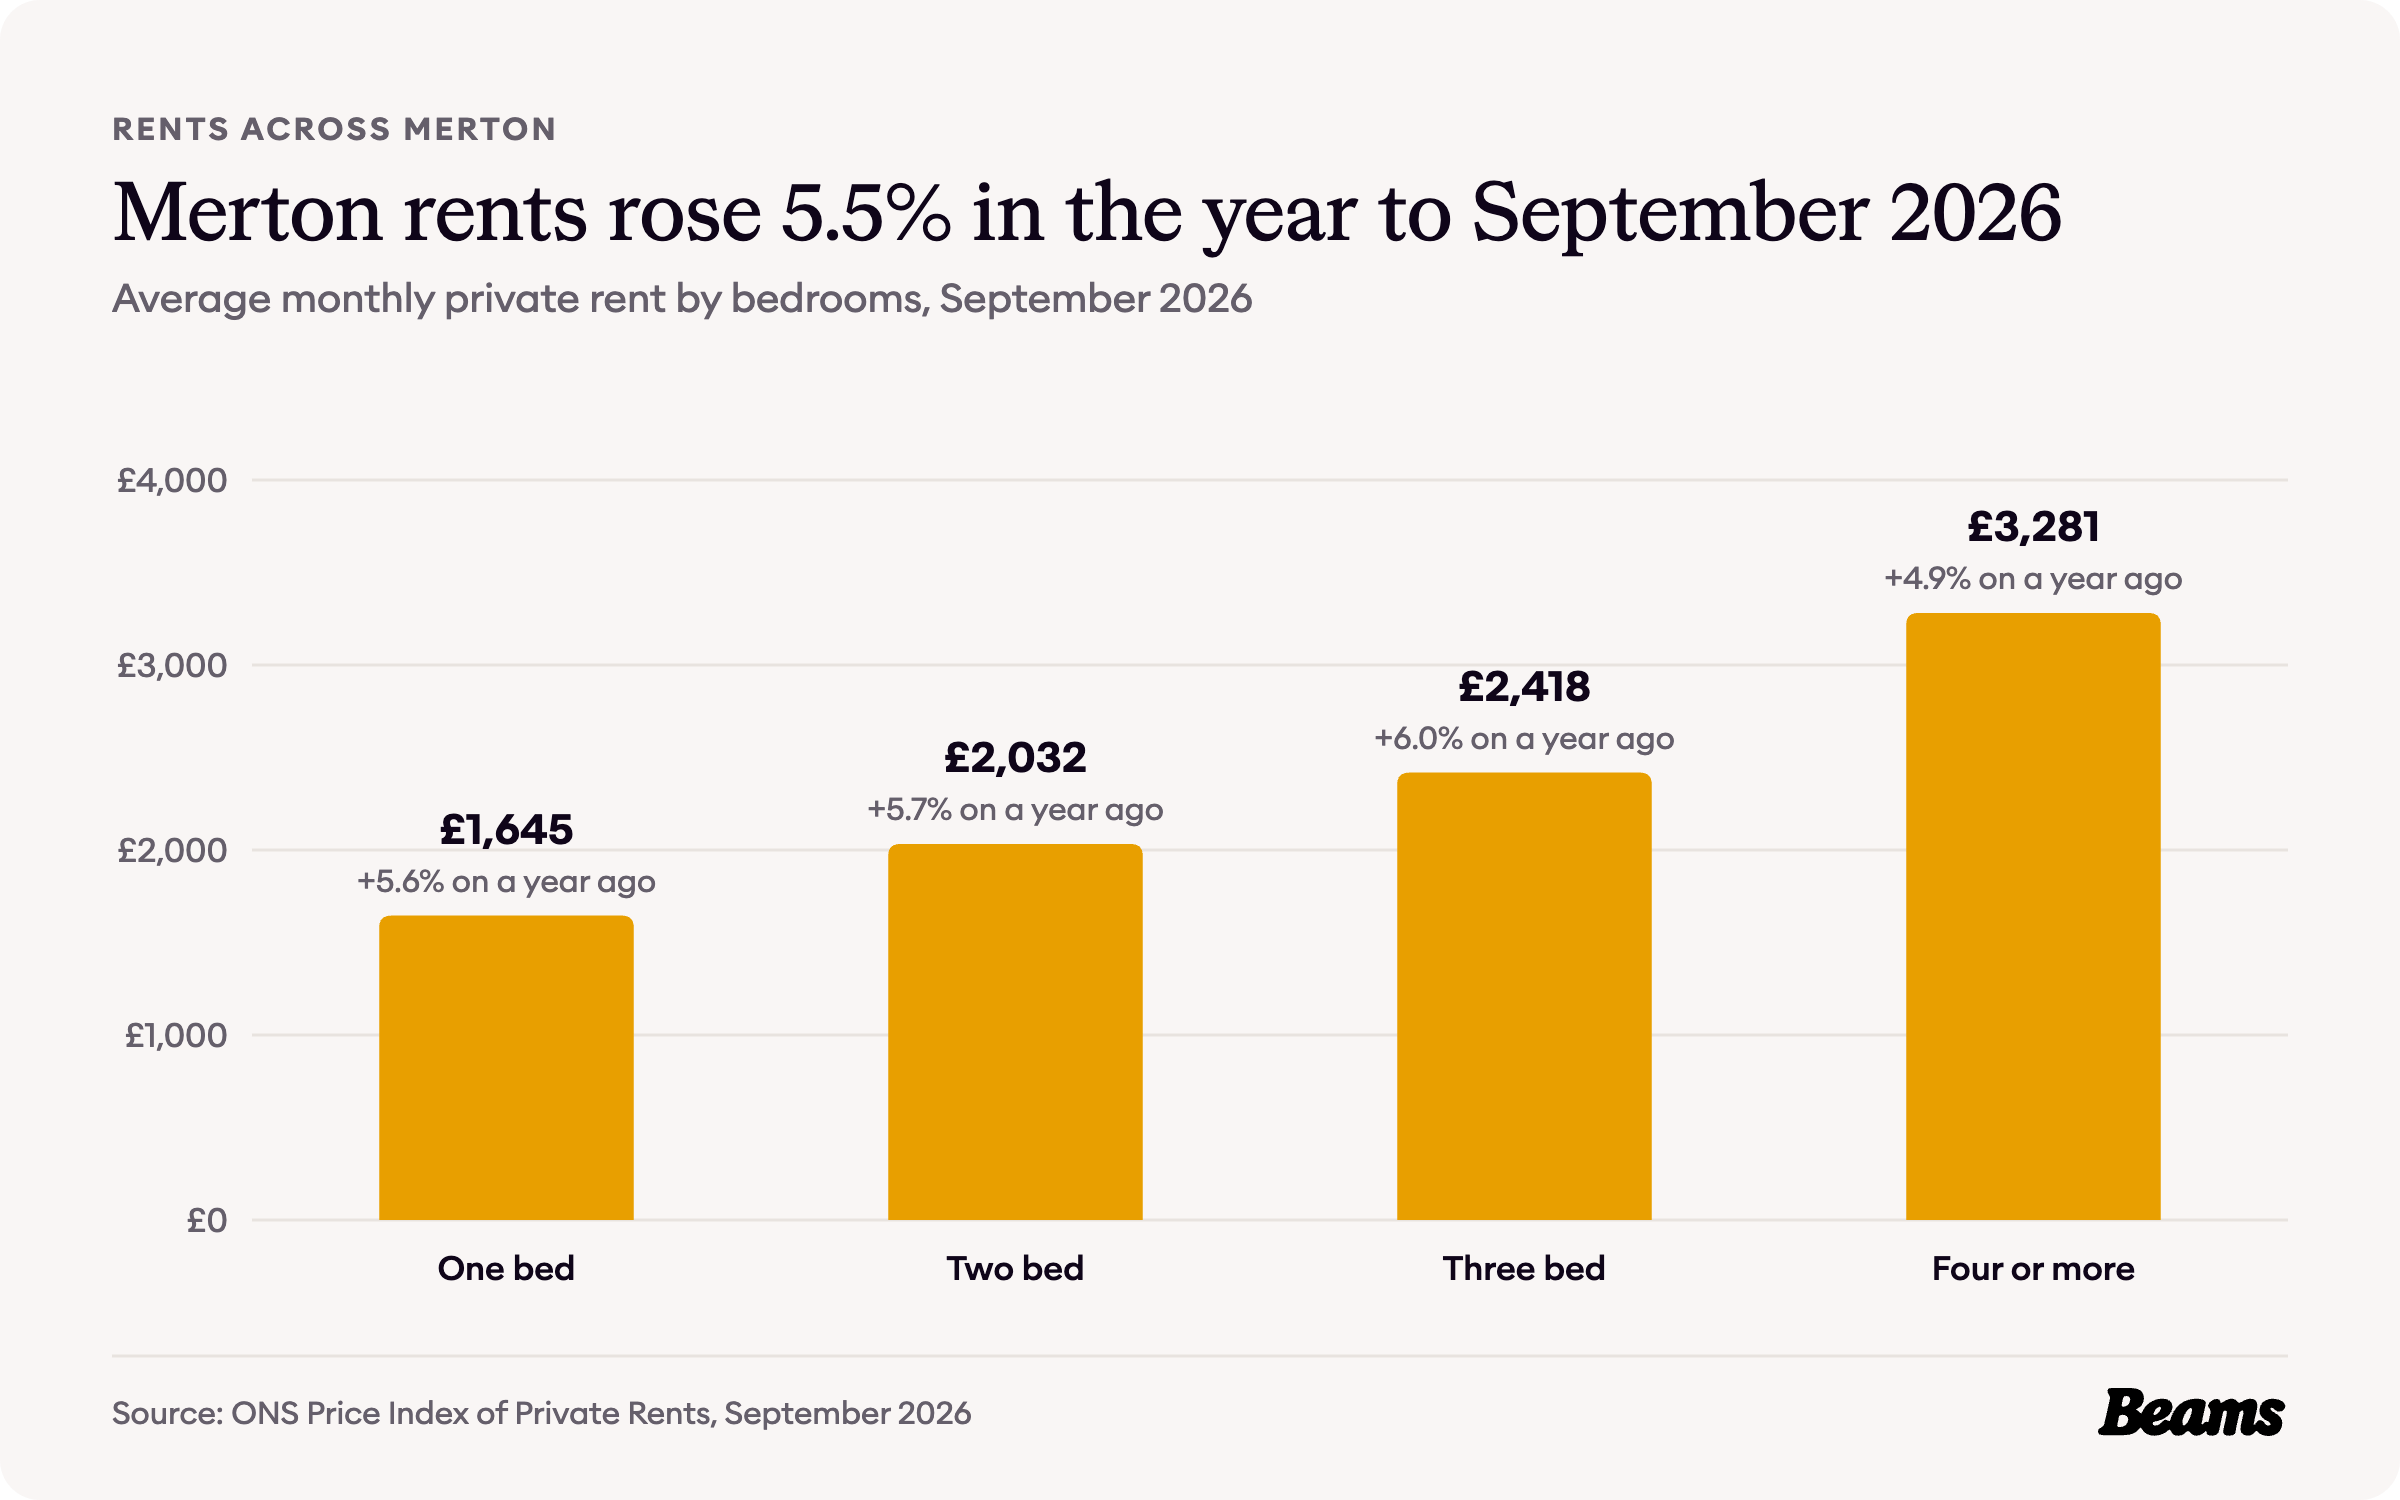
Rents are a Merton-wide figure. The average private rent in the borough was £2,181 a month in September 2026, up 5.5% from £2,066 a year earlier, a faster rise than London's 3.5% [6]. Over a similar year, the borough's average house price barely moved.
A one-bedroom home averaged £1,645 a month, a two-bedroom home £2,032, a three-bedroom home £2,418 and a home with four or more bedrooms £3,281 [6]. With 34.9% of Wimbledon households renting privately [5], that is a sizeable market for landlords keeping homes up to standard between tenancies.
Council Tax bands in Wimbledon
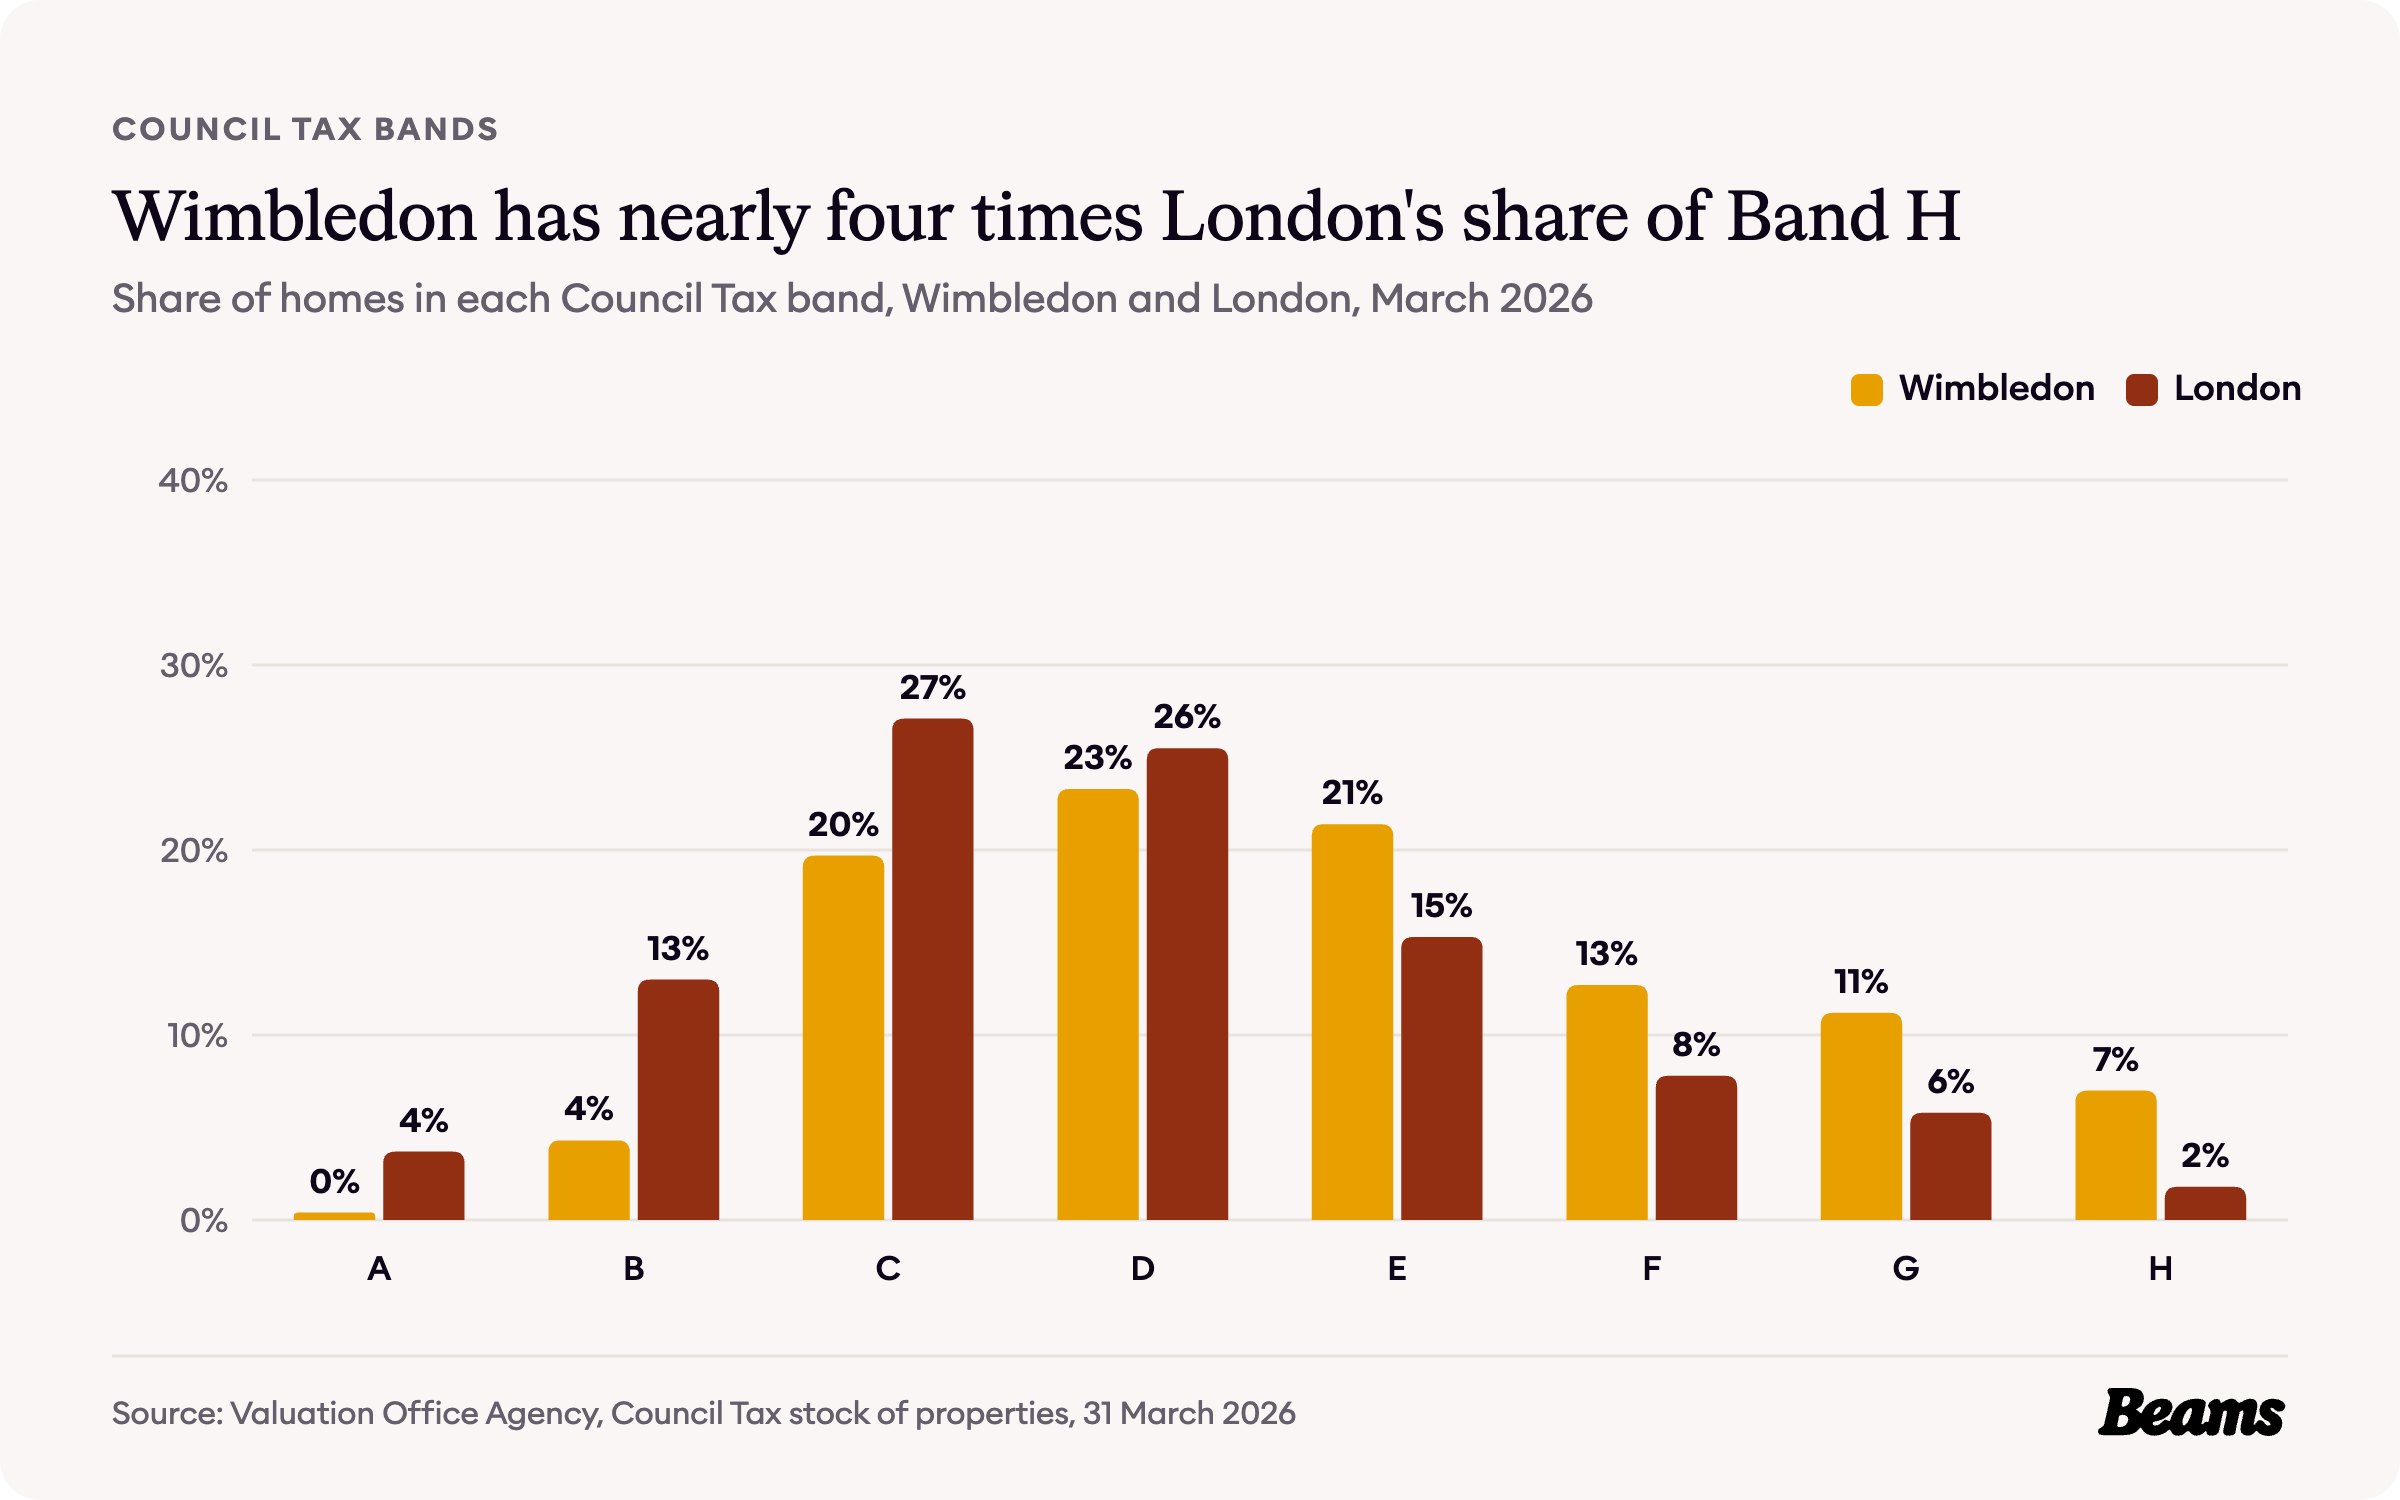
Council Tax bands give another view of the housing. In Wimbledon, 30.9% of homes sit in Bands F, G or H, against 15.4% across London. Band H, the top band, holds 7.0% of Wimbledon's homes, against 1.8% for London [2].
At the other end, only 4.7% of Wimbledon homes are in Bands A or B, against 16.7% for London [2]. In the larger period houses at the top of the scale, the rooms, ceilings and original details are often the point of the house, which is where interior design in Wimbledon earns its place.
The rules on your street
Merton Council lists 28 conservation areas, and seven carry Wimbledon's name: Wimbledon Village, Wimbledon North, Wimbledon West, Wimbledon Hill Road, Wimbledon Broadway, Wimbledon Chase and Wimbledon Windmill [9].
The council says a conservation area may bring extra planning controls to protect its local character [10]. Its planning pages add that permitted development is restricted there for some types of work, and that a Design and Access Statement, which a householder application elsewhere does not need, can be required inside one [4]. Digging down is one of the bigger changes a street can see, so a basement conversion in Wimbledon starts with a check of the address.
Merton's Article 4 directions, which mean you must apply for planning permission for the changes they list, are in the John Innes Merton Park and John Innes Wilton Crescent conservation areas, and the council has a map to check whether a property is covered [10].
Merton's application pages do not give a decision time, so the national rule applies: once an application is valid, a council should decide anything other than major development within eight weeks, unless a longer period is agreed in writing [11]. With more than half of Wimbledon's homes built before 1919, our builders in Wimbledon and planners check what applies to your address before any work begins.
Wimbledon housing statistics at a glance
- Median sale price, SW19, October 2025 to September 2026: £590,000 [8]
- Average house price, Merton, August 2026: £623,791 (London £554,430) [6] [7]
- Change on a year earlier, Merton: +0.1% (London -2.2%) [6] [7]
- Average terraced house, Merton: £696,630 (London £648,650) [6] [7]
- Average private rent, Merton, September 2026: £2,181 a month, up 5.5% (London up 3.5%) [6]
- Homes built before 1919: 51.2% (London 29.0%) [2]
- Households living in a house: 51.3% (London 46.0%) [3]
- Households who own their home: 55.3% (London 45.2%) [5]
- Homes in Council Tax Bands F to H: 30.9% (London 15.4%) [2]
- Conservation areas in Merton: 28 [9]
Frequently asked questions
References
- British History Online, Parishes: Wimbledon. Victoria County History of Surrey, volume 4, published 1912.
- Valuation Office Agency, Council Tax: stock of properties 2026. Tables CTSOP4.1 and CTSOP1.1, properties by build period and by Council Tax band at 31 March 2026, Wimbledon's six census areas and London.
- ONS, Census 2021 table TS044: Accommodation type. Households by type of home, Wimbledon's six census areas and London.
- Merton Council, Apply for planning permission. Permitted development, conservation areas and Design and Access Statements. Accessed 29 October 2026.
- ONS, Census 2021 table TS054: Tenure. Households by tenure, Wimbledon's six census areas and London.
- ONS, Housing prices in Merton. UK House Price Index for August 2026 and Price Index of Private Rents for September 2026, published 21 October 2026.
- HM Land Registry, UK House Price Index. Average prices for Merton, London and England, August 2006 to August 2026.
- HM Land Registry, Price Paid Data. Sales in the SW19 postcode district, October 2025 to September 2026.
- Merton Council, List of conservation areas. Accessed 29 October 2026.
- Merton Council, Conservation areas. Extra planning controls and the John Innes Article 4 directions. Accessed 29 October 2026.
- GOV.UK, Determining a planning application. Planning practice guidance on statutory time limits, paragraph 001.
Thinking of improving rather than moving?
Tell us about your Wimbledon home and what you want to change. We'll give you a free estimate, then up to three vetted builders quote against the same specification.