
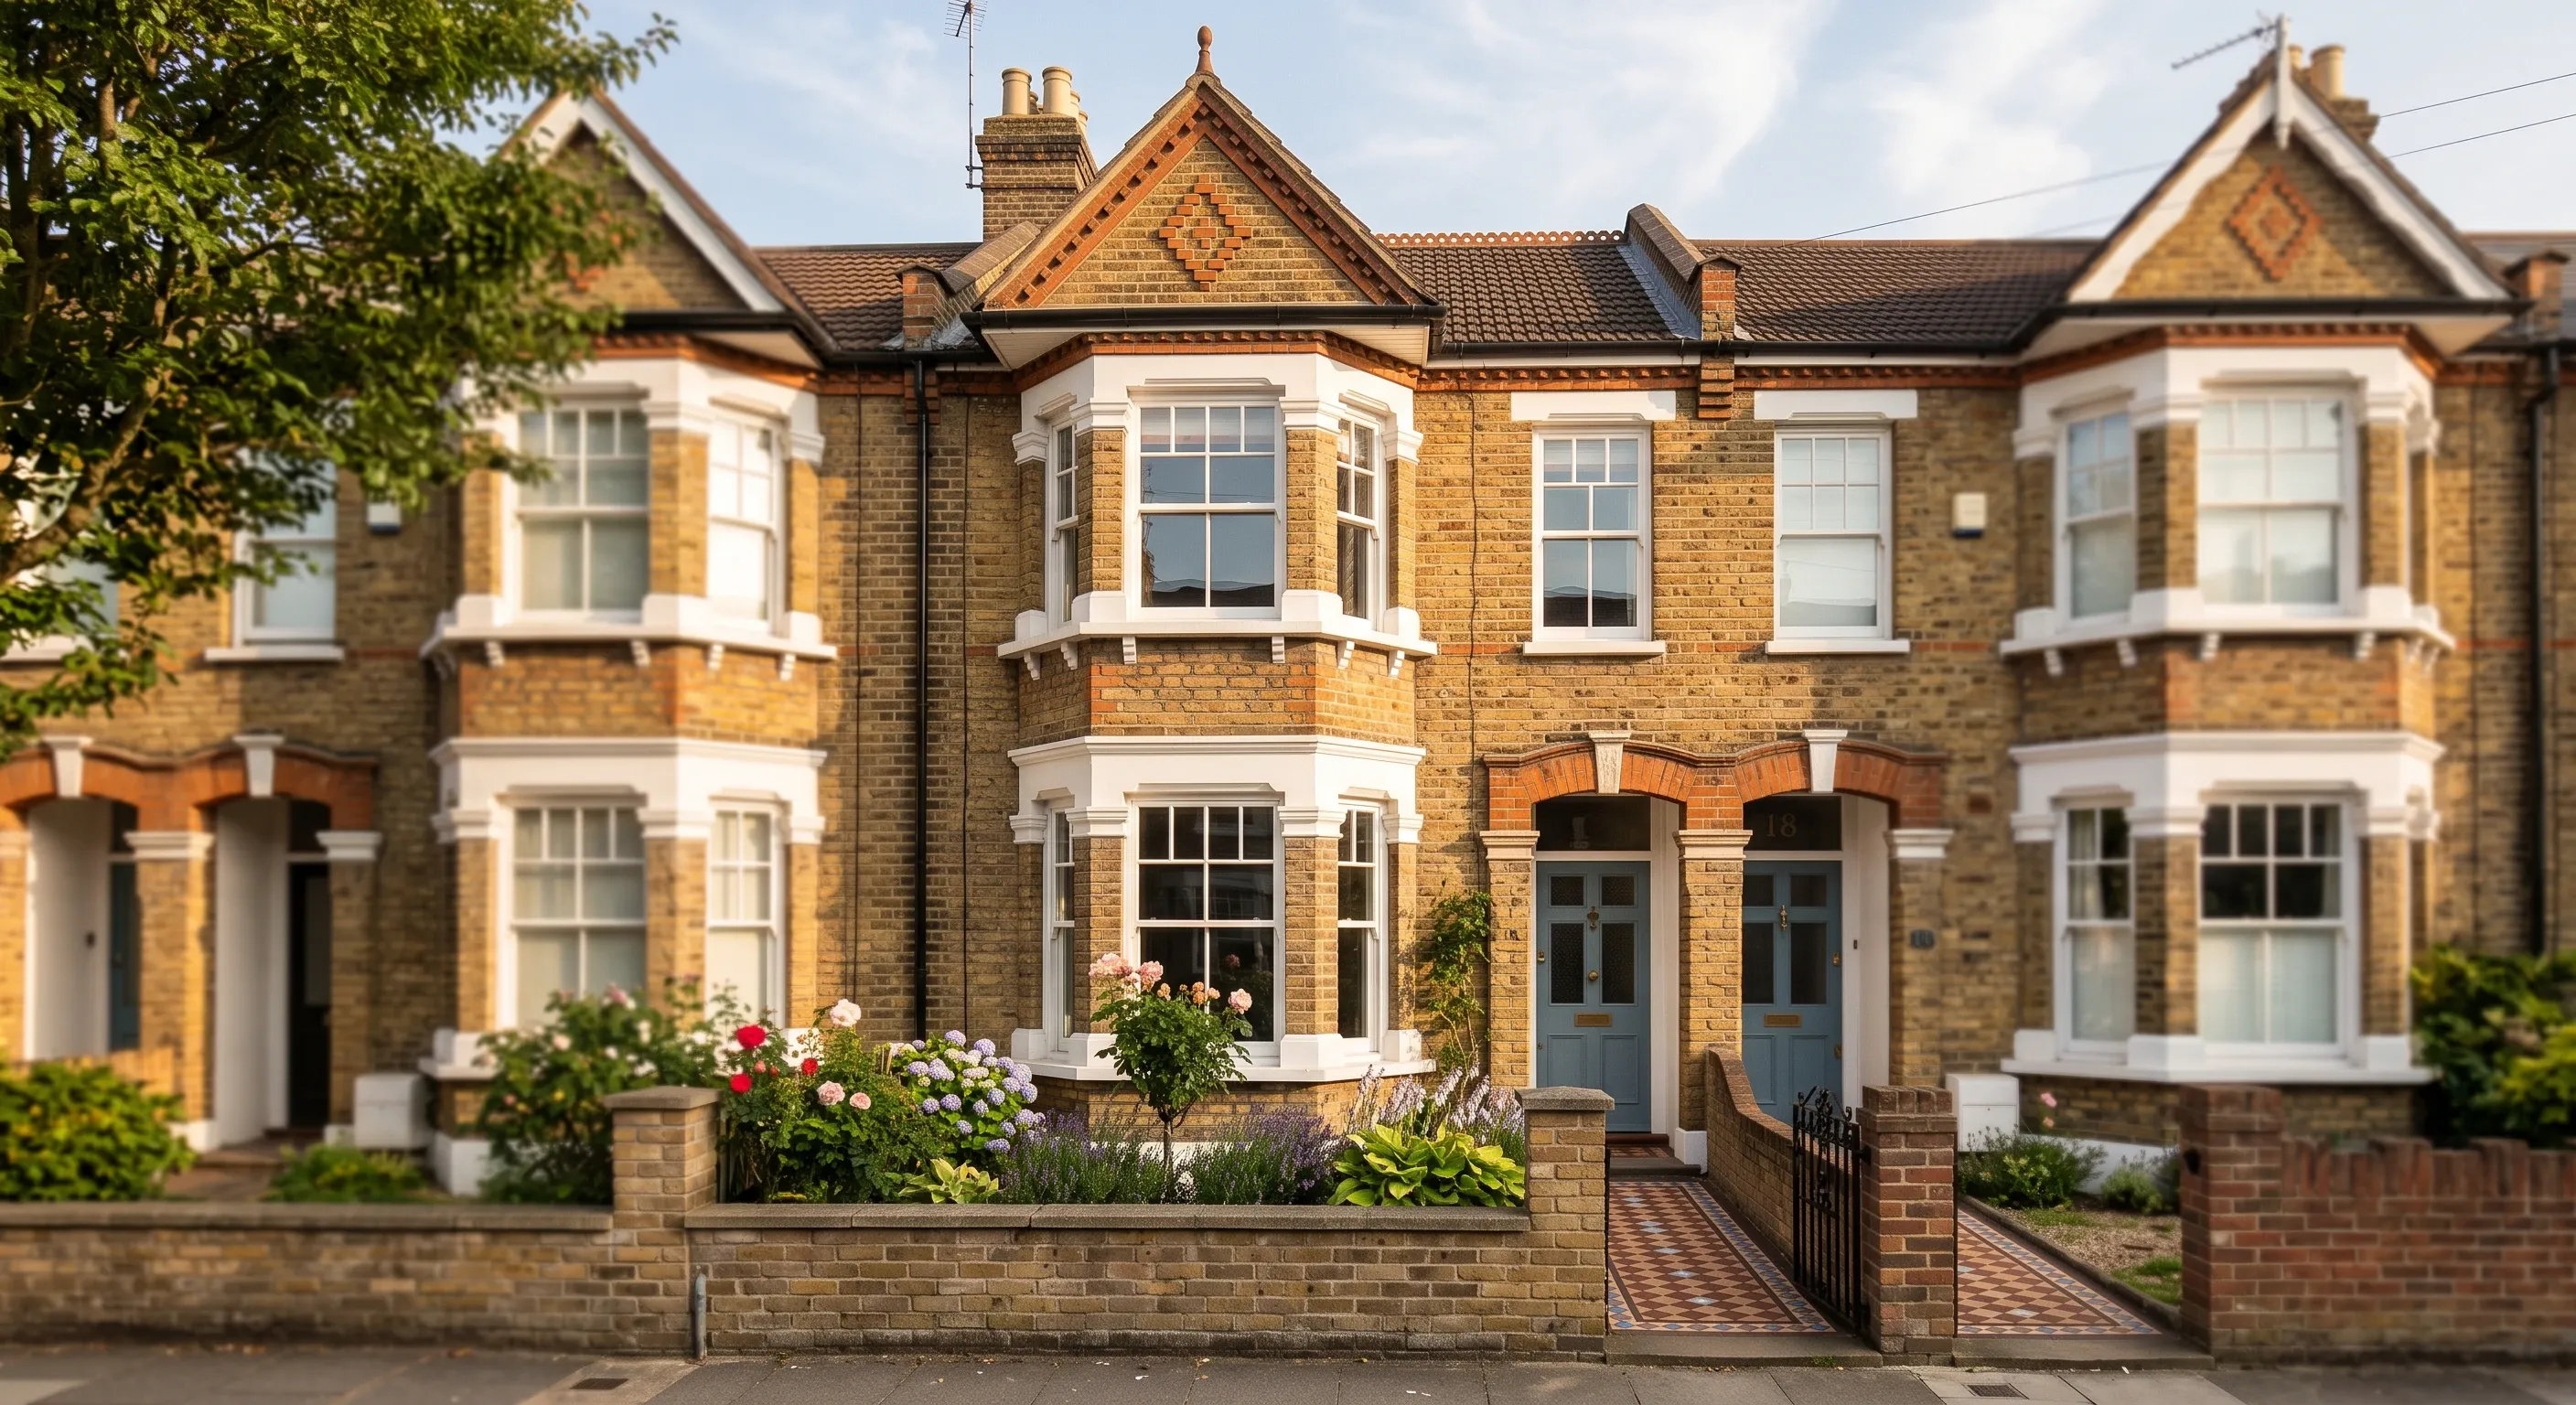
Walthamstow housing statistics 2026
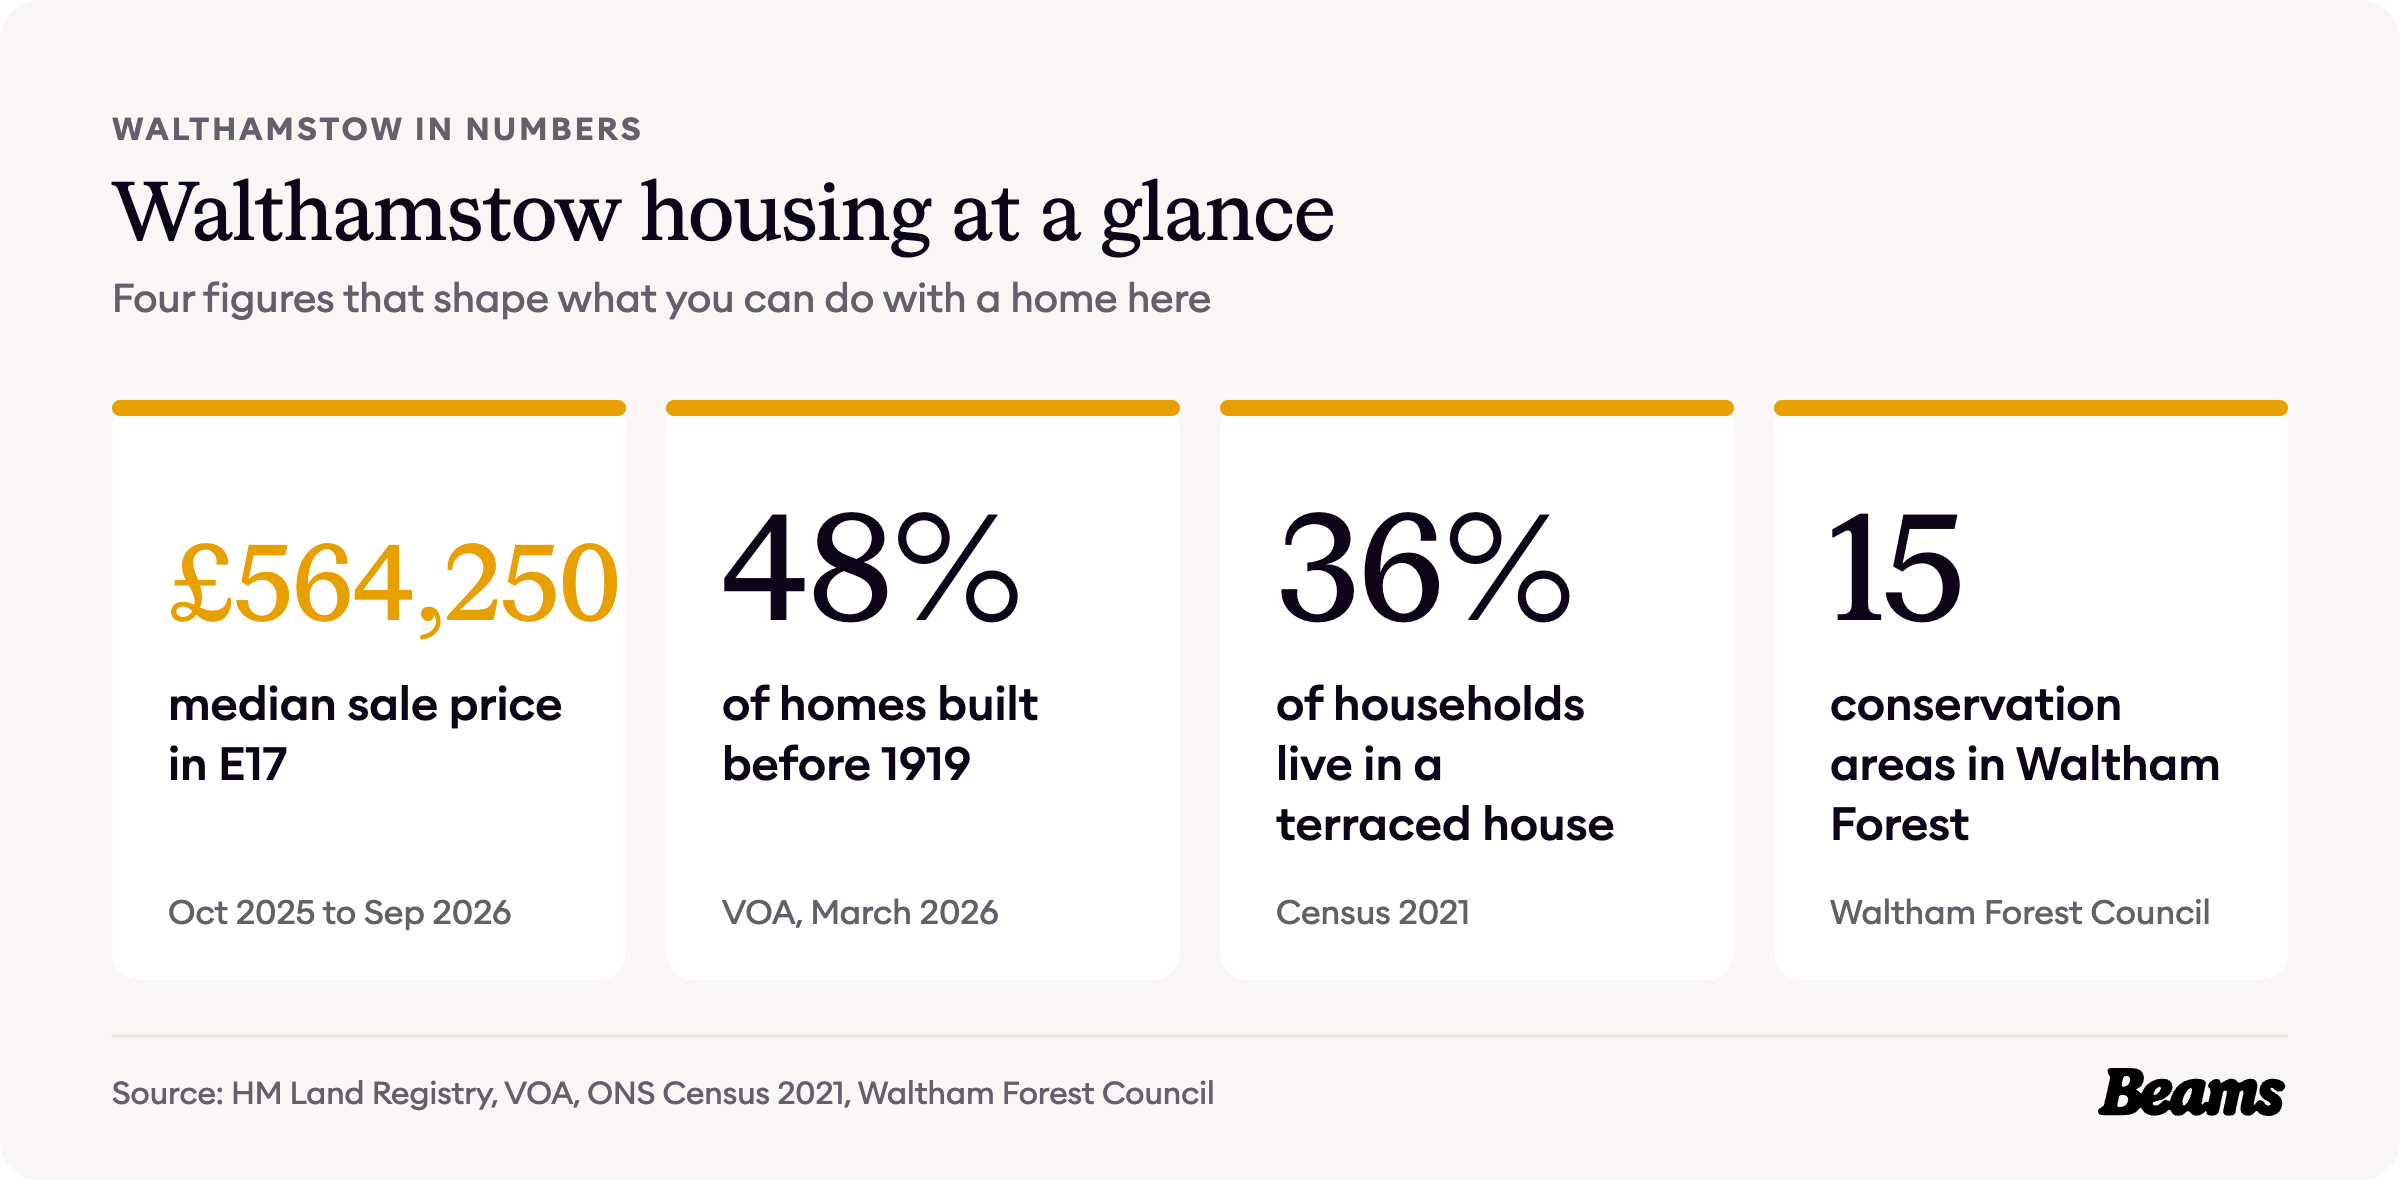
Walthamstow is a town of long terraces. Once the railway to Chingford was finished in the early 1870s, builders such as the Warner Estate Company put up street after street of two-storey houses, and more than a third of Walthamstow households still live in a terraced house. These are the numbers behind that story, from the Warner terraces to today's £564,250 median sale price in E17.
Every figure comes from an official source and is dated, so you can see exactly what you are working with before you plan a home renovation in Walthamstow. The sources are numbered in brackets and listed in full at the end of the page.
How Walthamstow was built
Walthamstow had 4,959 people in 1851 and 11,092 in 1871. The completion of the railway to Hale End and Chingford between 1870 and 1873 brought a wave of new building, and by 1901 the population had reached 95,131. It went on rising to a census peak of 132,972 in 1931 [1].
From 1870 to 1914 the most common new home was the long terrace of two-storey houses, slate-roofed and built of yellow brick, and south of Forest Road many were designed for two families as flats. The Warner Estate Company, registered in 1891, had its own building department, and its terraces often bear the mark 'W'. Between 1912 and 1914 it laid out an estate of some 300 houses on garden-city lines between Billet Road and Pennant Terrace [1].
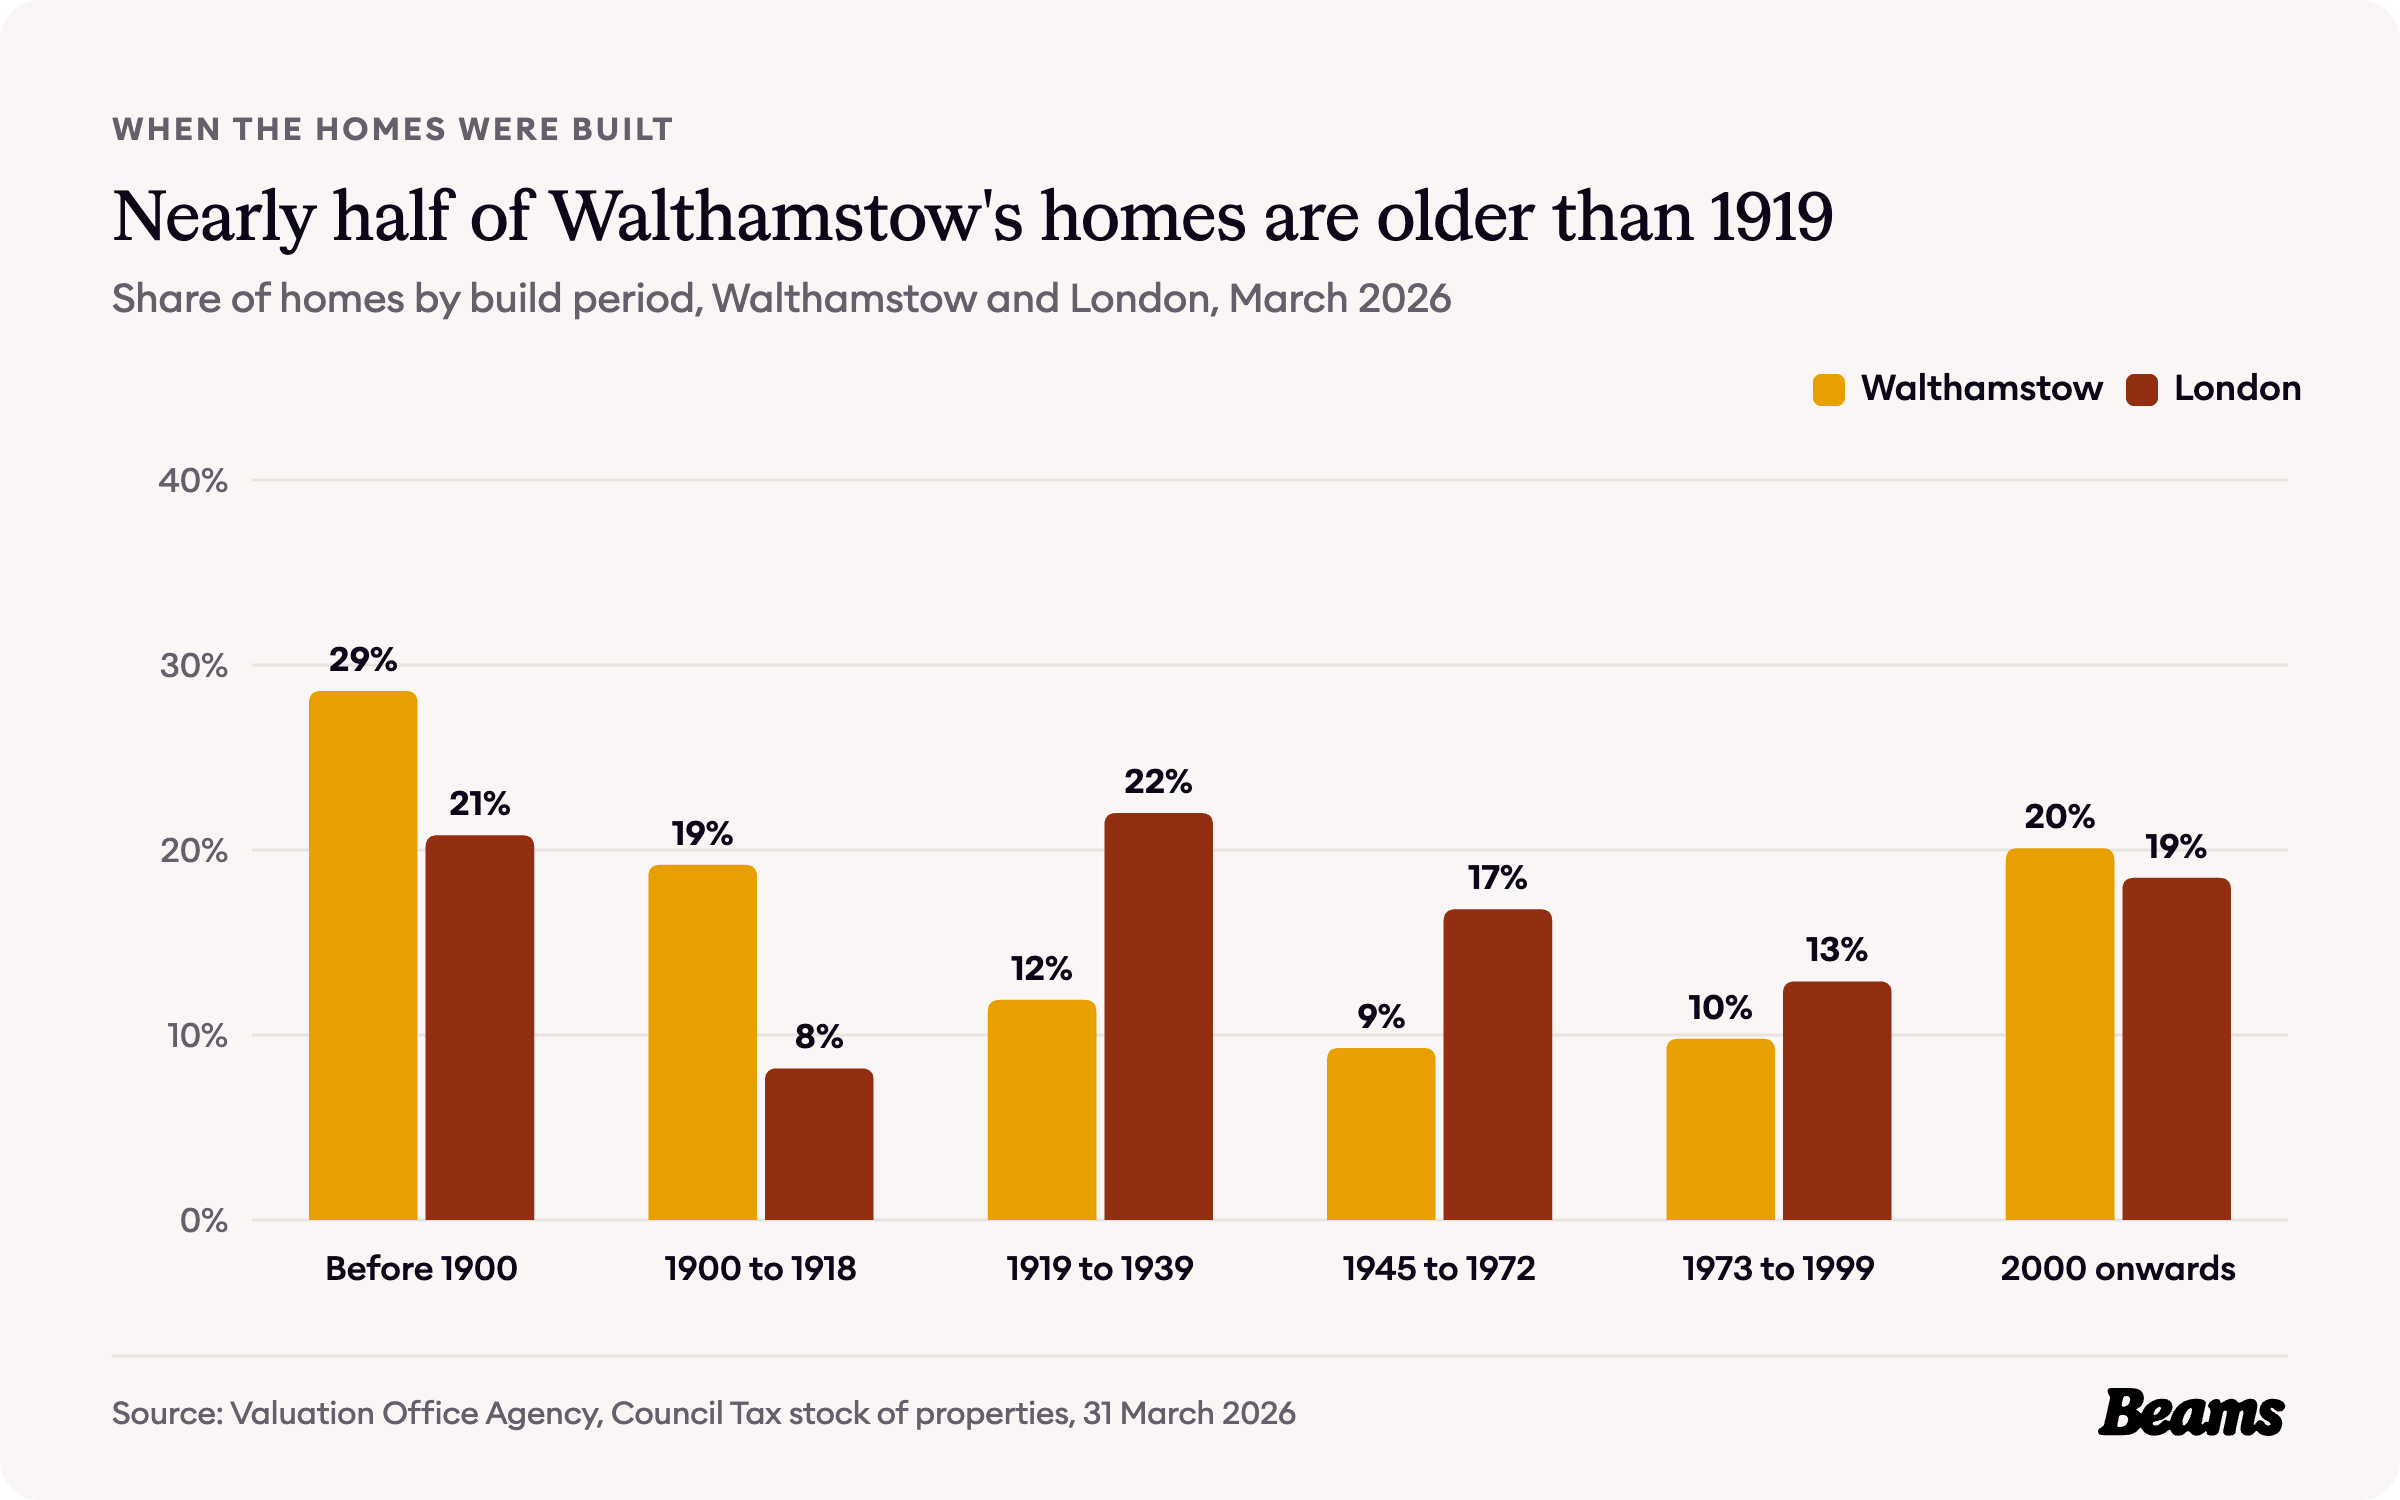
The Valuation Office Agency counts 44,110 homes across Walthamstow's ten census areas: Higham Hill, Fulbourne Road and Walthamstow Forest, Lloyd Park, William Morris, Wood Street, Blackhorse Road, Upper Walthamstow, Walthamstow Central, Walthamstow Market and South Grove, and Markhouse and St James Park. Of those, 28.6% were built before 1900 and 19.2% between 1900 and 1918, so 47.8% are older than 1919, against 29.0% for London [2].
Walthamstow has kept building, too: 20.1% of its homes date from 2000 or later, above London's 18.5%, while the years from 1919 to 1999 account for only 31.0%, against 51.7% for London [2]. For those long two-storey terraces, a loft conversion in Walthamstow is the usual way to add a bedroom without giving up any garden.
How Walthamstow households live
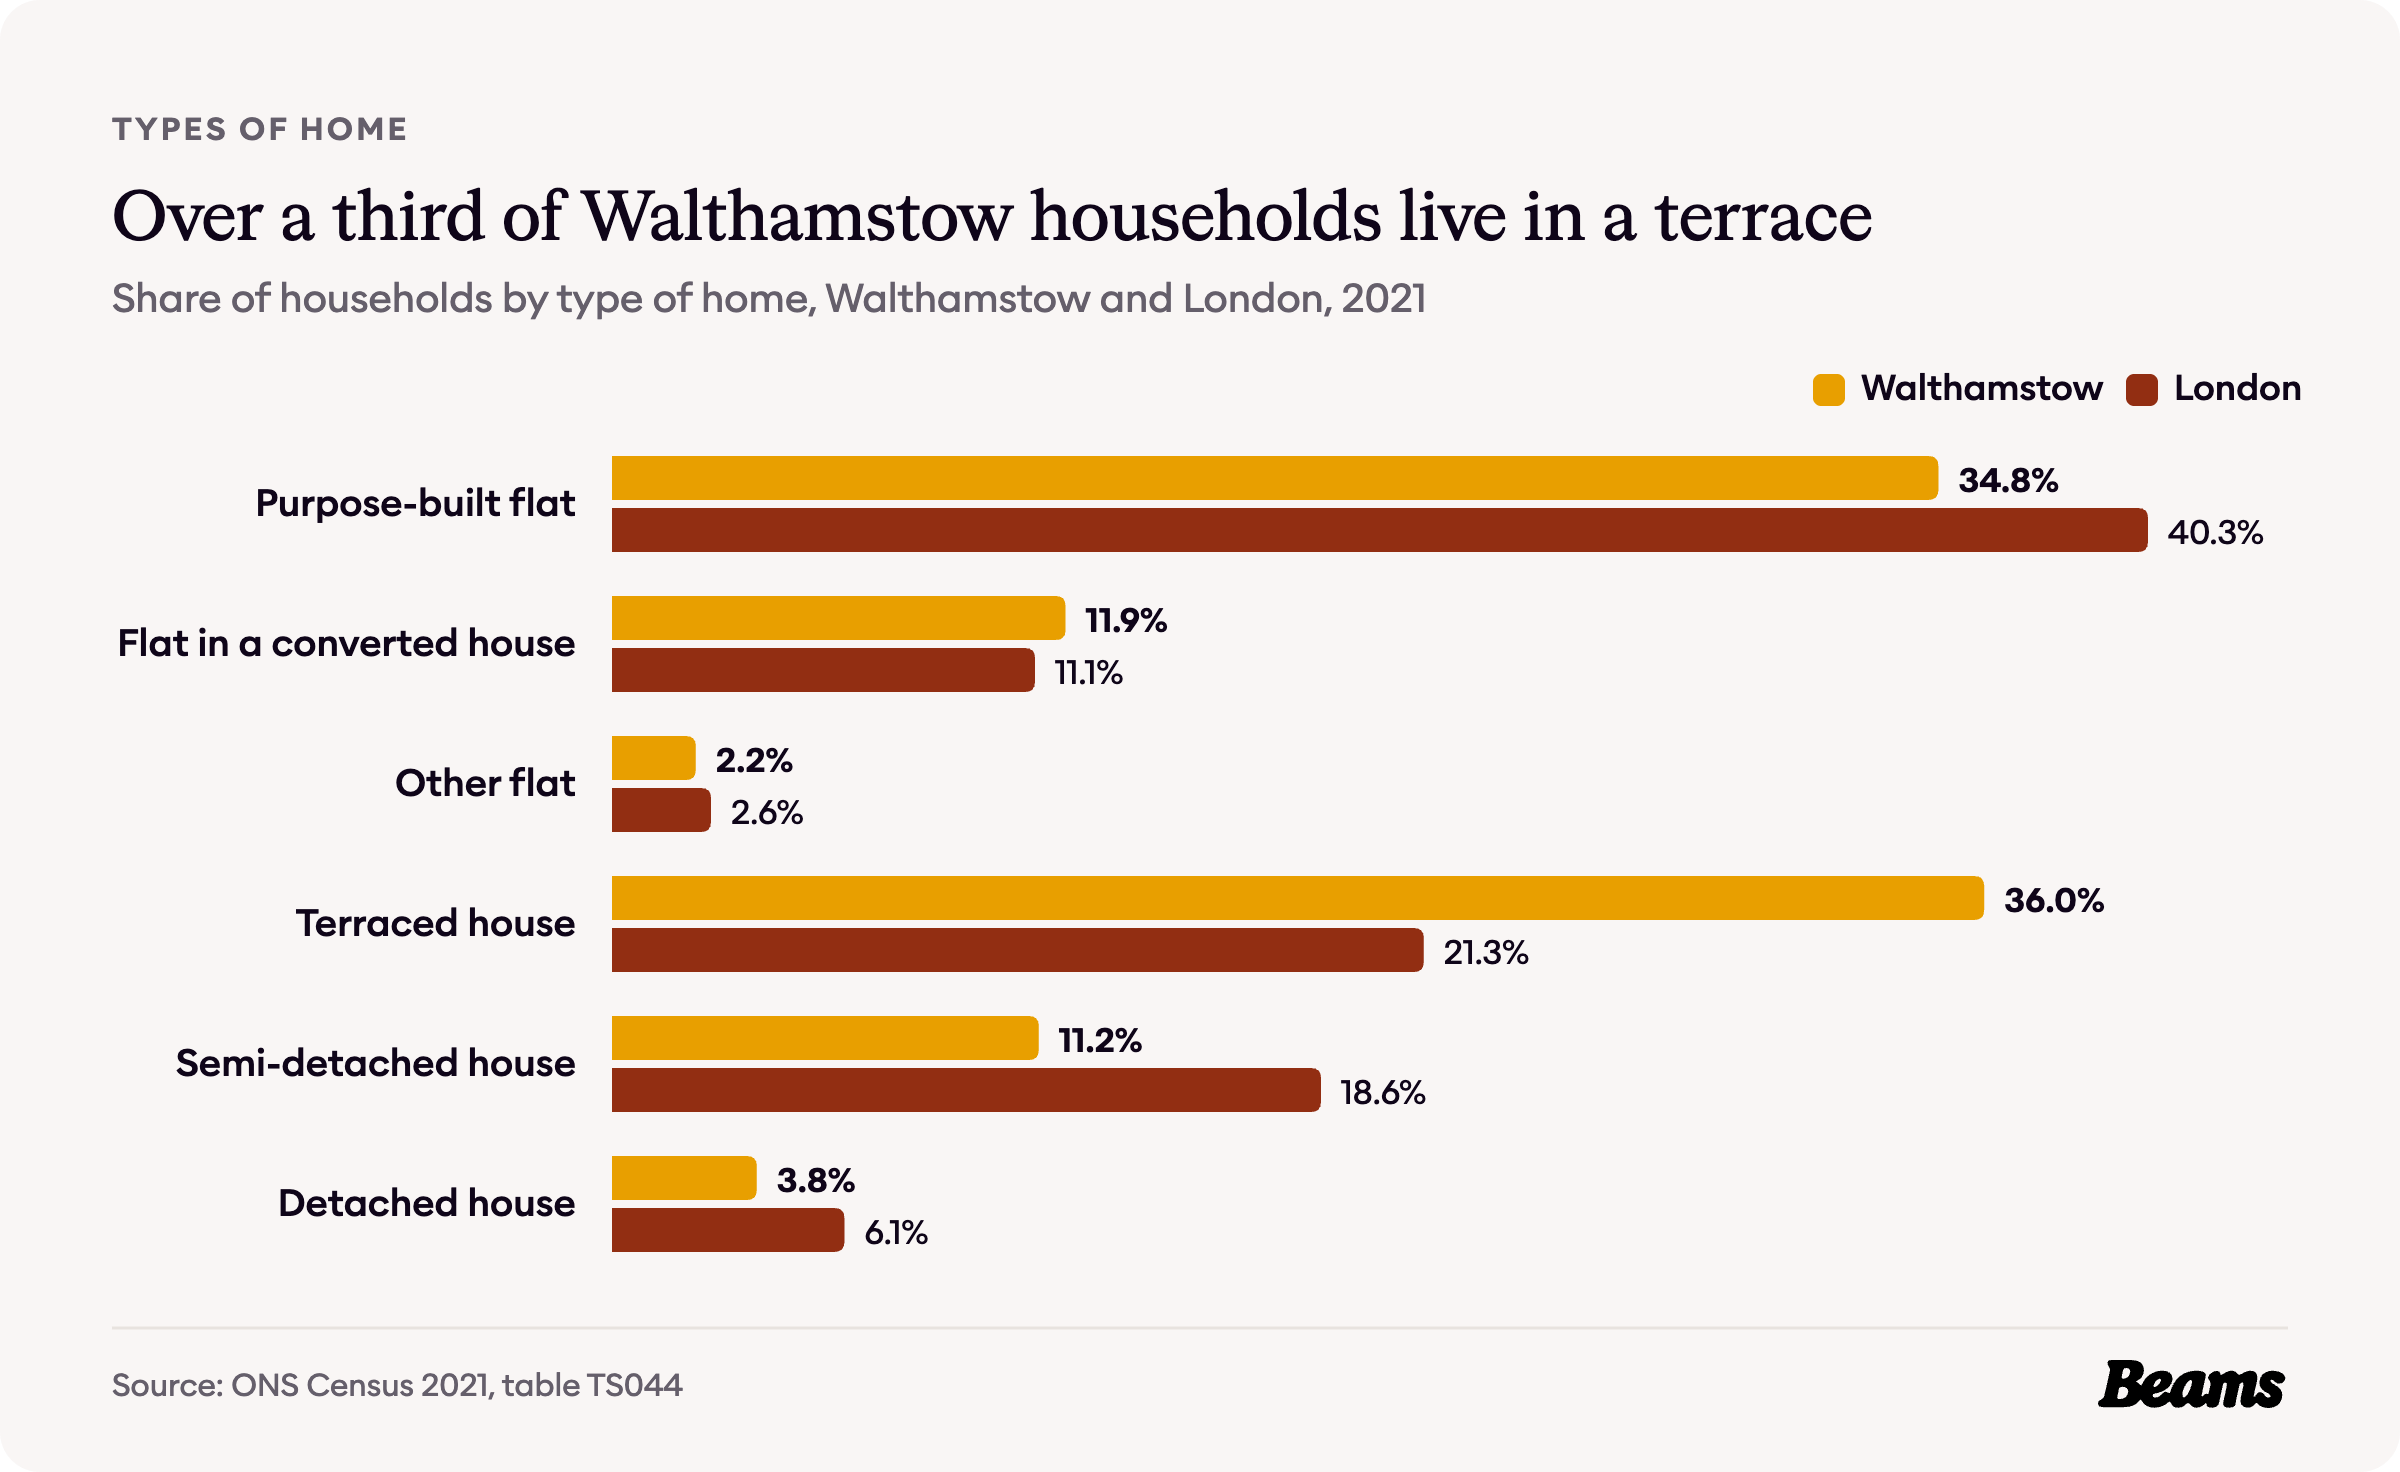
In Walthamstow, houses still outnumber flats. The 2021 Census found 51.0% of its 39,227 households living in a house, against 46.0% across London, and 36.0% in a terraced house, against 21.3% [3].
Another 34.8% live in a purpose-built flat, below London's 40.3%, and 11.9% in a flat in a converted house, close to London's 11.1% [3]. With more than a third of households in a terrace, where the kitchen usually sits at the back beside the garden, a kitchen renovation in Walthamstow often goes hand in hand with opening up the rear of the house.
Who owns Walthamstow's homes
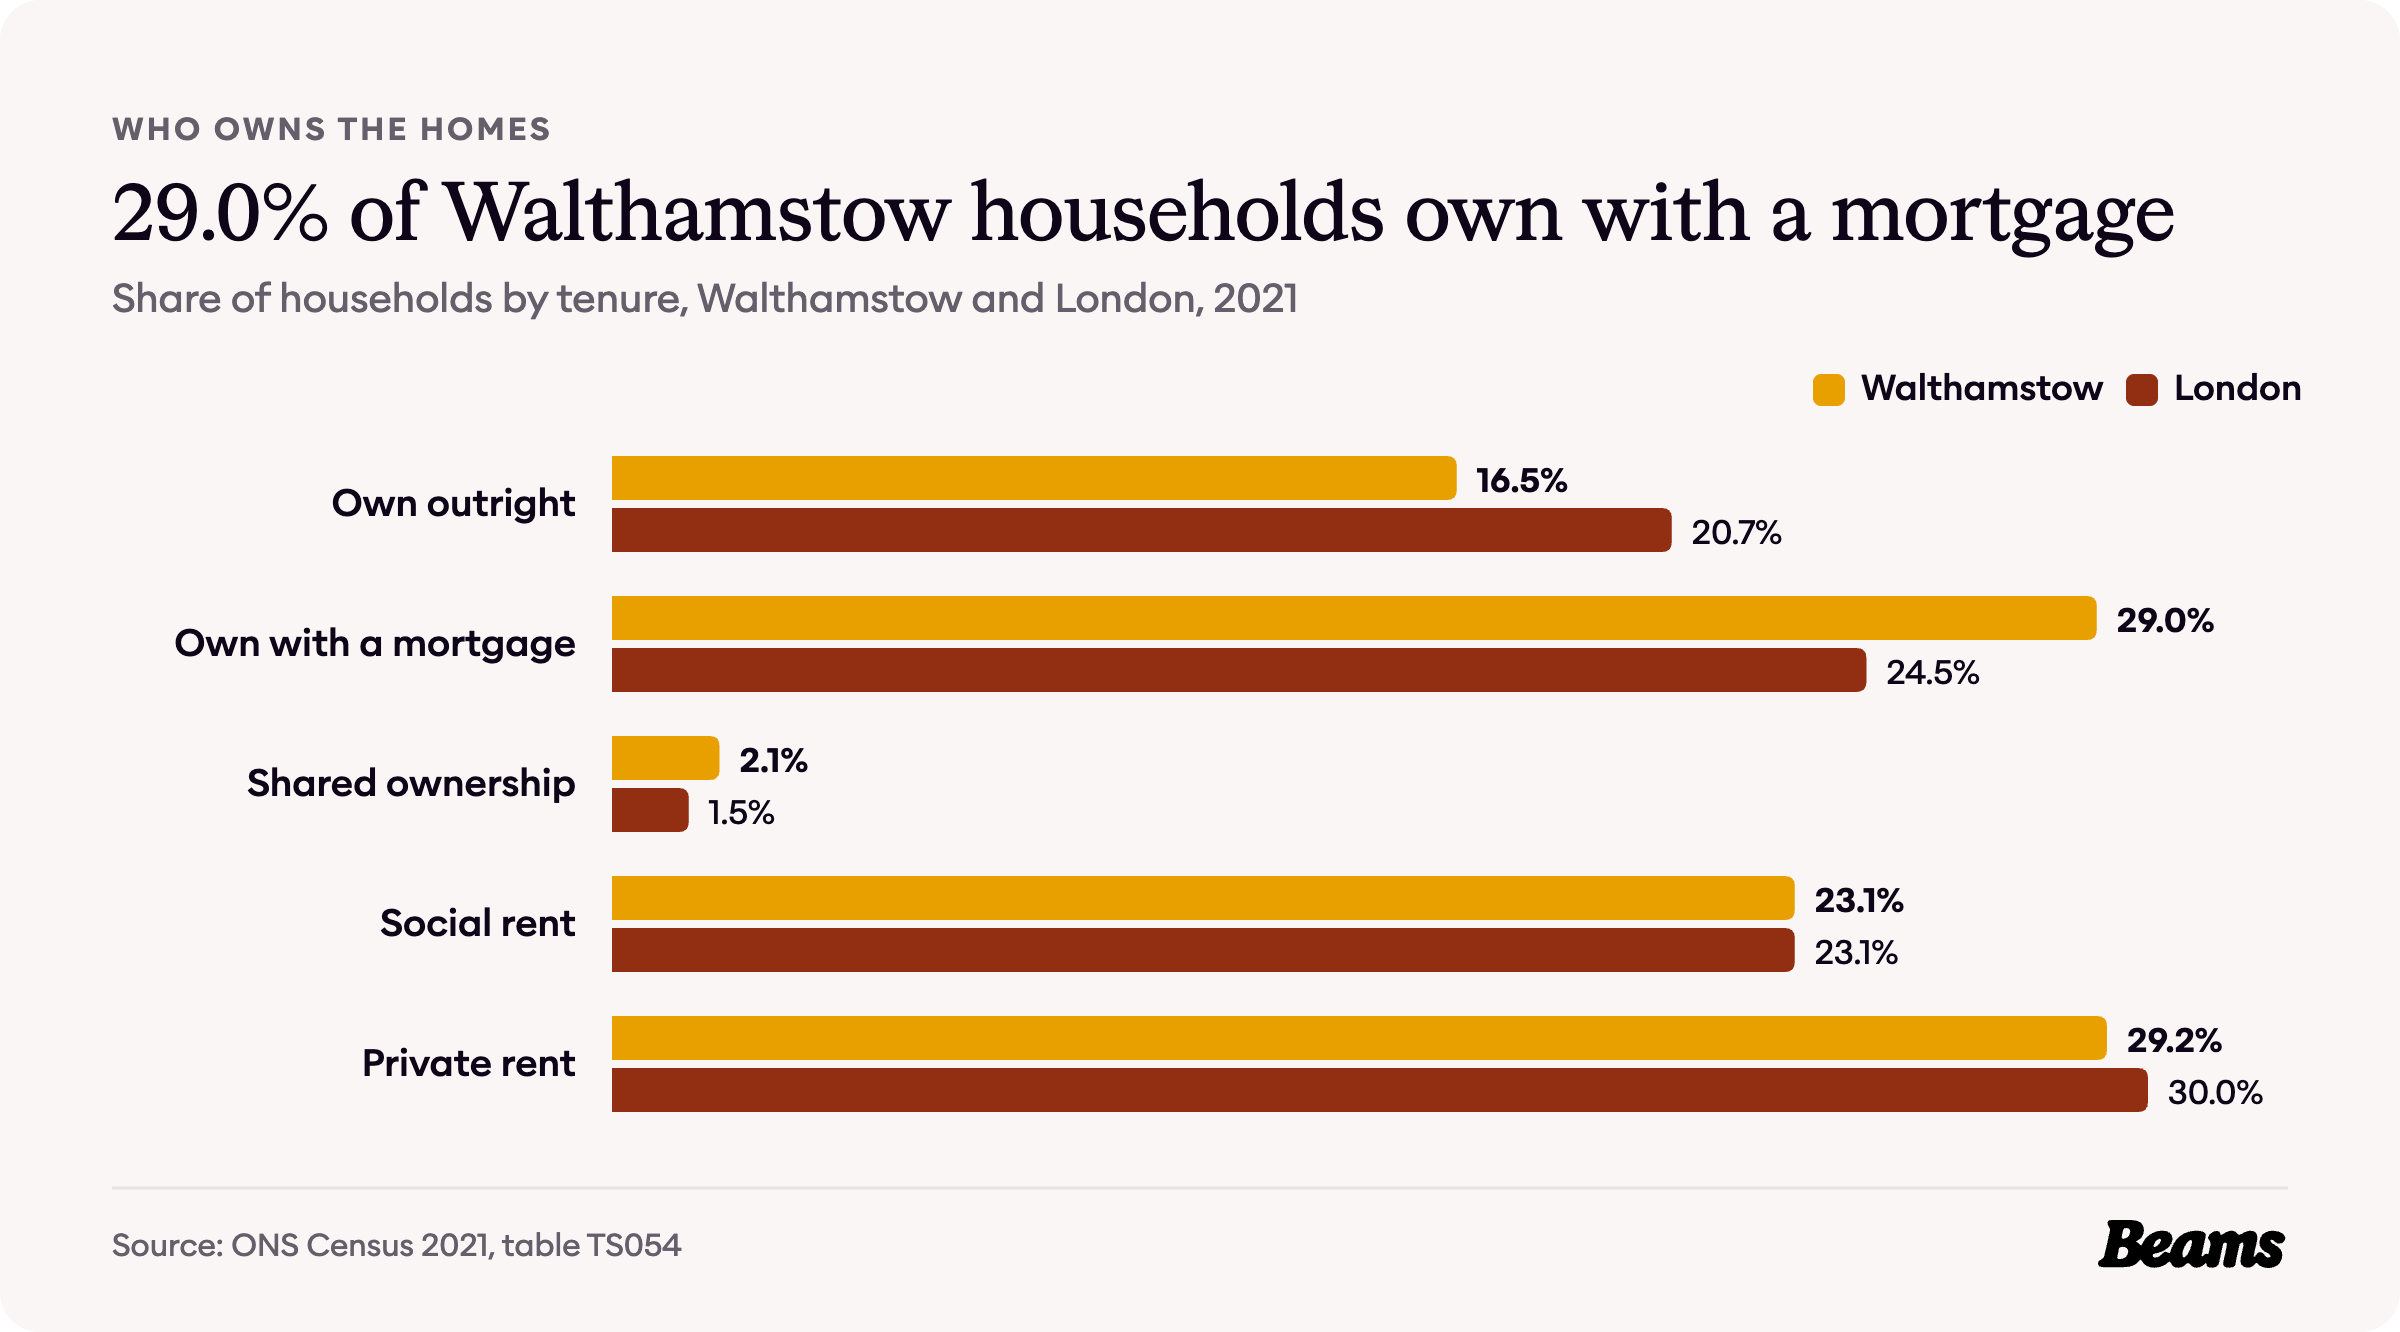
Home ownership in Walthamstow runs at almost exactly the London rate: 45.5% of households own their home, against 45.2% across London. More of them are still paying off a mortgage, though, at 29.0% against 24.5%, and fewer own outright, at 16.5% against 20.7% [4].
Social renting accounts for 23.1% of households, the same as the London figure, and private renting for 29.2%, against 30.0% [4].
What a home costs in Walthamstow
The UK House Price Index and the rent figures are only published for whole boroughs, so on this page they cover all of Waltham Forest. The census and Valuation Office figures cover Walthamstow's ten census areas named above, and the local sale prices cover the E17 postcode district.
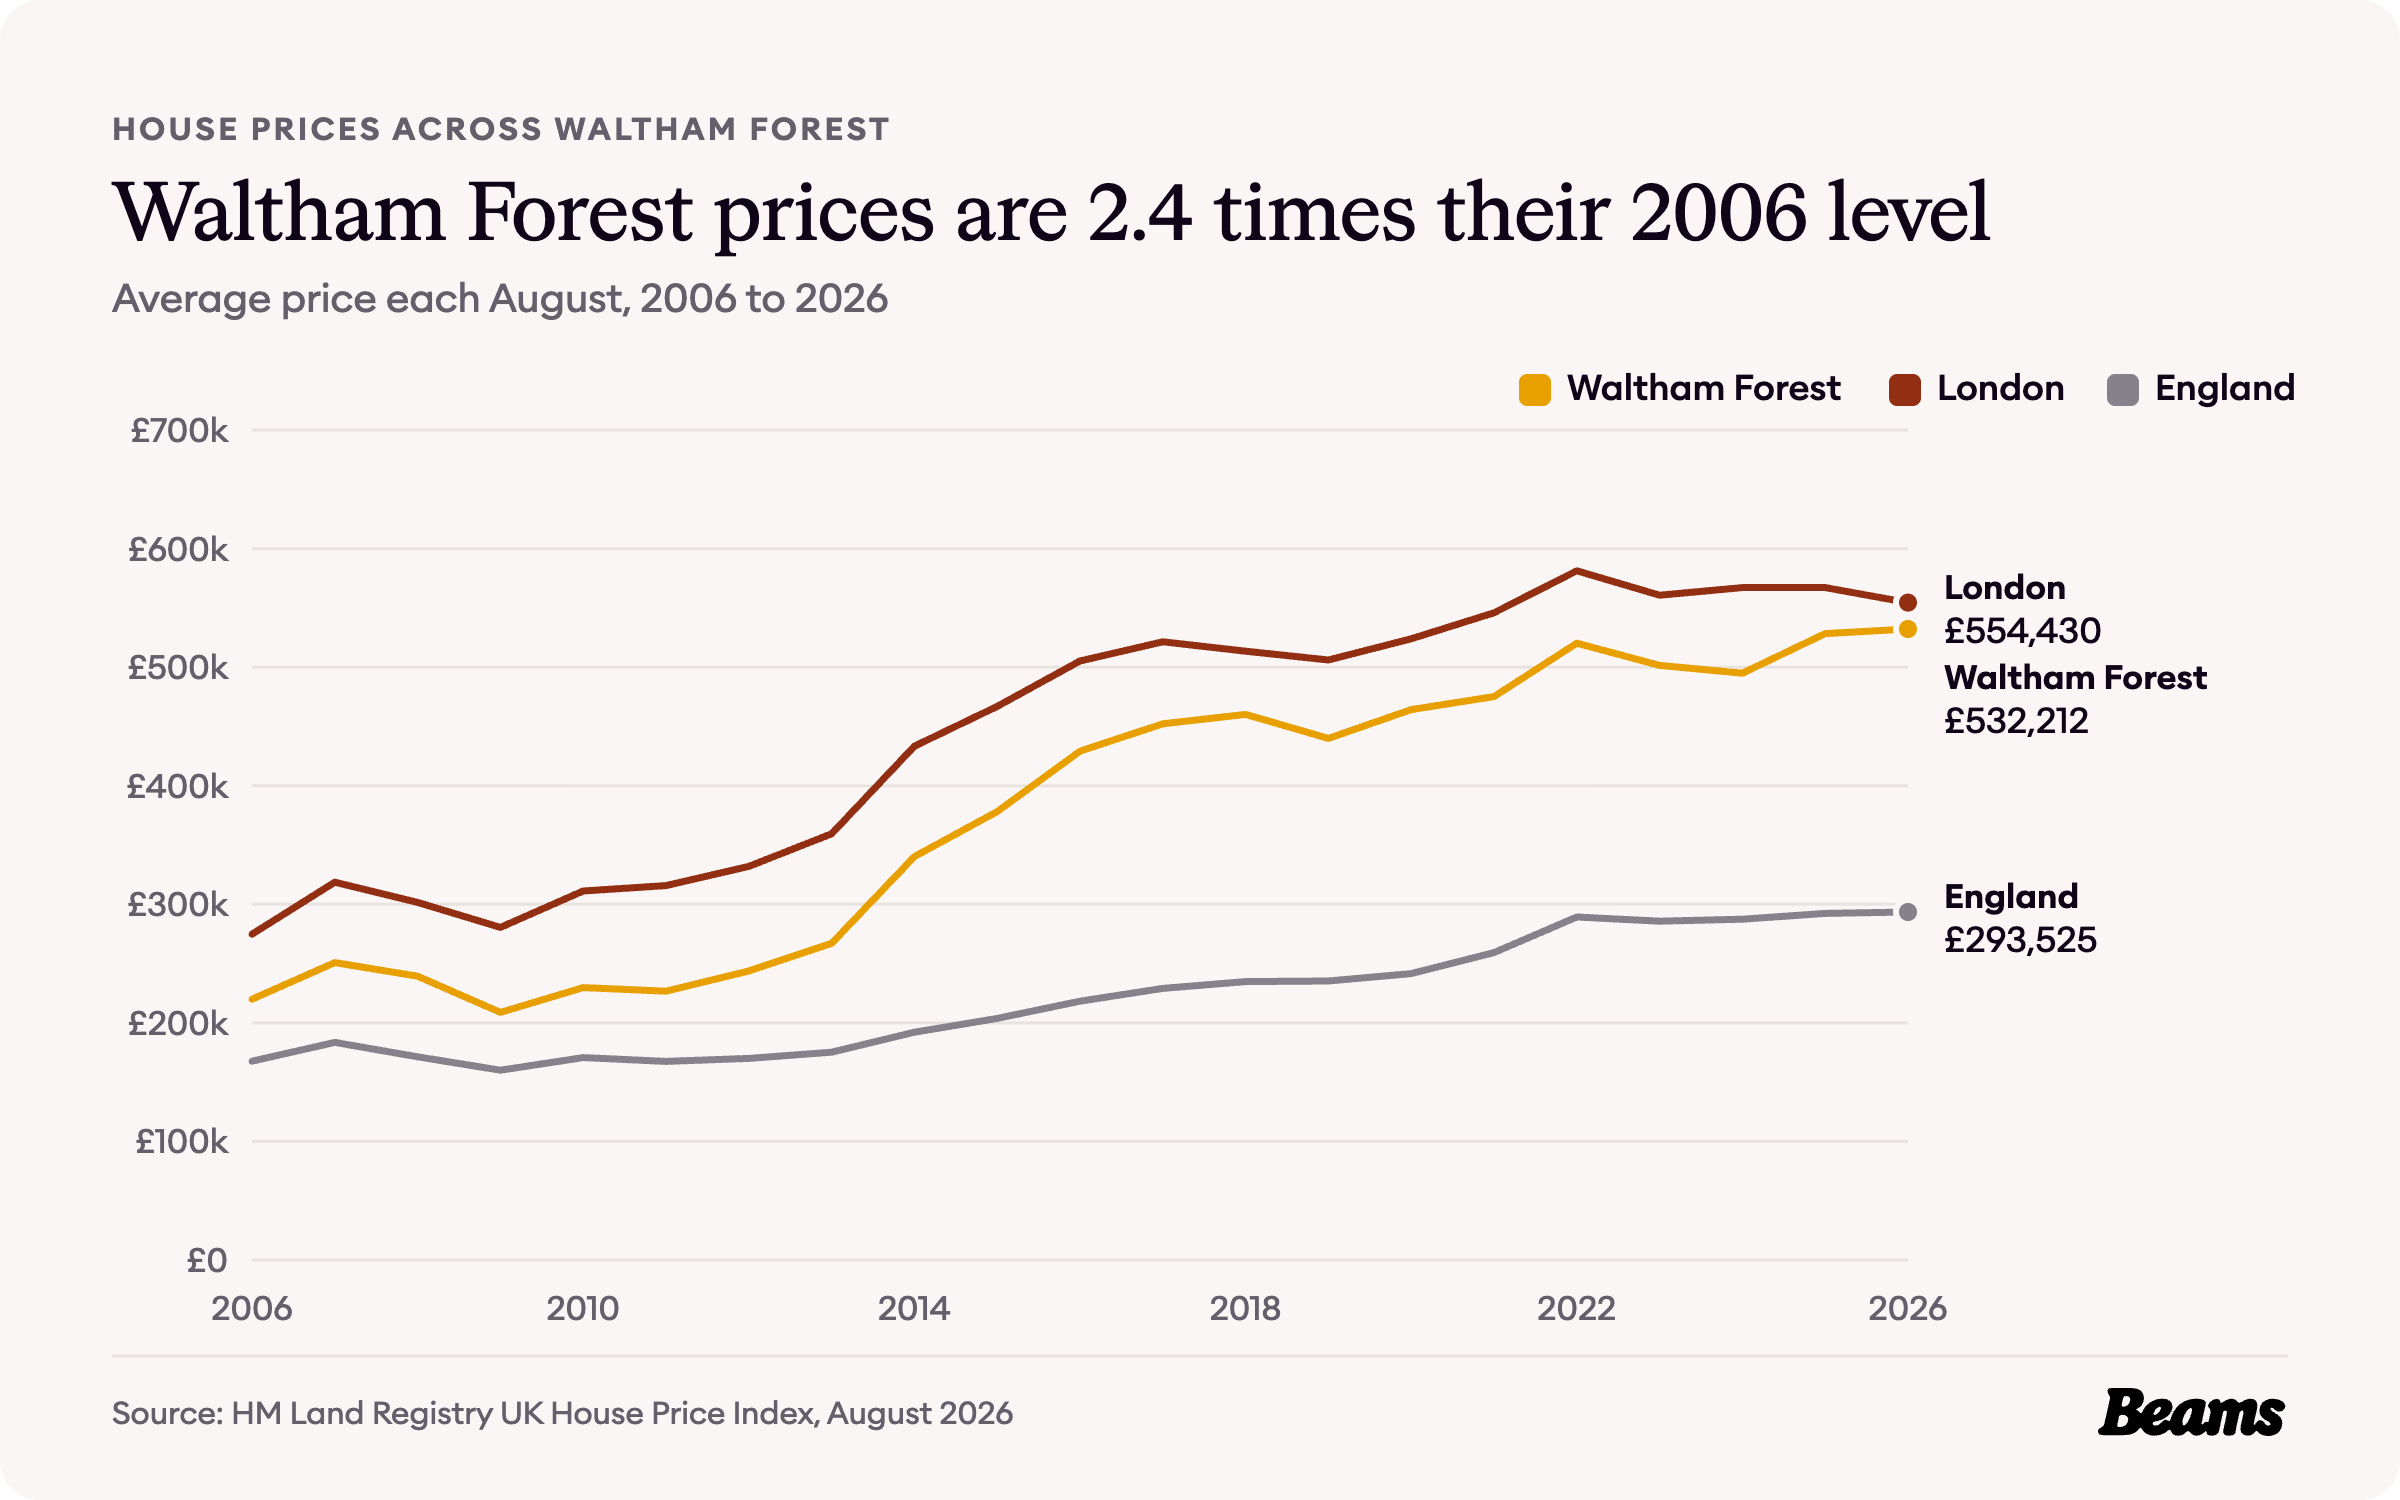
The average Waltham Forest home cost £532,212 in August 2026, up 0.7% on a year earlier, while the London average fell 2.2% to £554,430 [5]. The England average was £293,525 [6].
In August 2006 the borough average was £219,978. It is now 2.4 times that, against 2.0 times for London, and the biggest single jump came between August 2013 and August 2014, when the average rose from £266,984 to £340,170. Waltham Forest has never been above the London average, but this August's figure is the highest in the series [6].
Sale prices in E17
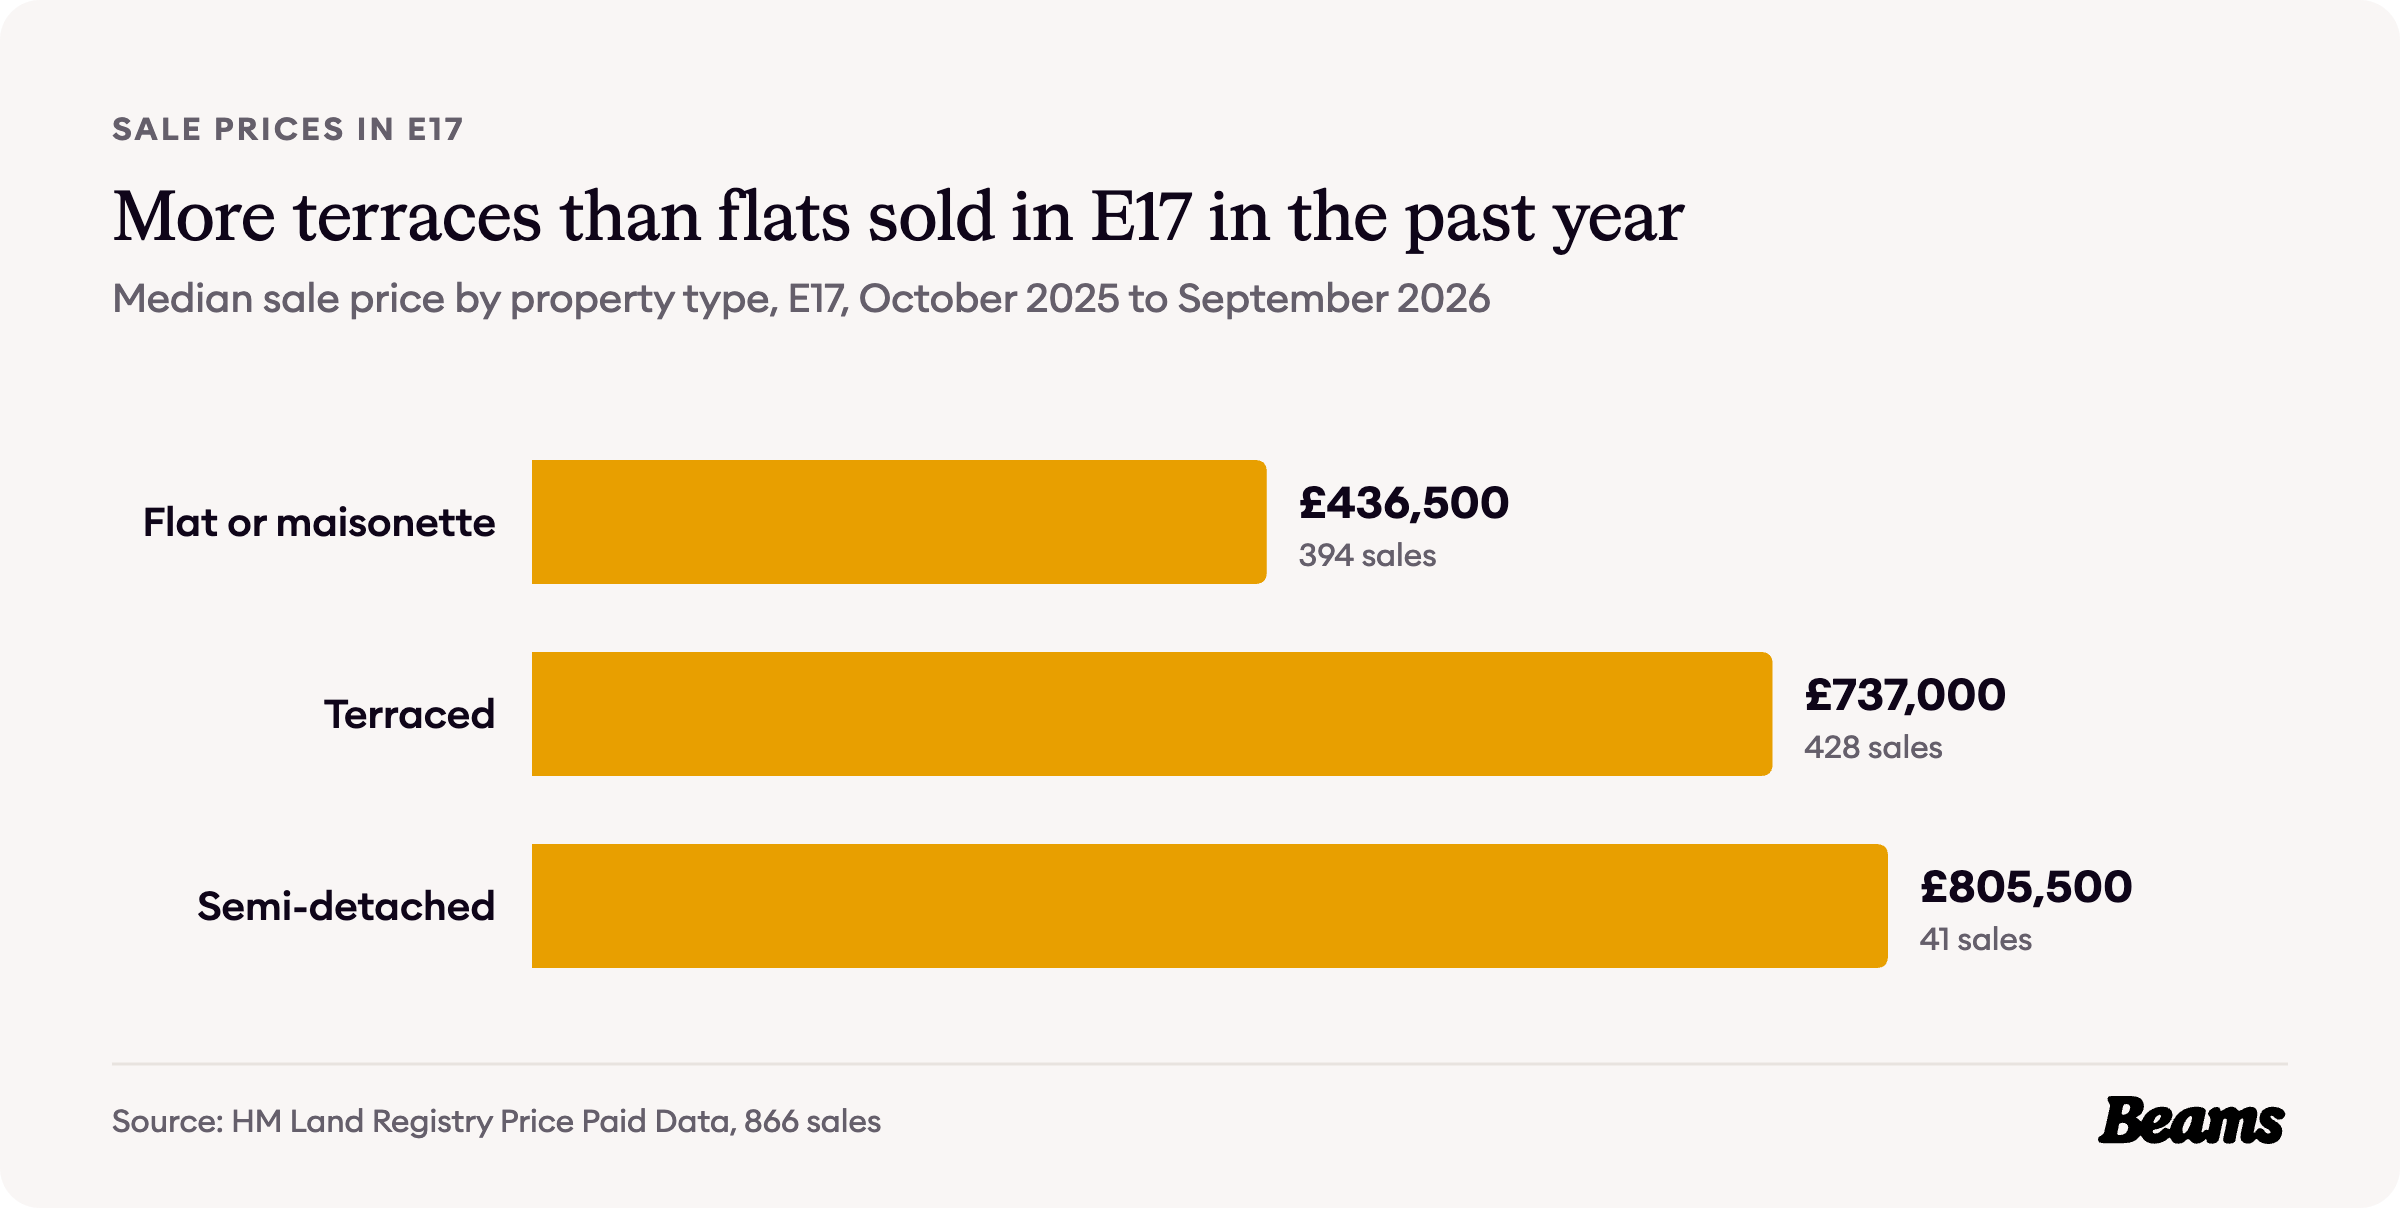
Land Registry recorded 866 sales in the E17 postcode district between October 2025 and September 2026, at a median price of £564,250 [7]. Terraced houses made up 428 of them, more than the 394 flats and maisonettes, and sold for a median of £737,000, against £436,500 for a flat, a gap of £300,500.
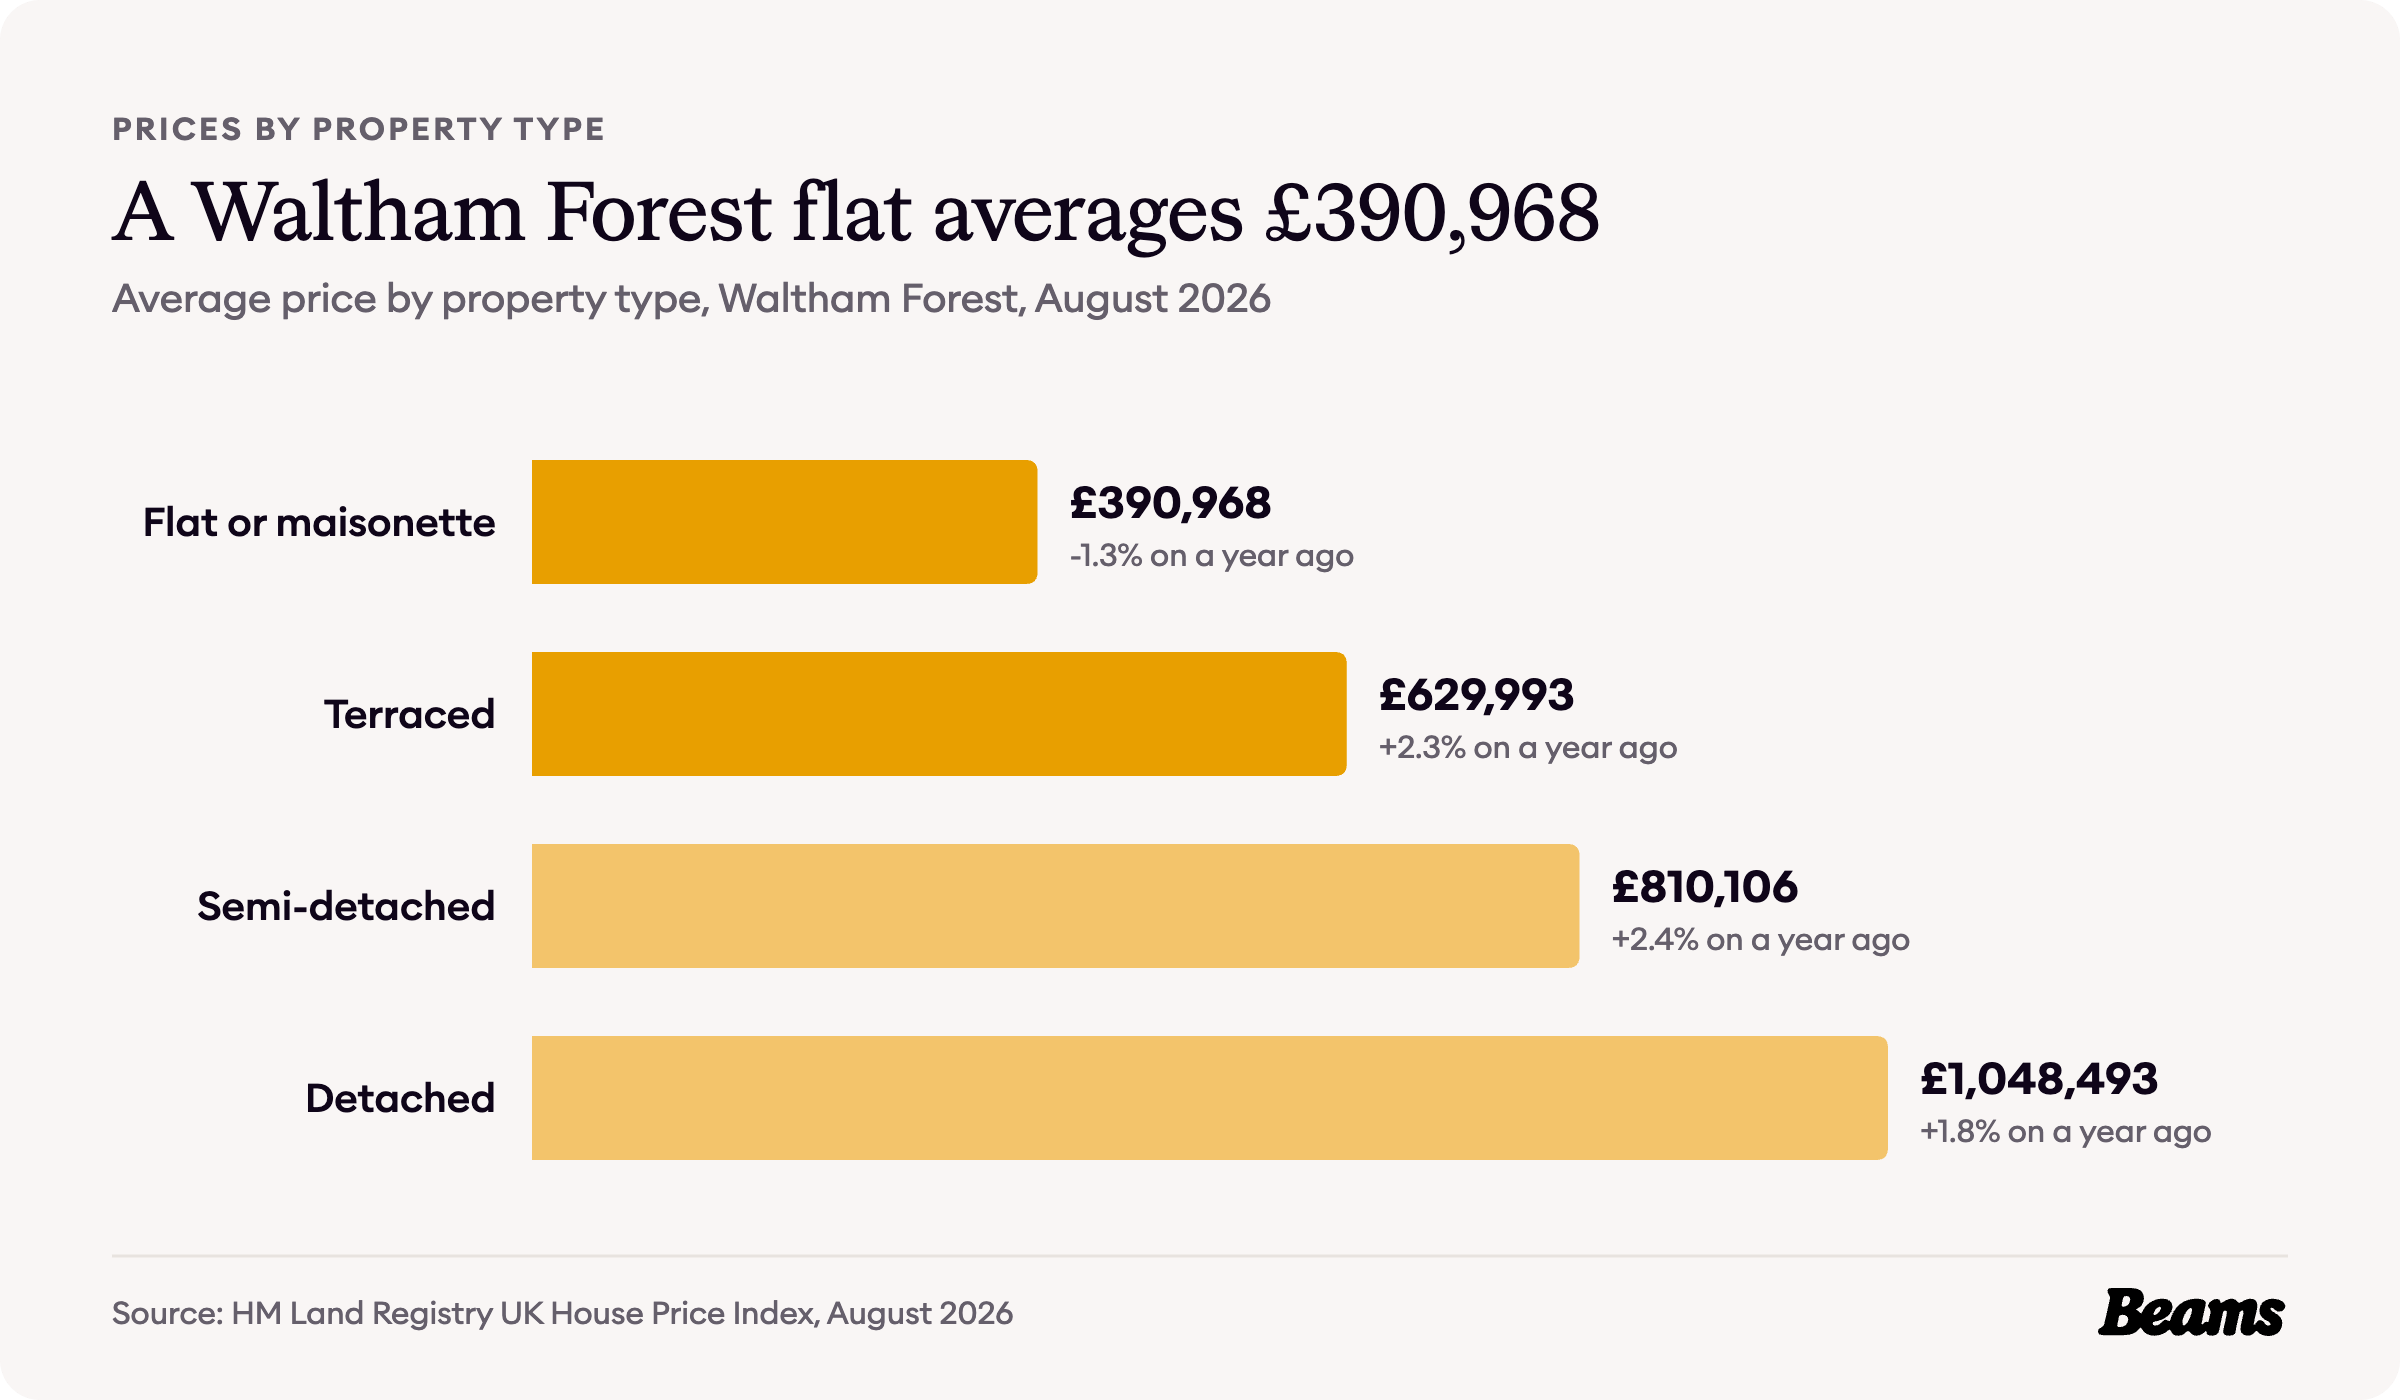
The 41 semi-detached houses that sold went for a median of £805,500 [7]. Across the whole borough, a terraced house averaged £629,993 in August 2026 and a flat or maisonette £390,968 [5].
With a semi-detached house in E17 at a median of £805,500, a house extension in Walthamstow is one way for a terrace owner to get more room without climbing to the next rung.
What it costs to rent
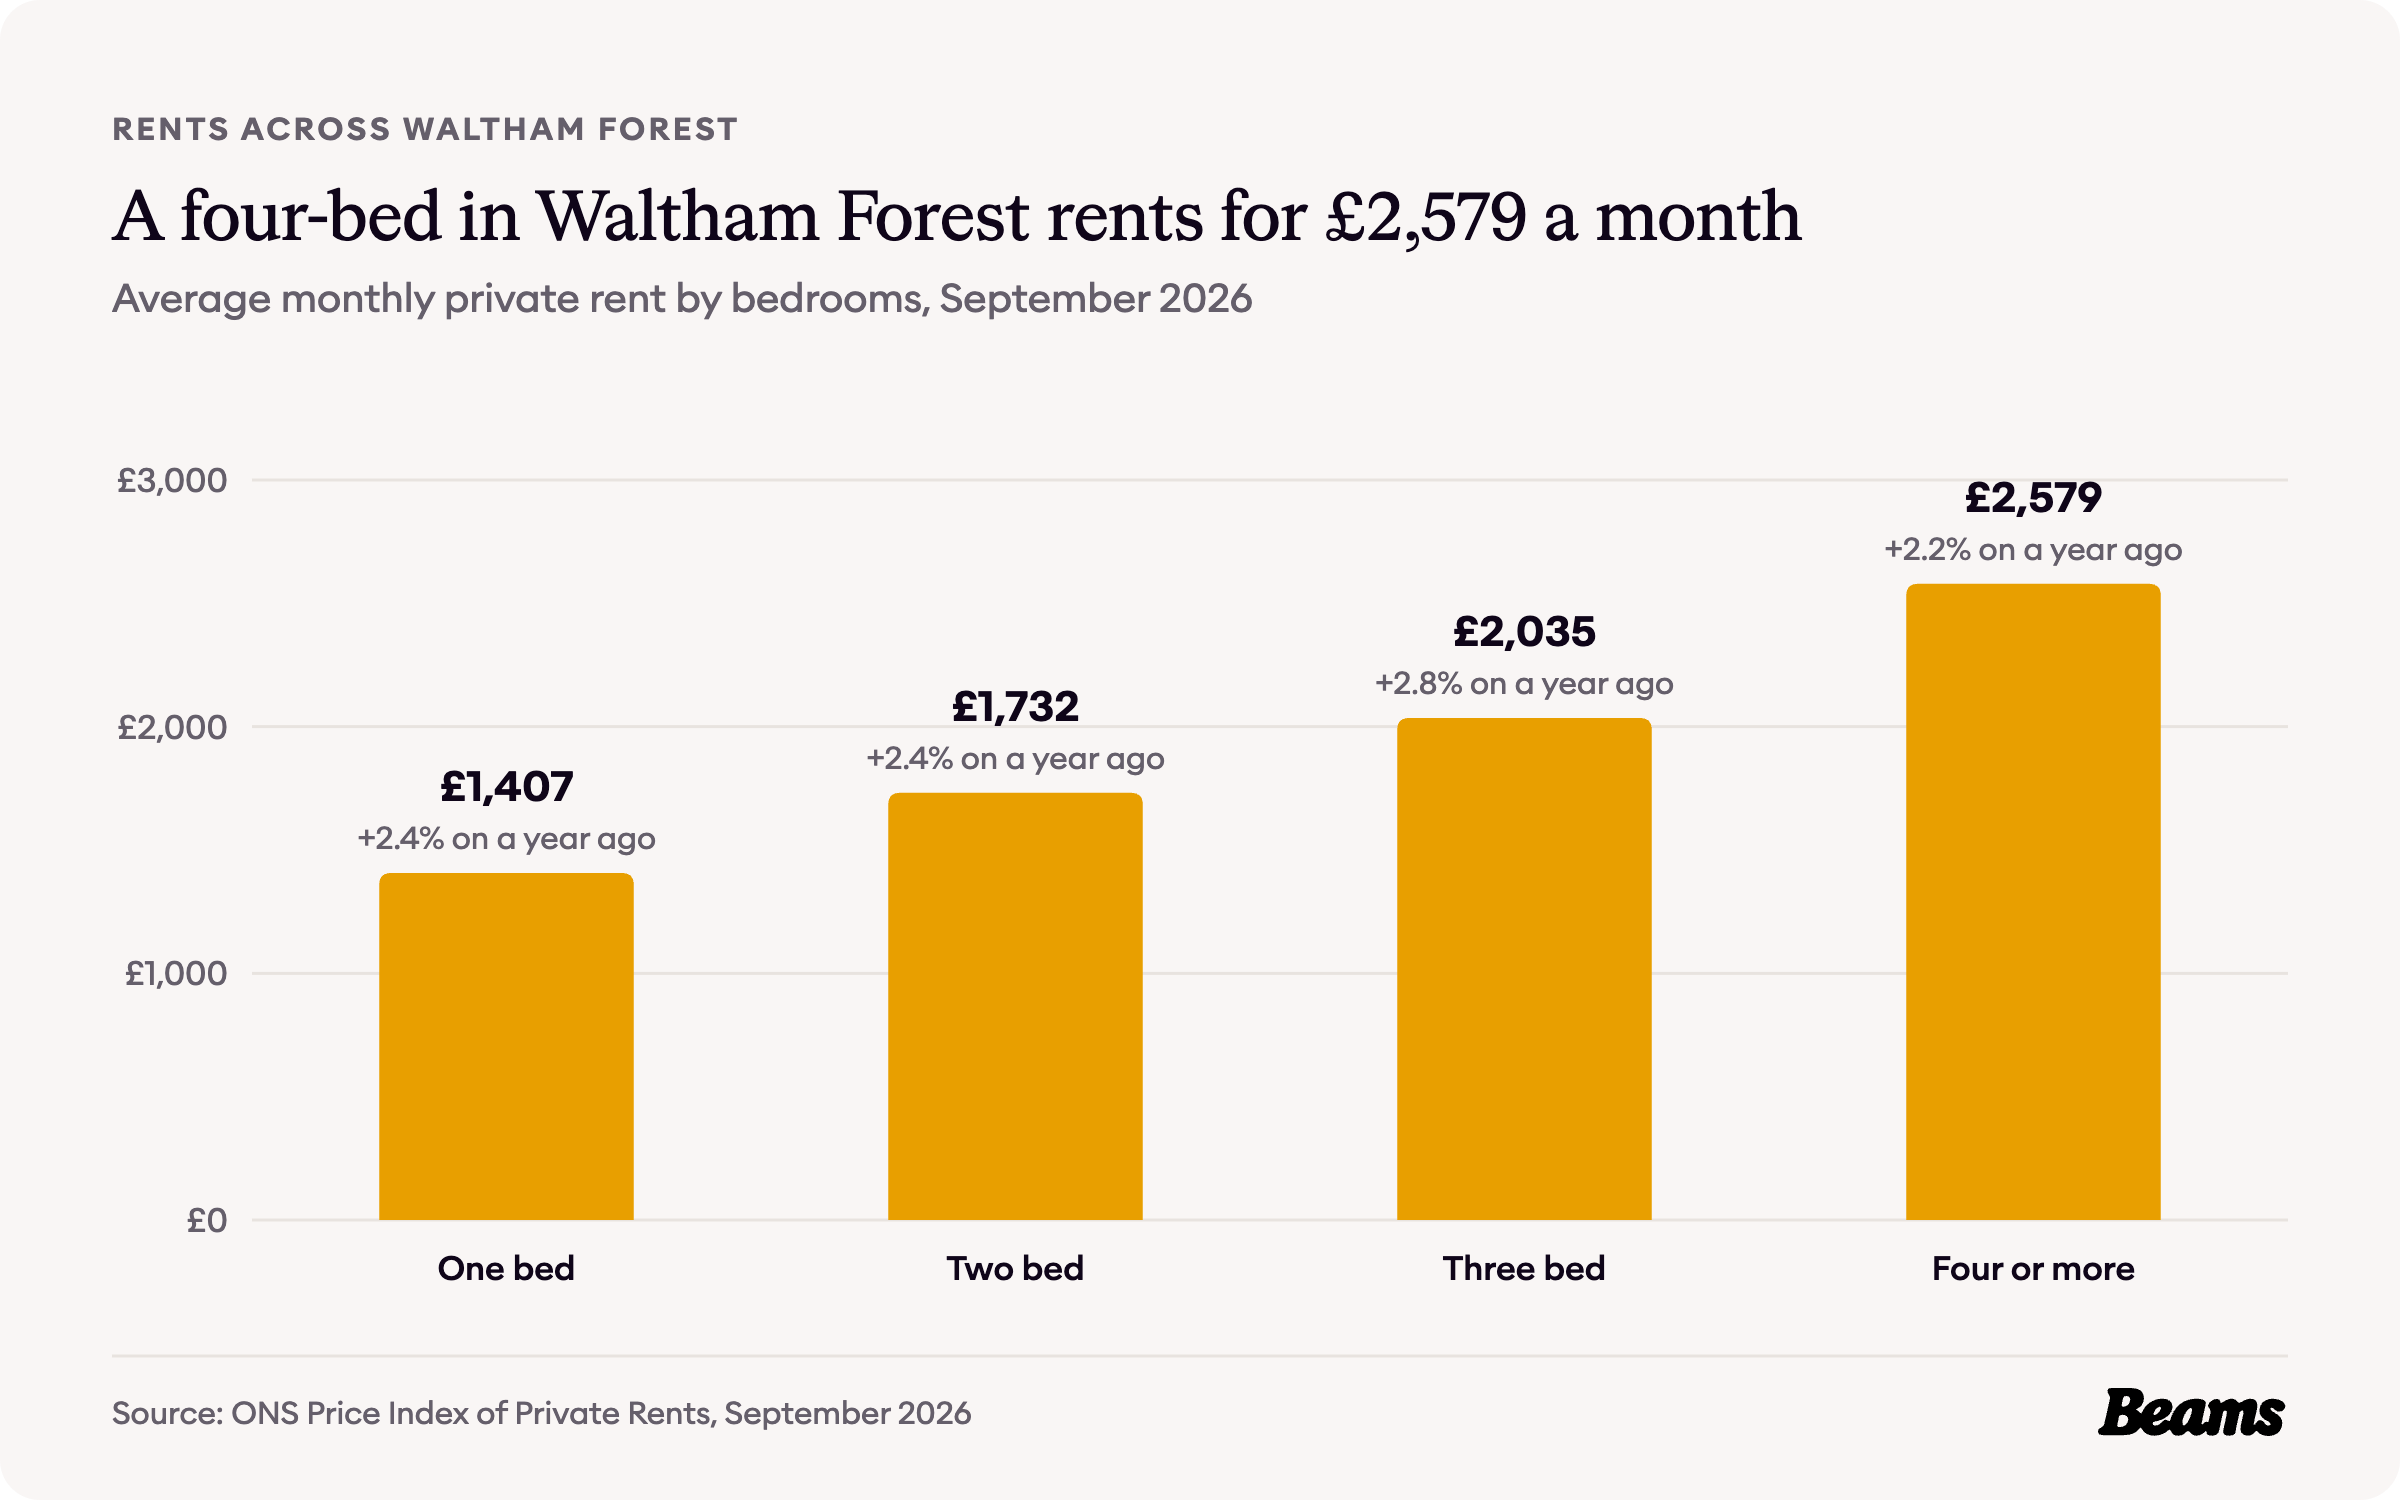
The average private rent across Waltham Forest was £1,772 a month in September 2026, up 2.4% on a year earlier [5]. A one-bedroom home averaged £1,407 a month, a three-bedroom home £2,035 and a home with four or more bedrooms £2,579.
The 29.2% of Walthamstow households who rent privately is close to the London share of 30.0% [4].
Where Walthamstow homes sit for Council Tax
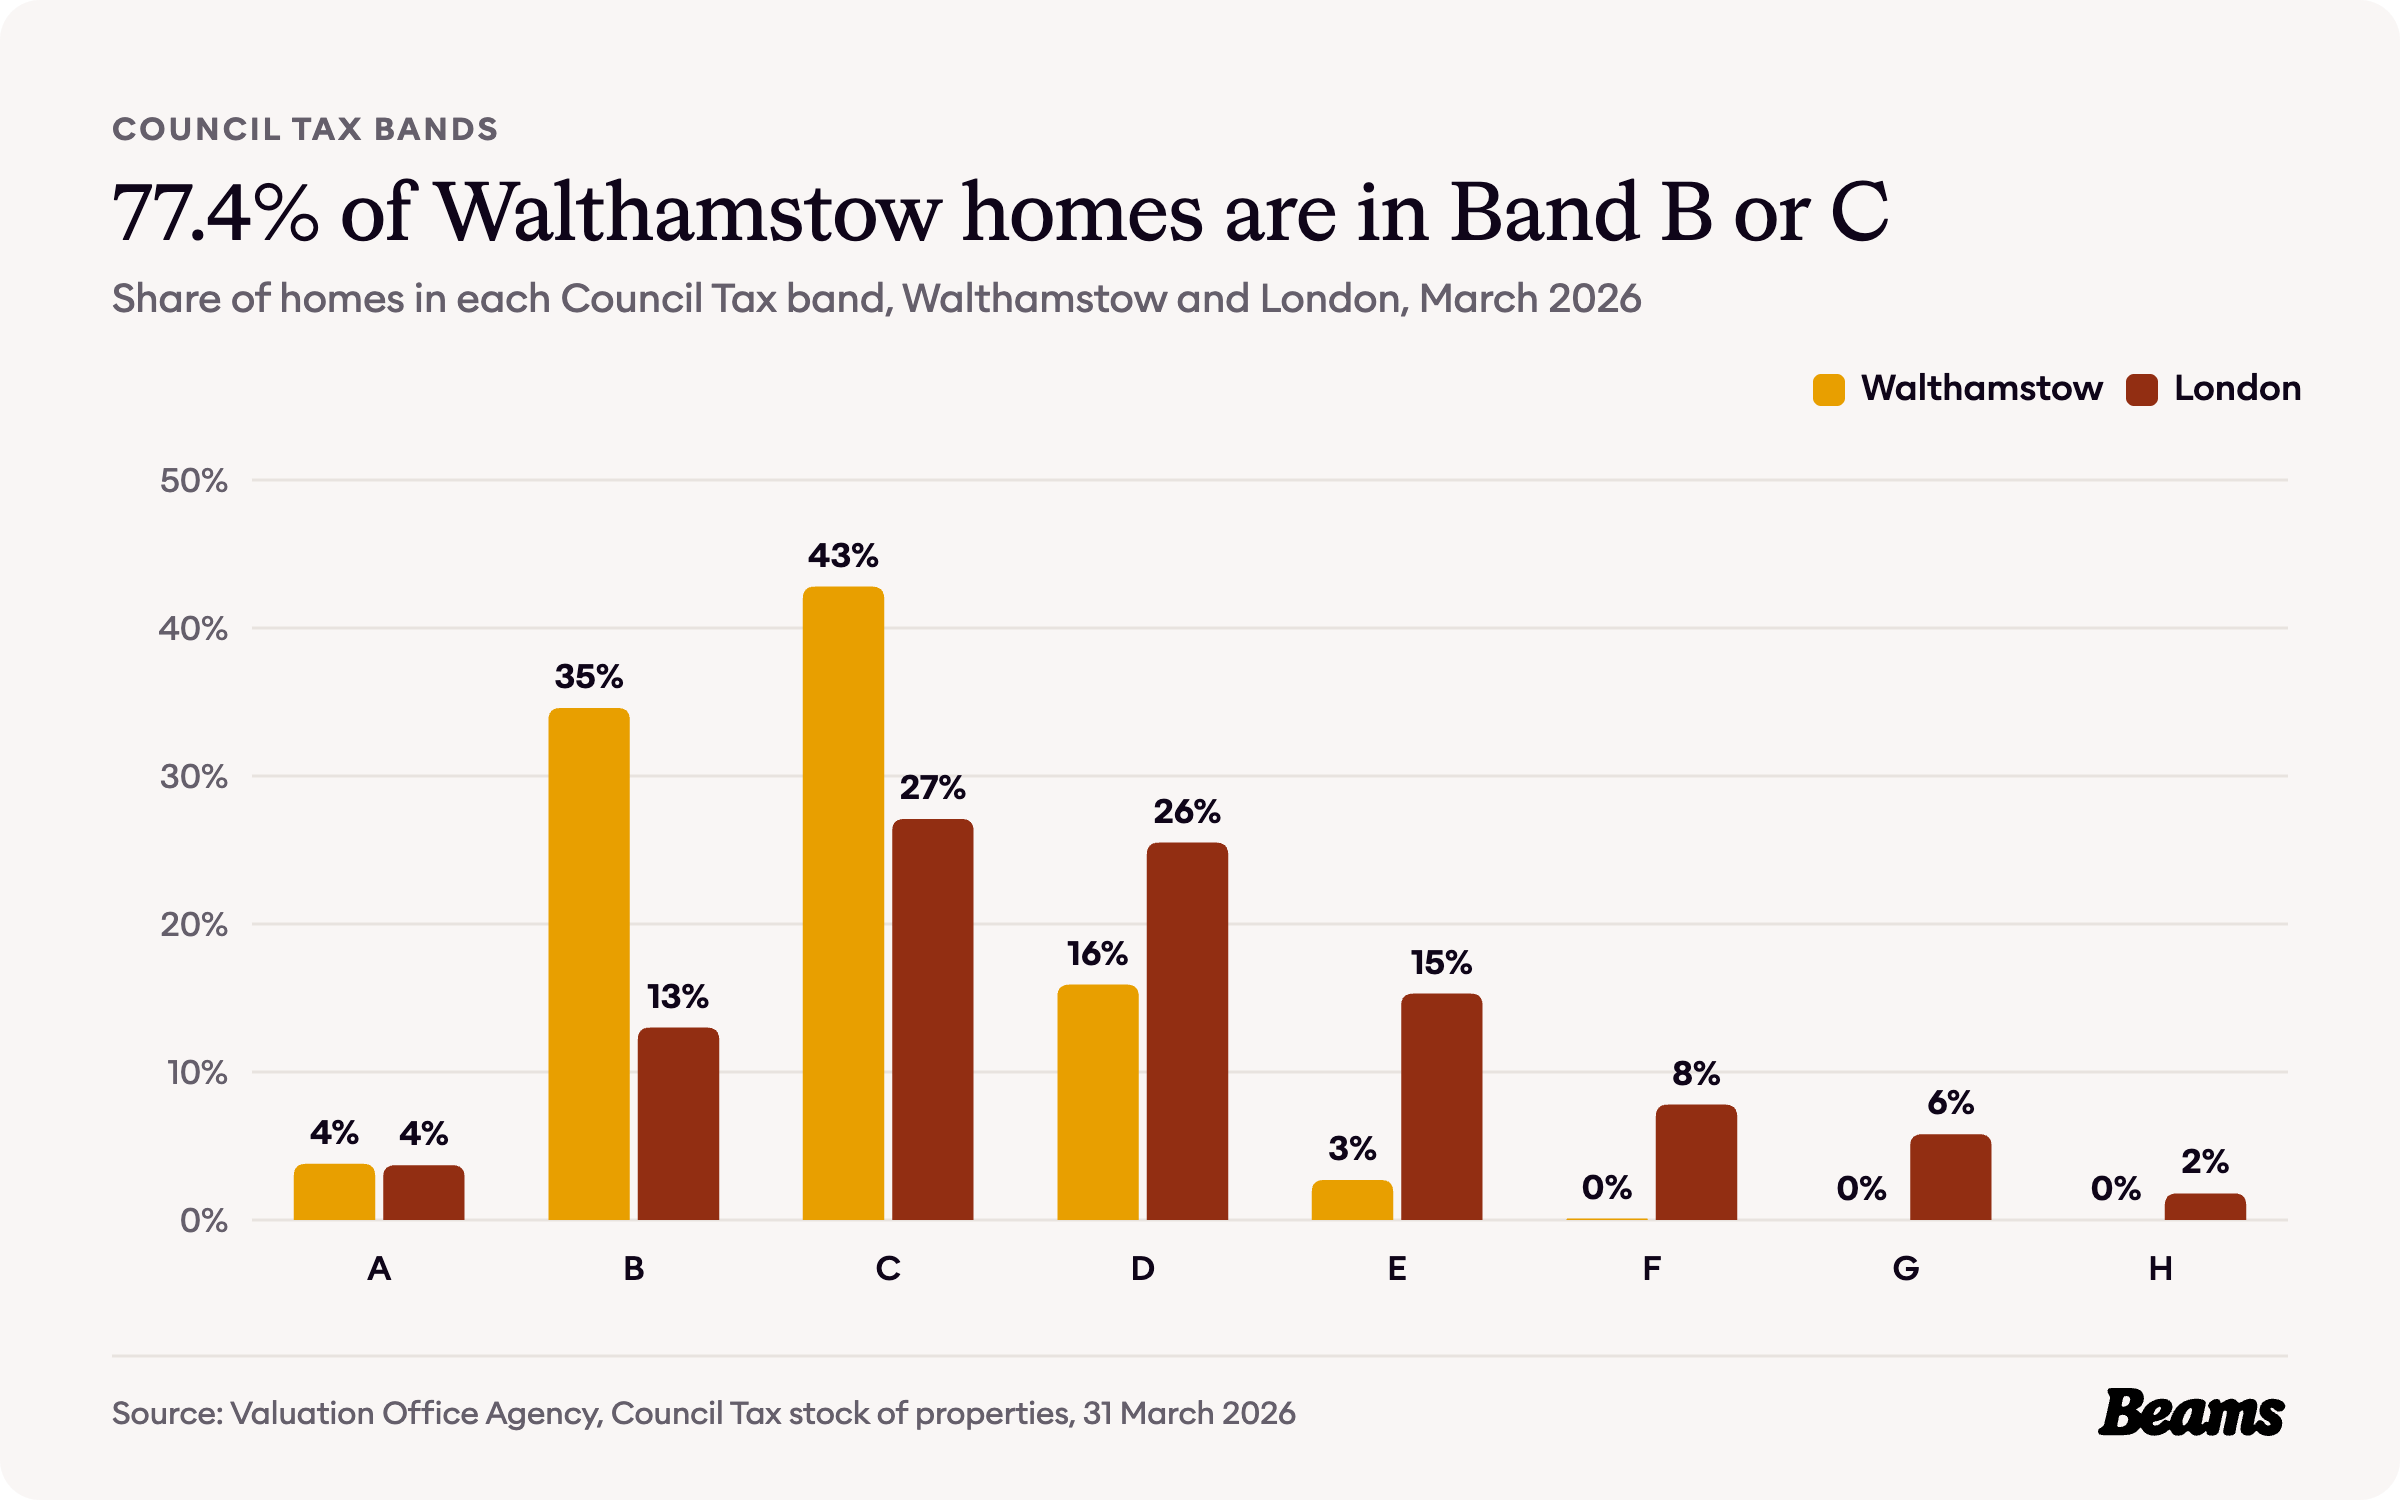
The Valuation Office Agency puts 42.8% of Walthamstow homes in Band C and 34.6% in Band B, 77.4% between them, against 40.1% for London [2].
Just 2.8% of homes are in Band E or above, against 30.7% across London, and Band D covers 15.9%, against 25.5% [2].
The rules on your street
Waltham Forest lists 15 conservation areas, among them Walthamstow Village, Walthamstow St James and Orford Road [8]. The old village centre around St Mary's church at Church End was designated a conservation area as early as 1968 [1].
Walthamstow Village and Orford Road are two of the nine conservation areas where the council has made Article 4 directions, which restrict permitted development rights. The council says you'll likely need planning permission to make external changes to properties in its conservation areas [8]. Where the outside of a house is protected, the inside is where owners have most freedom, and interior design in Walthamstow can make the most of a period house without touching its front.
Across the whole borough, another Article 4 direction means that turning a house into a small house in multiple occupation needs planning permission [9]. Once an application has been validated, Waltham Forest says the decision will be made within eight weeks [10]. Our builders in Walthamstow check which of these rules apply to your street before any work begins.
Walthamstow housing statistics at a glance
- Average house price, Waltham Forest, August 2026: £532,212 (London £554,430) [5] [6]
- Change on a year earlier: +0.7% (London -2.2%) [5] [6]
- Median sale price in E17, October 2025 to September 2026: £564,250 [7]
- Median terraced house in E17: £737,000 [7]
- Average private rent, Waltham Forest, September 2026: £1,772 a month [5]
- Homes built before 1919: 47.8% (London 29.0%) [2]
- Homes built since 2000: 20.1% (London 18.5%) [2]
- Households living in a terraced house: 36.0% (London 21.3%) [3]
- Households who own their home: 45.5% (London 45.2%) [4]
- Conservation areas in Waltham Forest: 15 [8]
Frequently asked questions
References
- British History Online, Walthamstow: Introduction and domestic buildings. Victoria County History of Essex, volume 6.
- Valuation Office Agency, Council Tax: stock of properties 2026. Table CTSOP4.1, properties by build period and Council Tax band at 31 March 2026, Walthamstow census areas and London.
- ONS, Census 2021 table TS044: Accommodation type. Households by type of home, Walthamstow census areas and London.
- ONS, Census 2021 table TS054: Tenure. Households by tenure, Walthamstow census areas and London.
- ONS, Housing prices in Waltham Forest. UK House Price Index for August 2026 and Price Index of Private Rents for September 2026, published 21 October 2026.
- HM Land Registry, UK House Price Index. Average prices for Waltham Forest, London and England, August 2006 to August 2026.
- HM Land Registry, Price Paid Data. Sales in the E17 postcode district, October 2025 to September 2026.
- Waltham Forest Council, Conservation areas and listed buildings. Accessed 29 October 2026.
- Waltham Forest Council, Local Article 4 directions. Accessed 29 October 2026.
- Waltham Forest Council, Residential Alterations and Retrofit SPD: Navigating the planning process. Accessed 29 October 2026.
Thinking of improving rather than moving?
Tell us about your Walthamstow home and what you want to change, from a Warner terrace to a new-build flat. We'll give you a free estimate, then up to three vetted builders quote against the same specification.