
Richmond housing statistics 2026
Richmond started as a Georgian riverside town, grew fast once the railway came, and is now a borough of family houses where most households own their home. The average home here costs £813,931, about 47% more than the London average.
Every figure comes from an official source and is dated, so you can see exactly what you are working with before you plan a home renovation in Richmond. The figures cover the whole borough of Richmond upon Thames, and the sources are numbered in brackets and listed in full at the end of the page.
How Richmond was built
In 1911 the Victoria County History called old Richmond "essentially a Queen Anne and Georgian town". Maids of Honour Row, the red brick houses facing the Green, went up in the reign of George I, and by 1792 the parish had 815 houses [1].
The railway to London opened in 1846, and growth after that was rapid. The population rose from 9,255 in 1851 to 22,684 in 1891 and 25,577 in 1901, nearly three times as many people in fifty years [1].
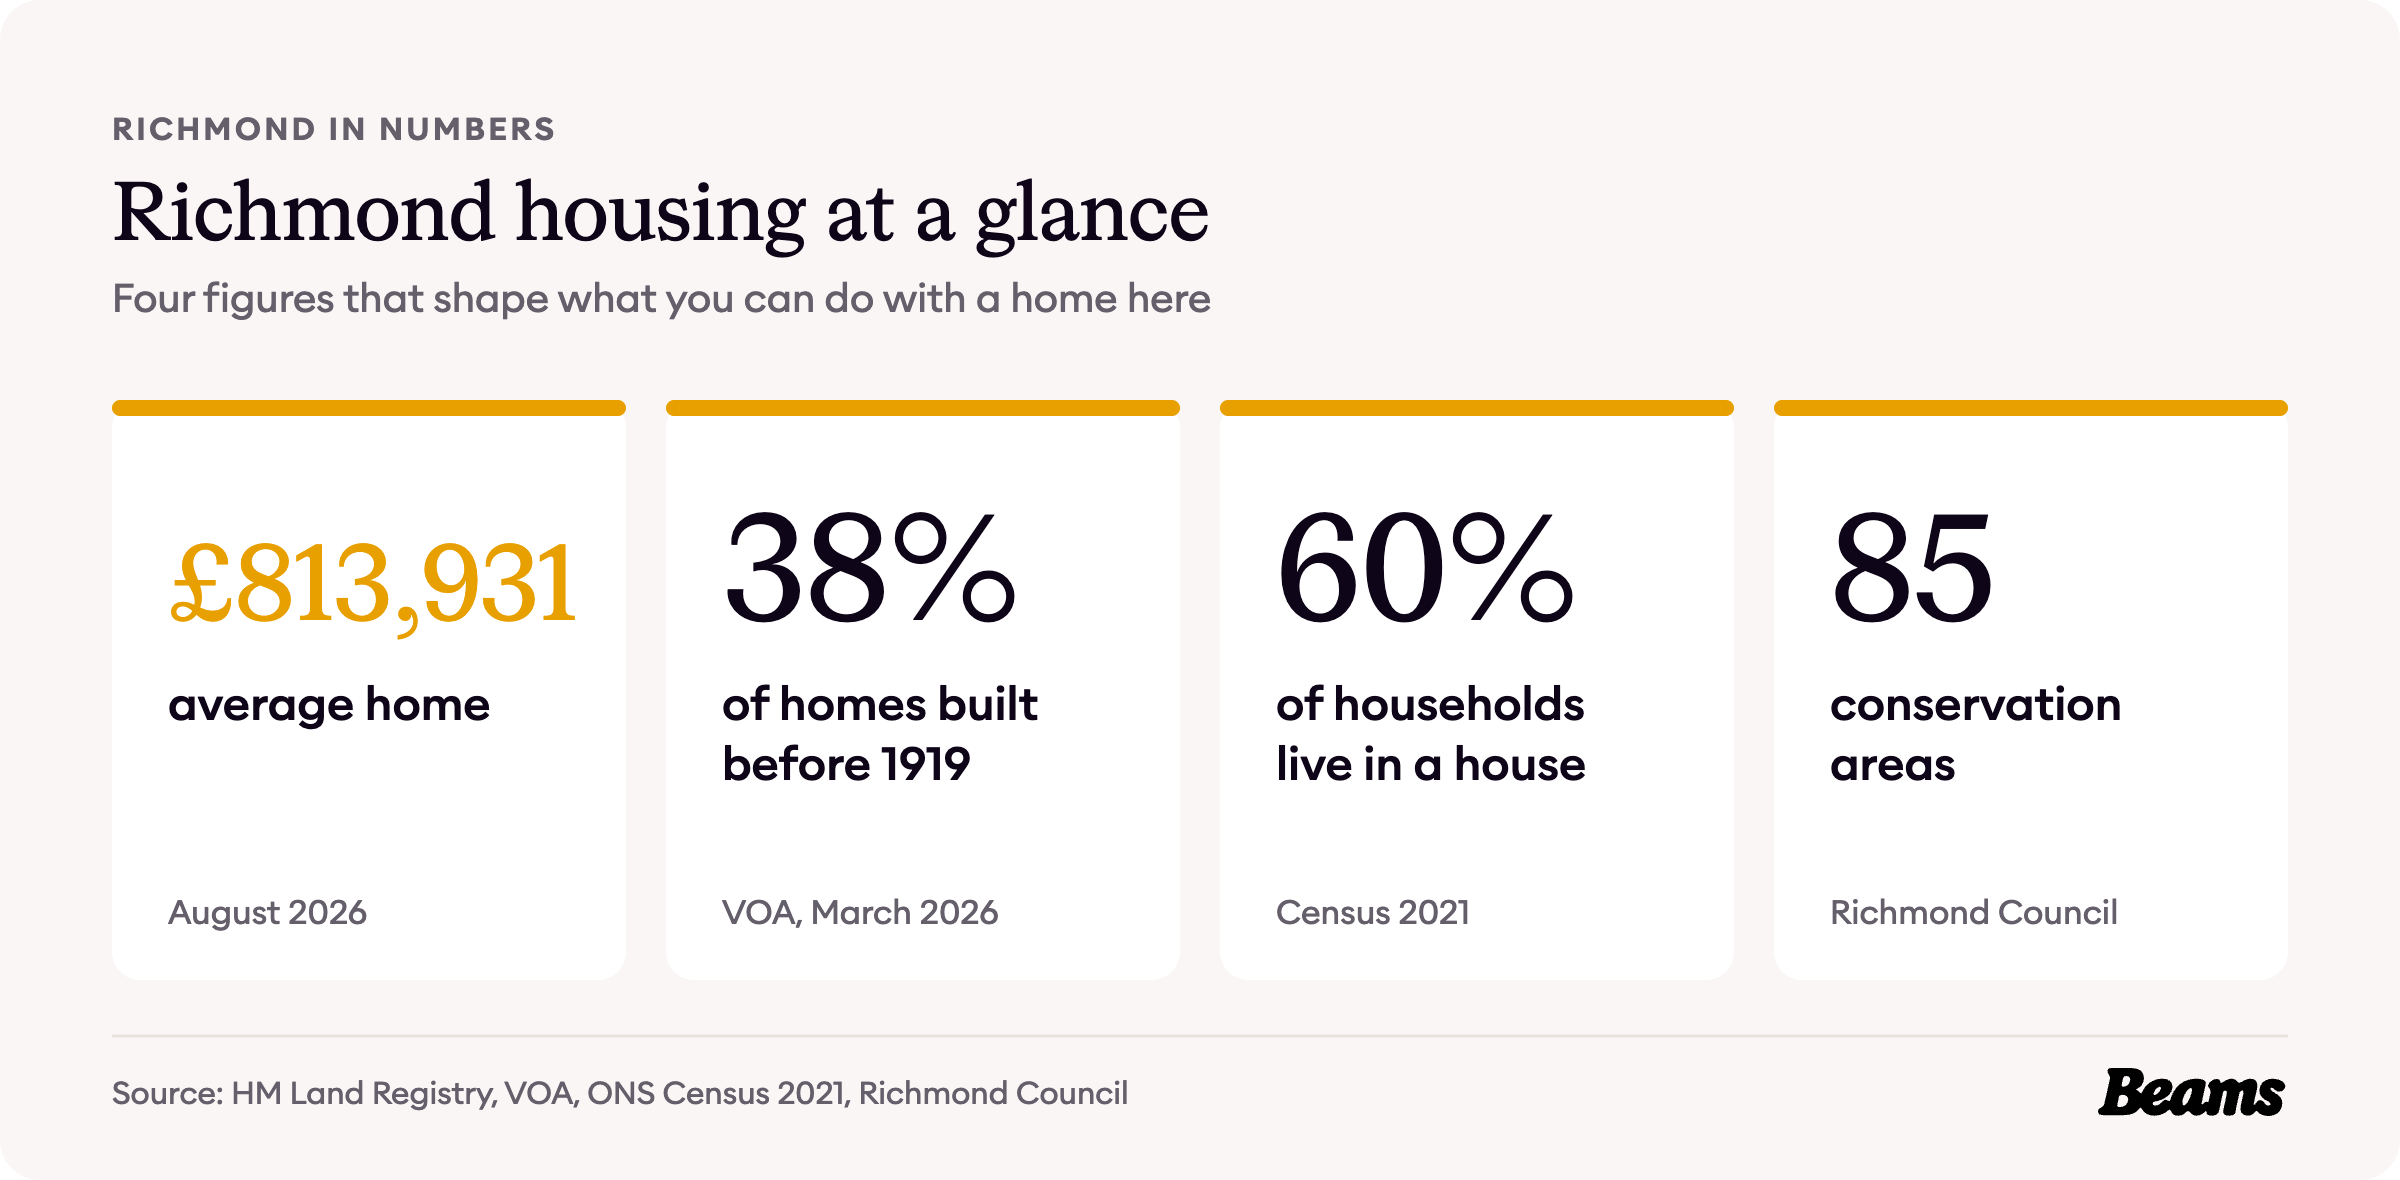
The borough's housing still leans towards that era and the decades just after it. The Valuation Office Agency counts 85,870 homes in Richmond upon Thames. 20.3% were built before 1900, close to London's 20.8%, but 17.5% went up between 1900 and 1918, more than twice London's 8.2%, and another 24.1% between the wars [2].
Very little is new. Only 8.6% of homes have been built since 2000, less than half London's 18.5% [2]. With 61.9% of the borough's homes built before 1940, a loft conversion in Richmond is often the first way to add space.
How Richmond households live
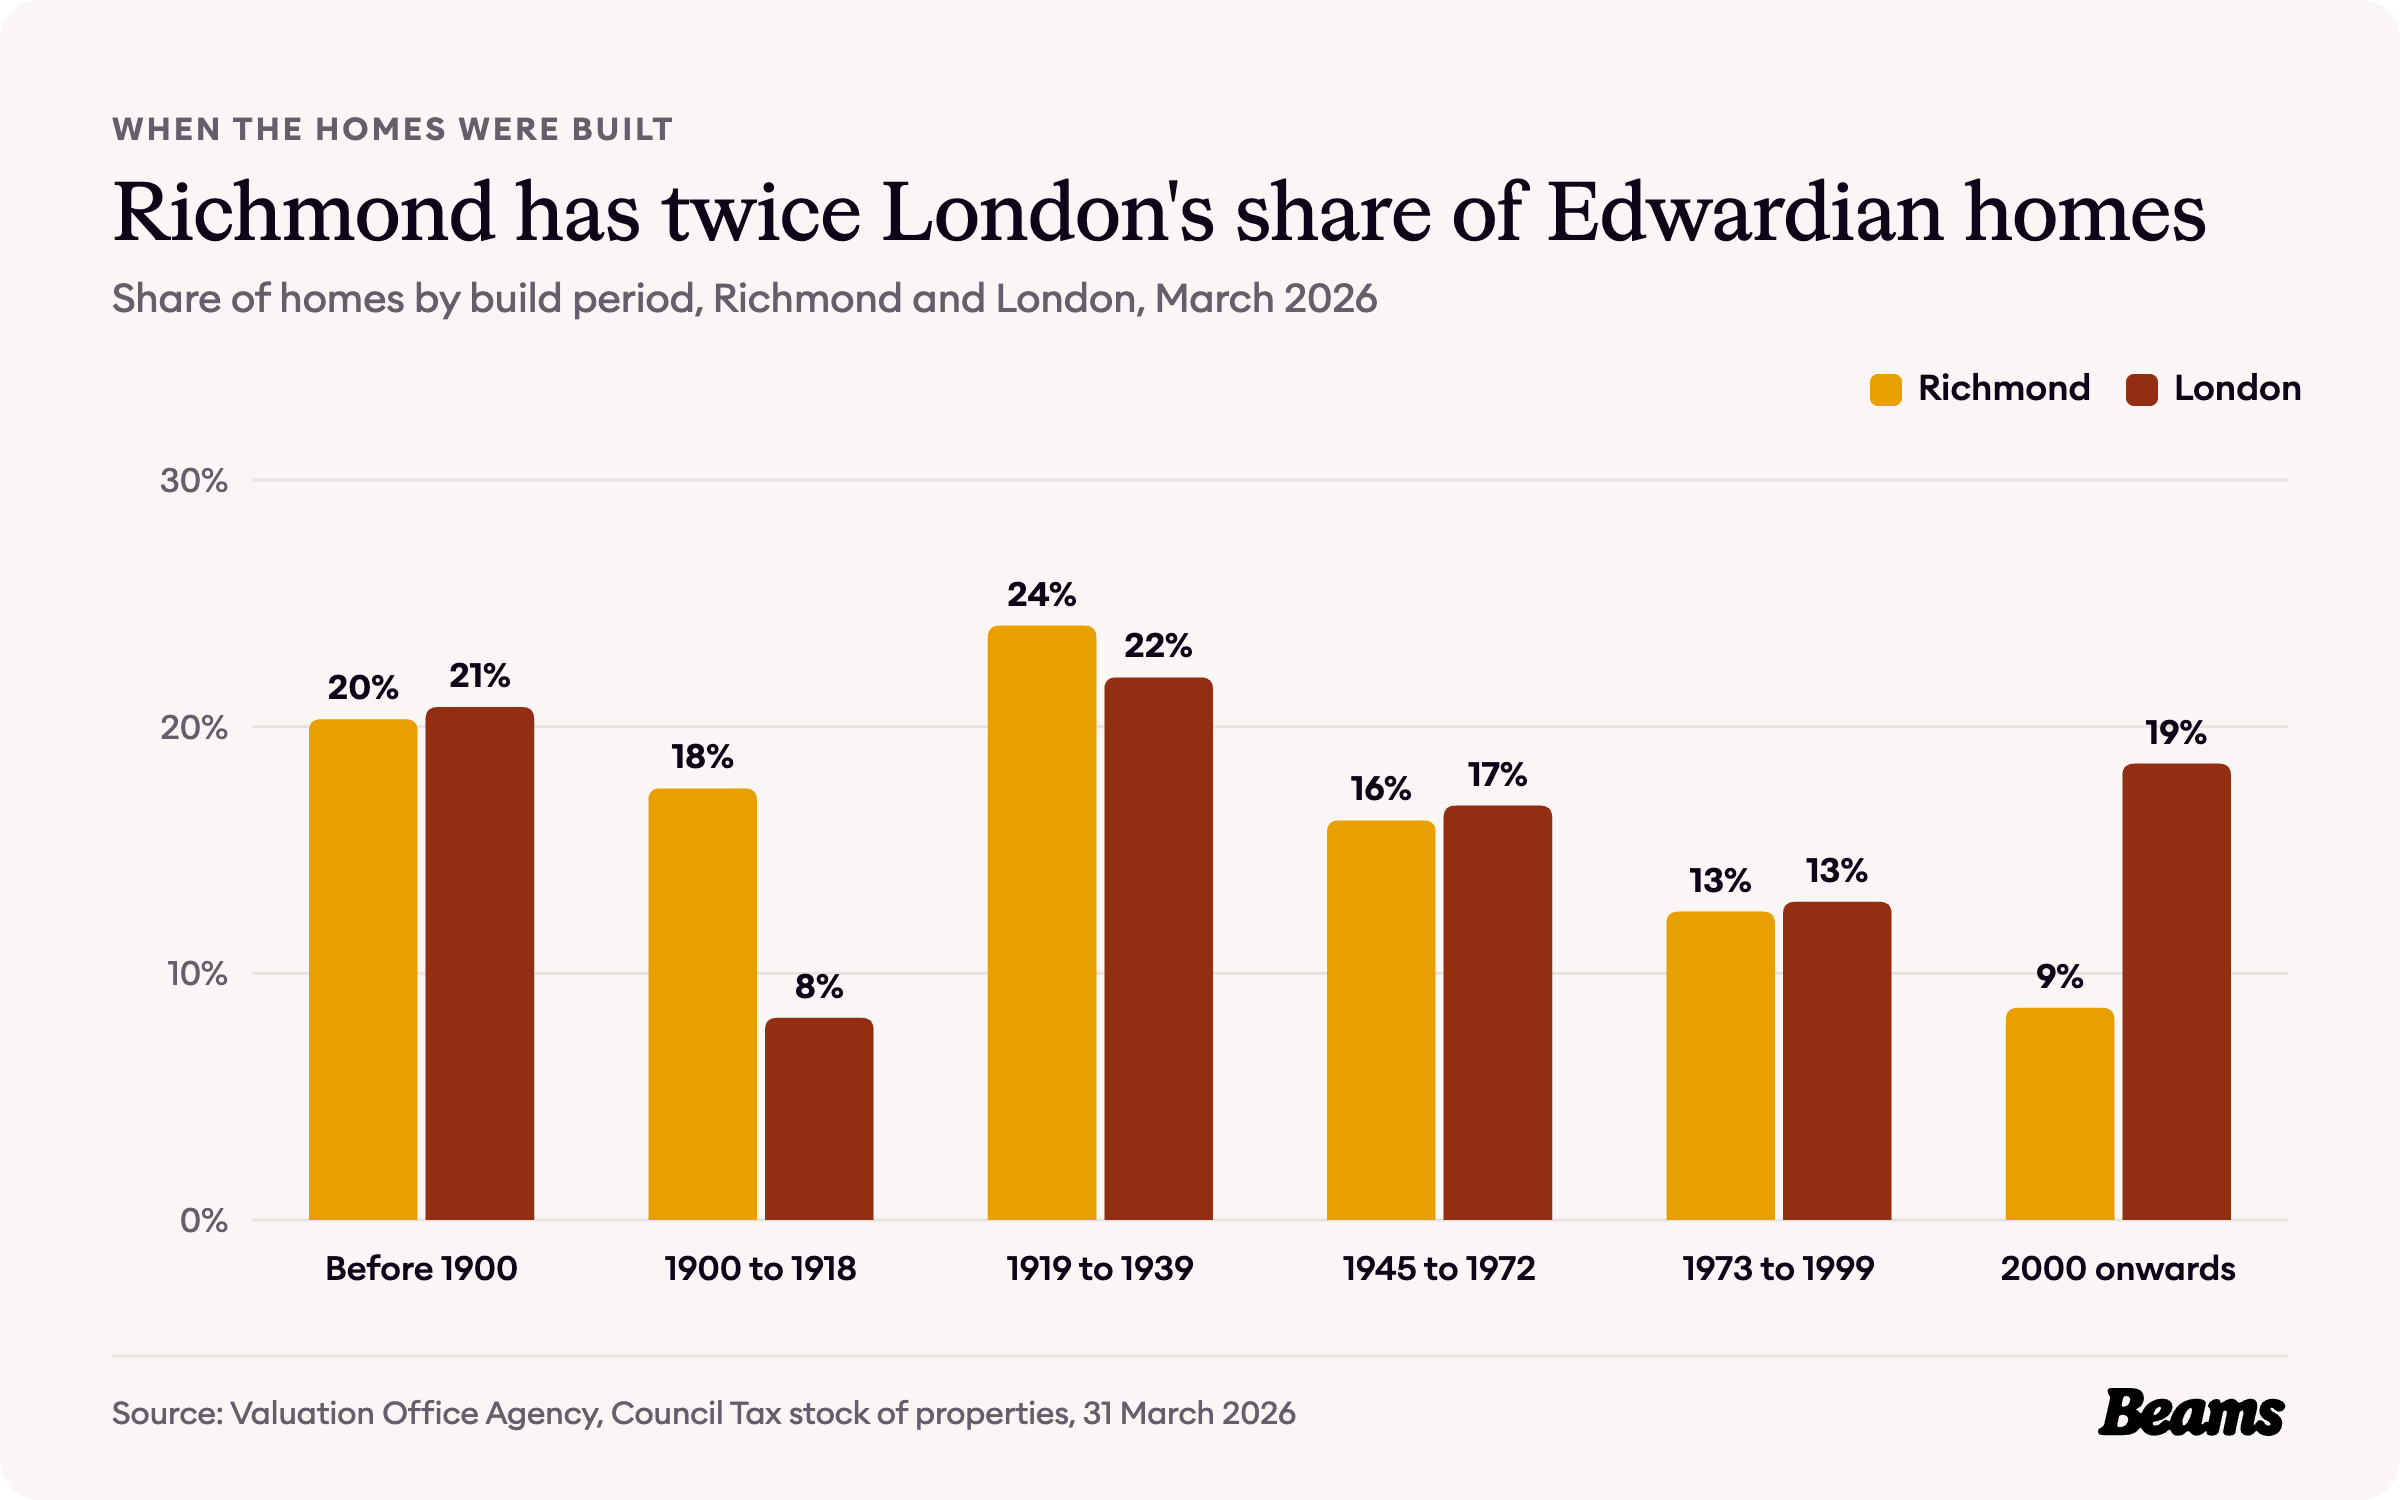
Richmond is a borough of houses. The 2021 Census found 59.9% of its 80,705 households living in a house, against 46.0% across London [3].
26.6% live in a terraced house, 25.0% in a semi-detached house and 8.3% in a detached house. Flats account for the other 40.0%, well below London's 54.0%, and only 8.8% of households live in a flat in a converted house [3].
Who owns Richmond's homes
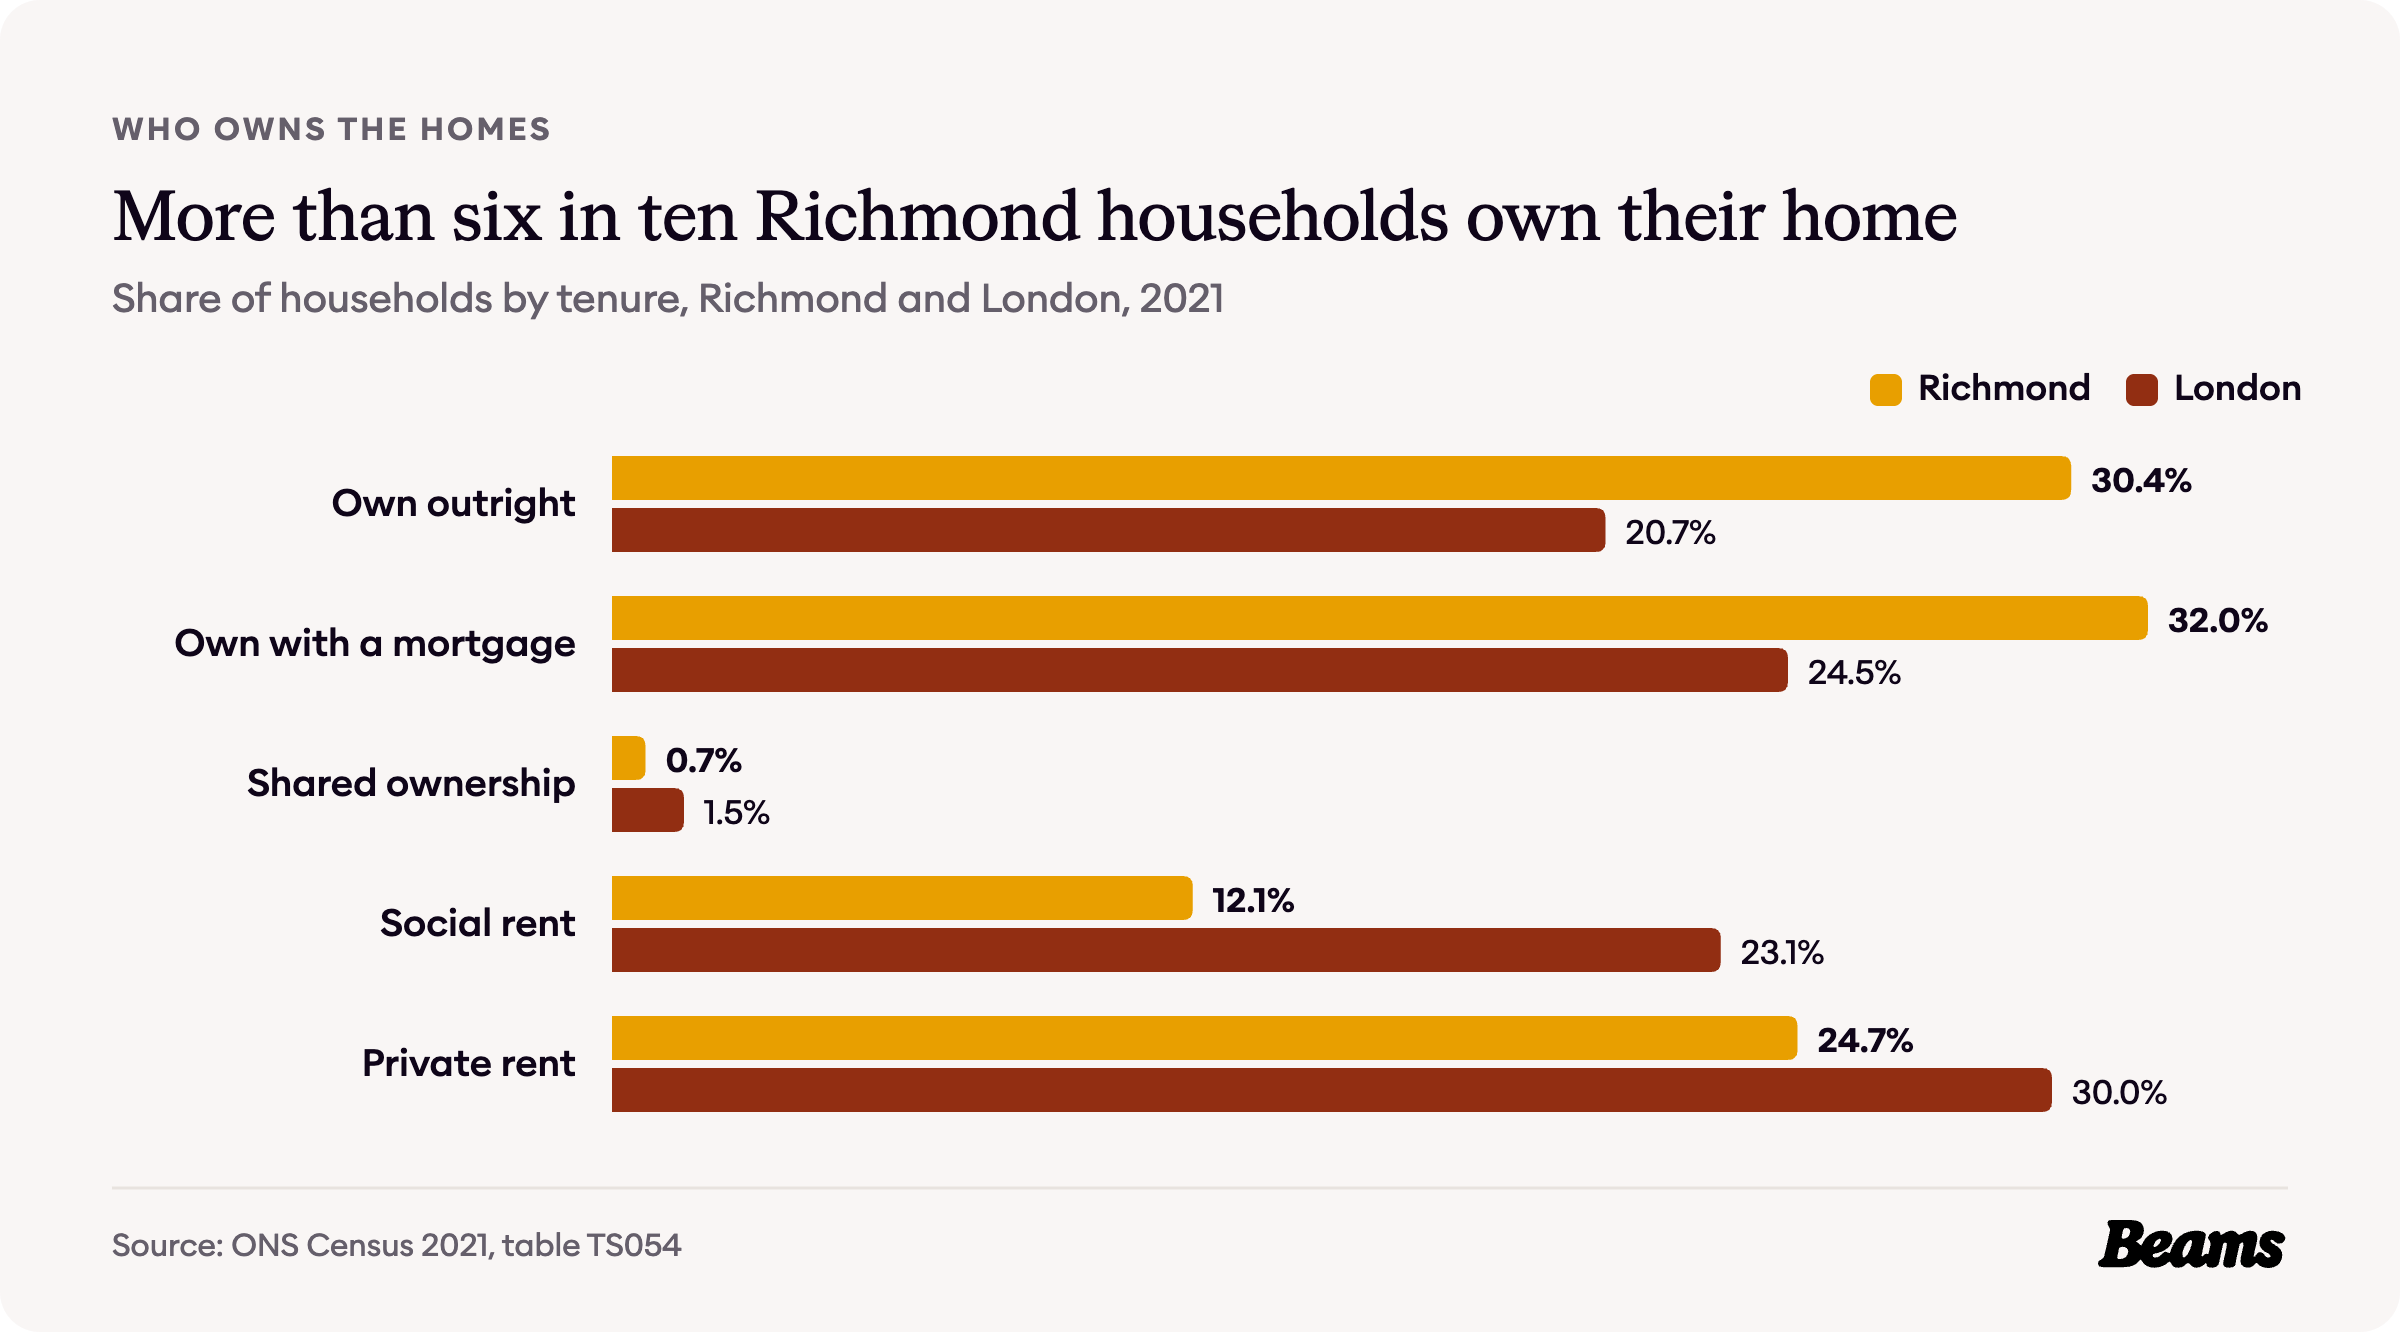
Owning is the norm in Richmond. 30.4% of households own their home outright and 32.0% with a mortgage, 62.4% in all, compared with 45.2% across London [4].
Renting is less common than across London. 24.7% of households rent privately, against 30.0%, and 12.1% rent from the council or a housing association, against 23.1% [4].
What a home costs in Richmond
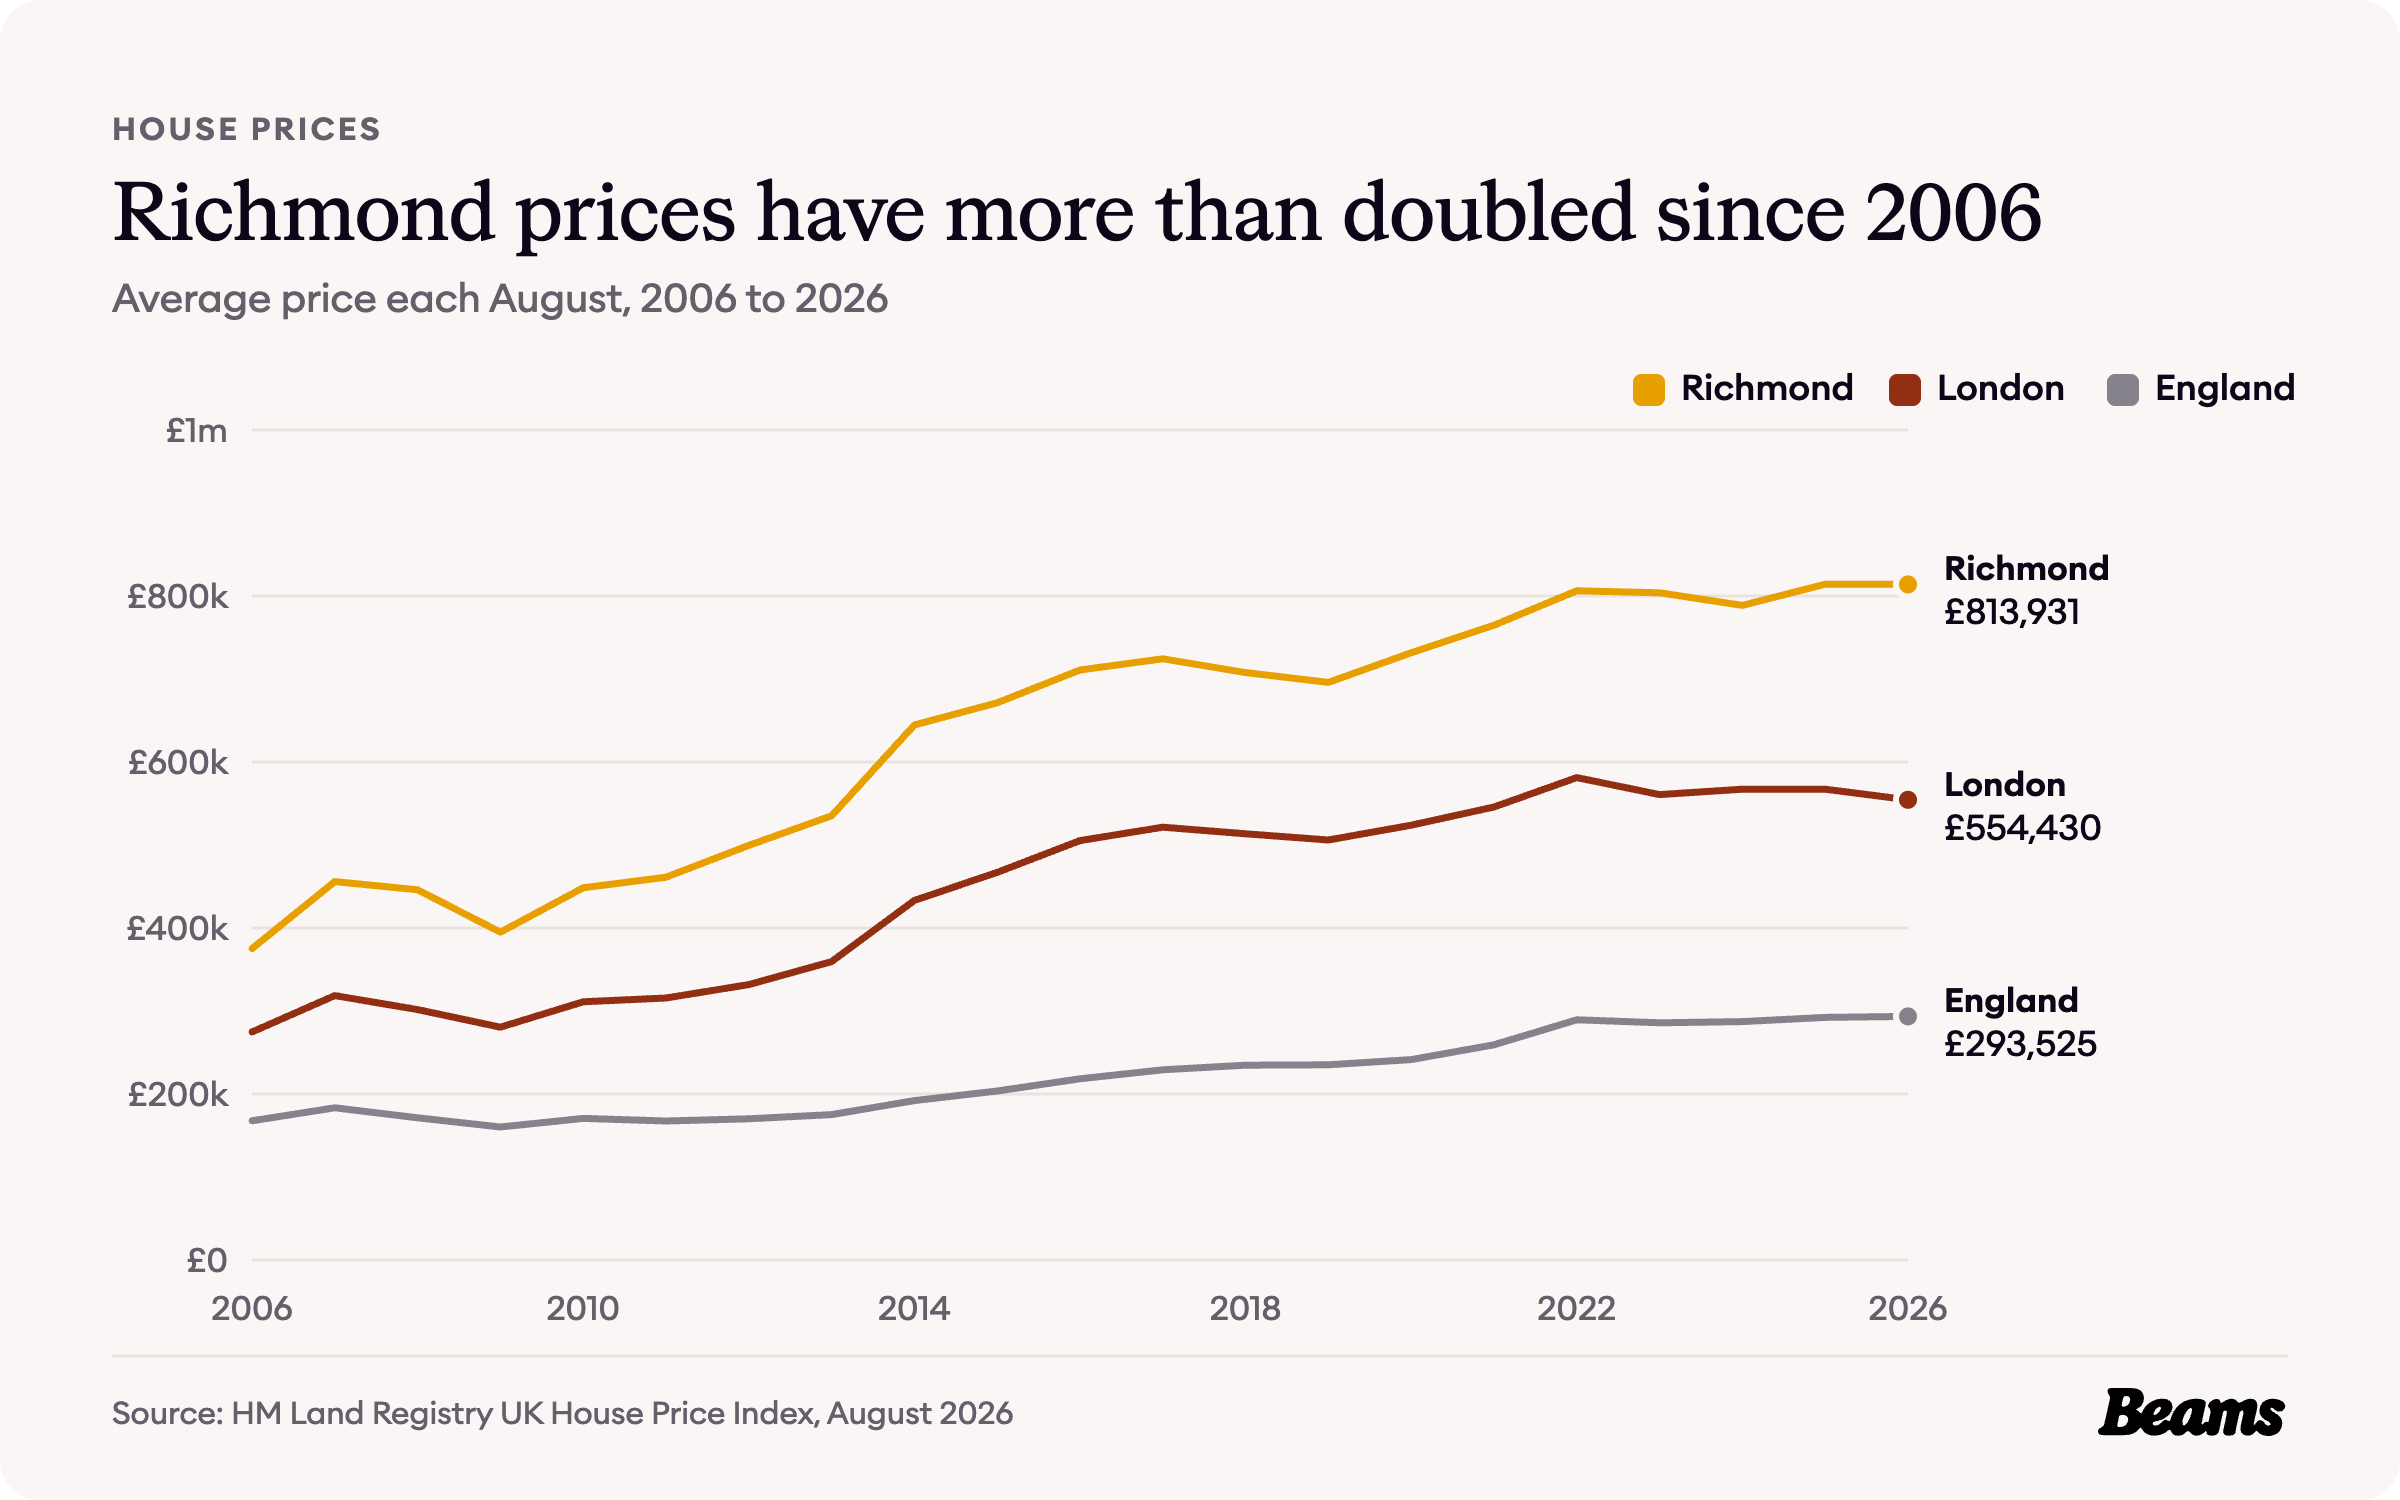
The average home in Richmond upon Thames cost £813,931 in August 2026, unchanged on a year earlier, while London prices fell 2.2% [5]. That is about 47% above the London average of £554,430 and more than two and a half times the England average of £293,525 [6].
The borough has been well above London for the whole of the last 20 years. In August 2006 its average home cost £375,217, against £274,815 for London. The biggest jump came between 2013 and 2014, from £535,300 to £644,541, and the August 2025 figure of £814,270 is the highest in the series [6].
Flats, terraces and the gap between them
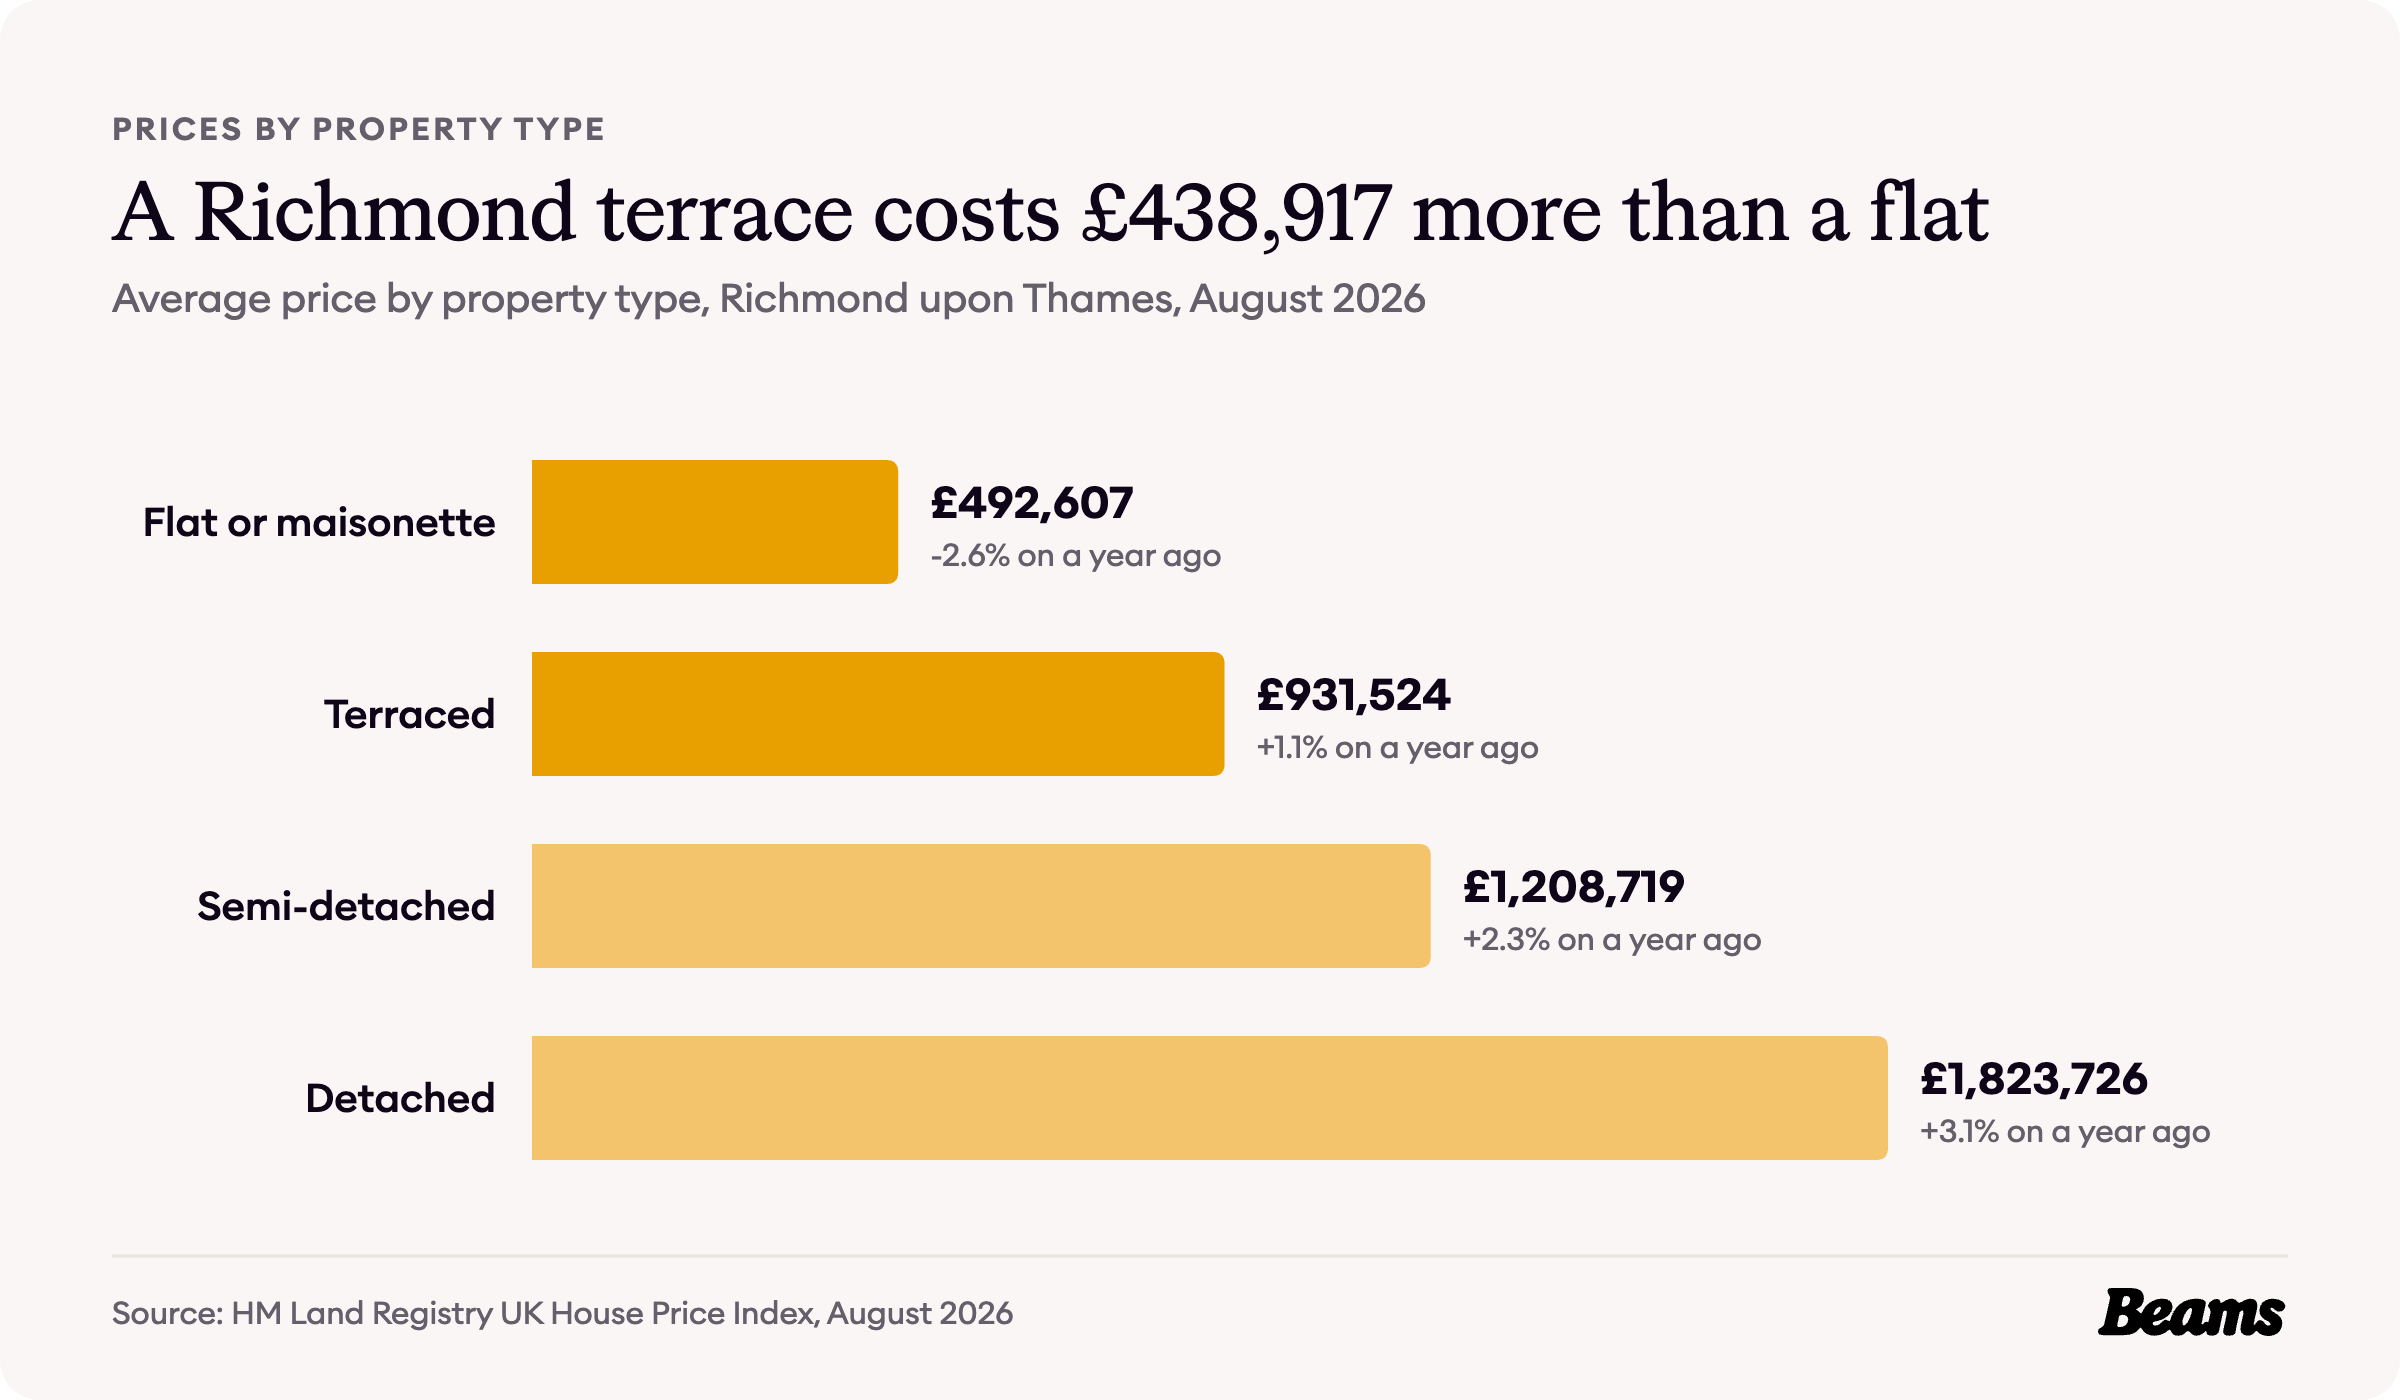
A flat or maisonette averaged £492,607 in August 2026 and a terraced house £931,524, a gap of £438,917 [5]. Semi-detached homes averaged £1,208,719 and detached homes £1,823,726.
Moving up from a terrace to a semi costs another £277,195 on average. For a family already in a terrace, a house extension in Richmond adds room without paying for the next rung of the ladder. First-time buyers paid an average of £643,891 in August 2026, while owners moving home paid £978,315 [5].
What it costs to rent
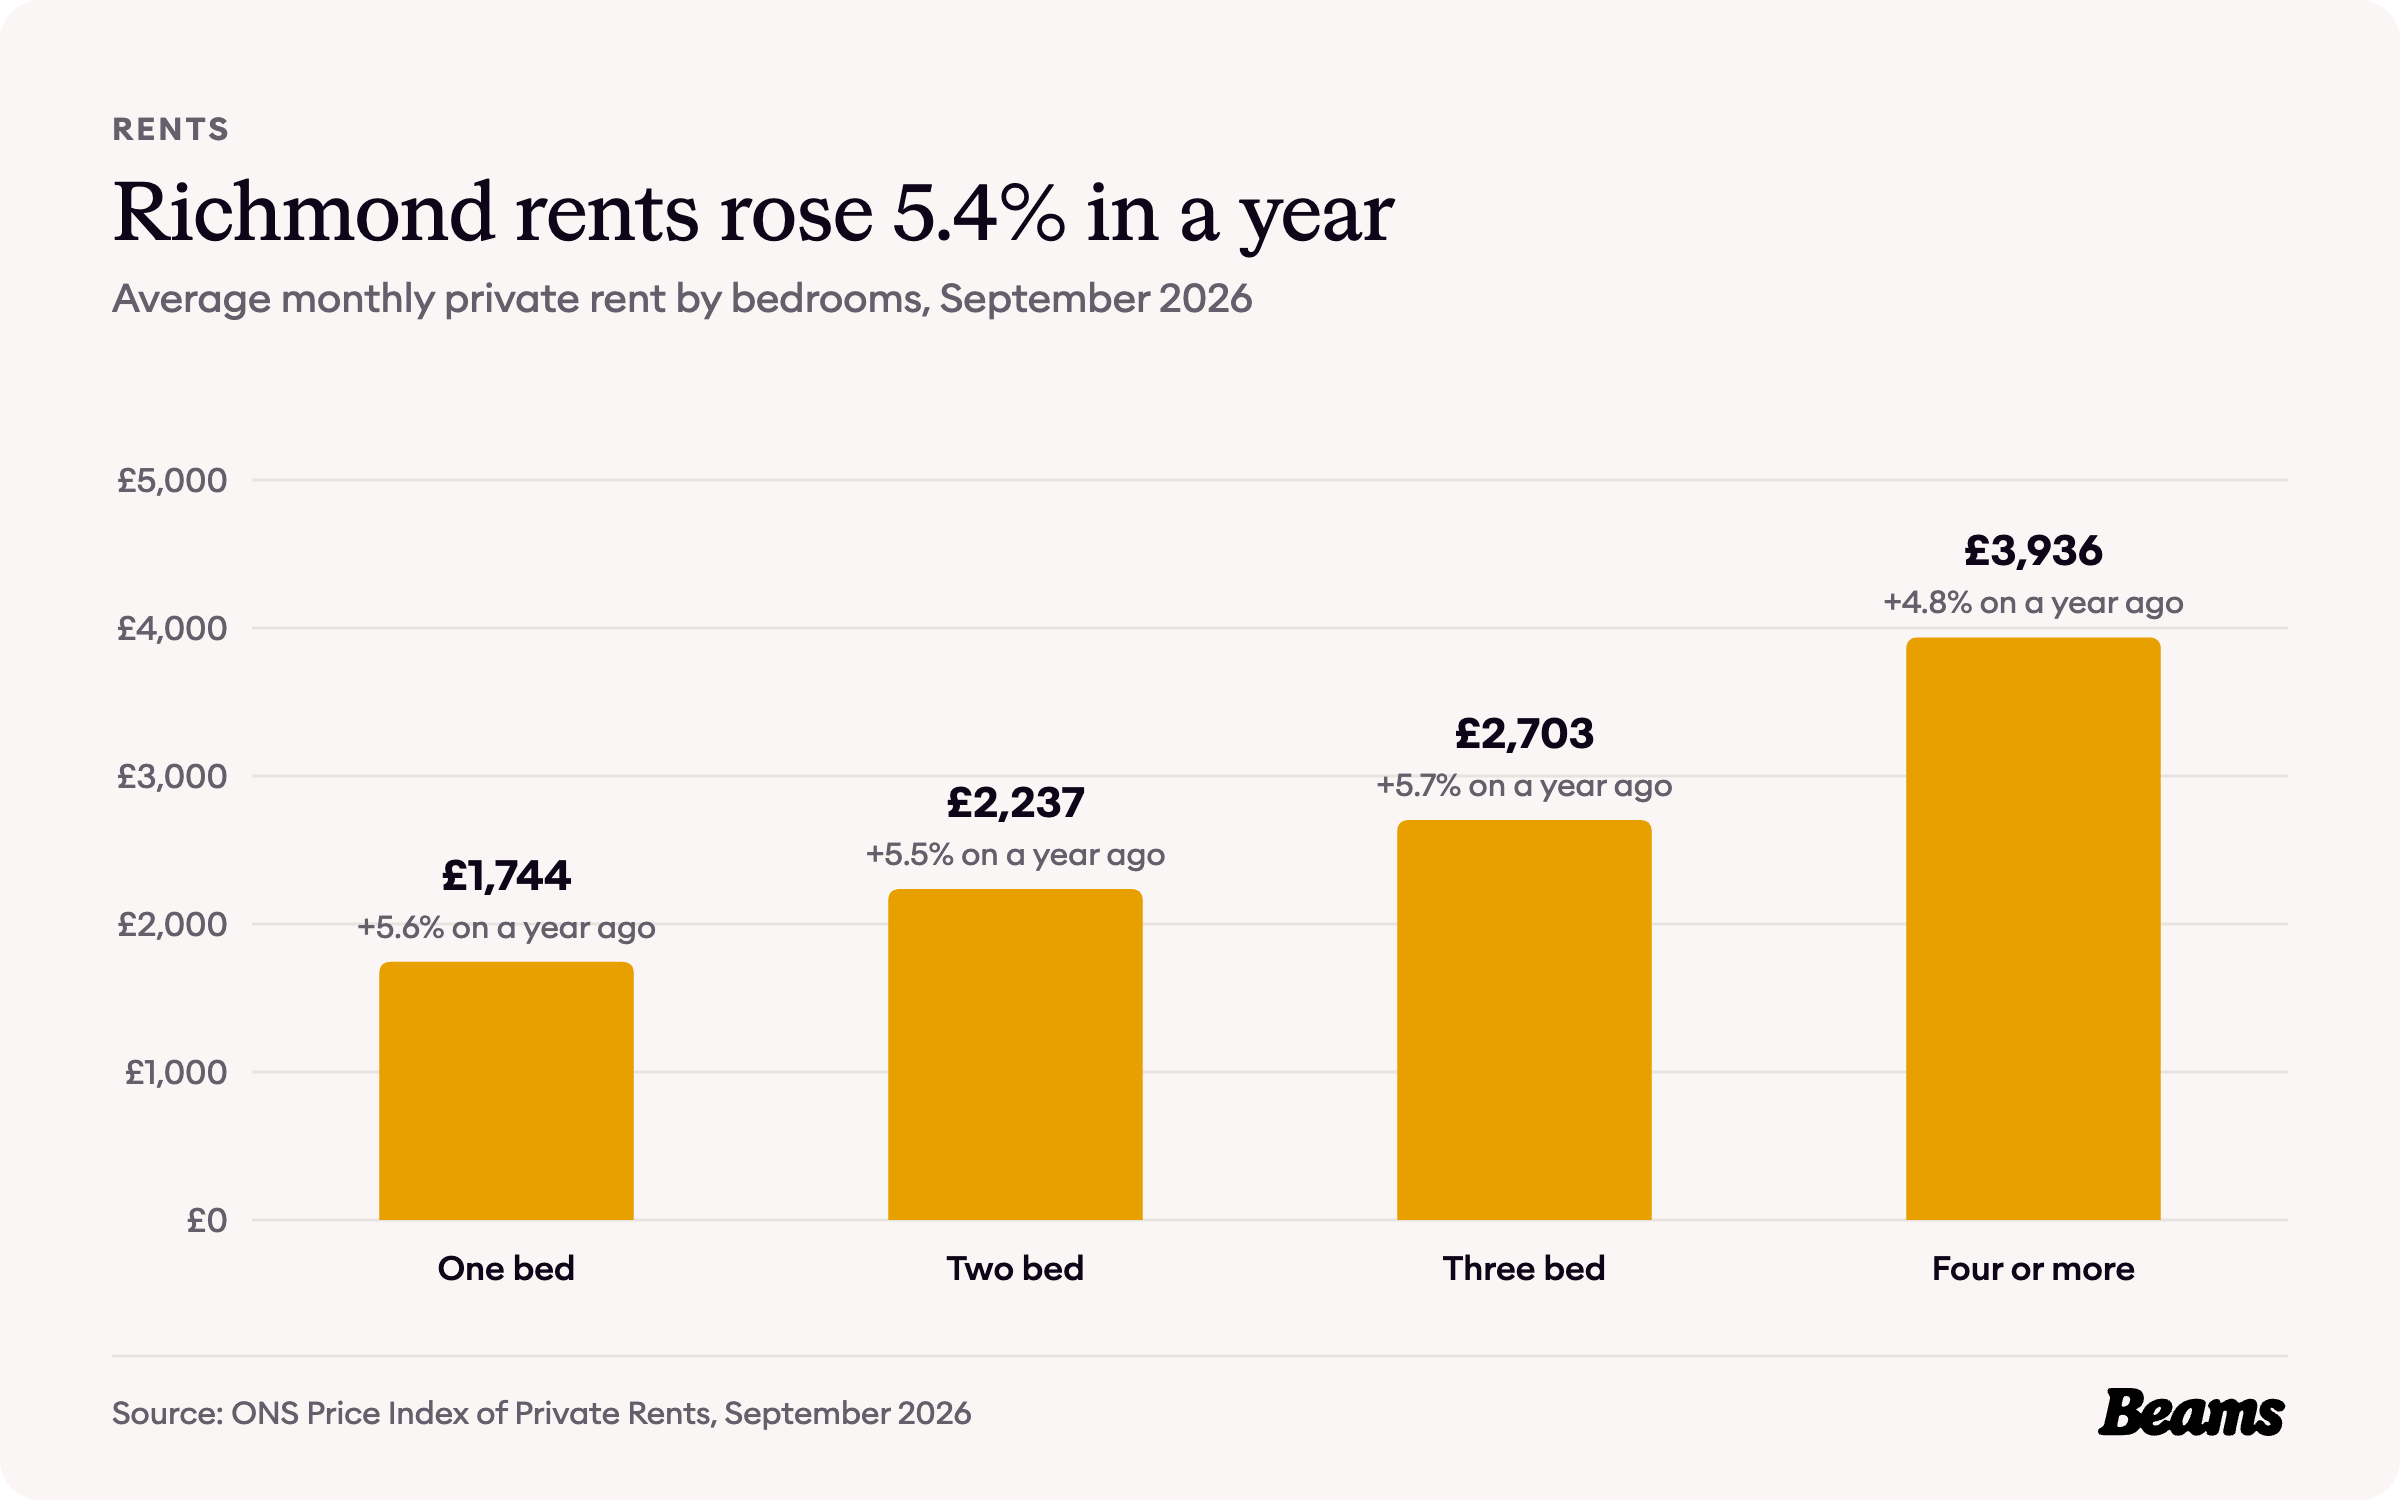
The average private rent in Richmond upon Thames was £2,349 a month in September 2026, up 5.4% on a year earlier [5]. A one-bedroom home averaged £1,744 a month, a three-bedroom home £2,703 and a home with four or more bedrooms £3,936.
With rents rising that fast, landlords have every reason to keep homes in good order, and a dated bathroom is often the first thing a bathroom renovation in Richmond puts right between tenancies.
Council Tax bands
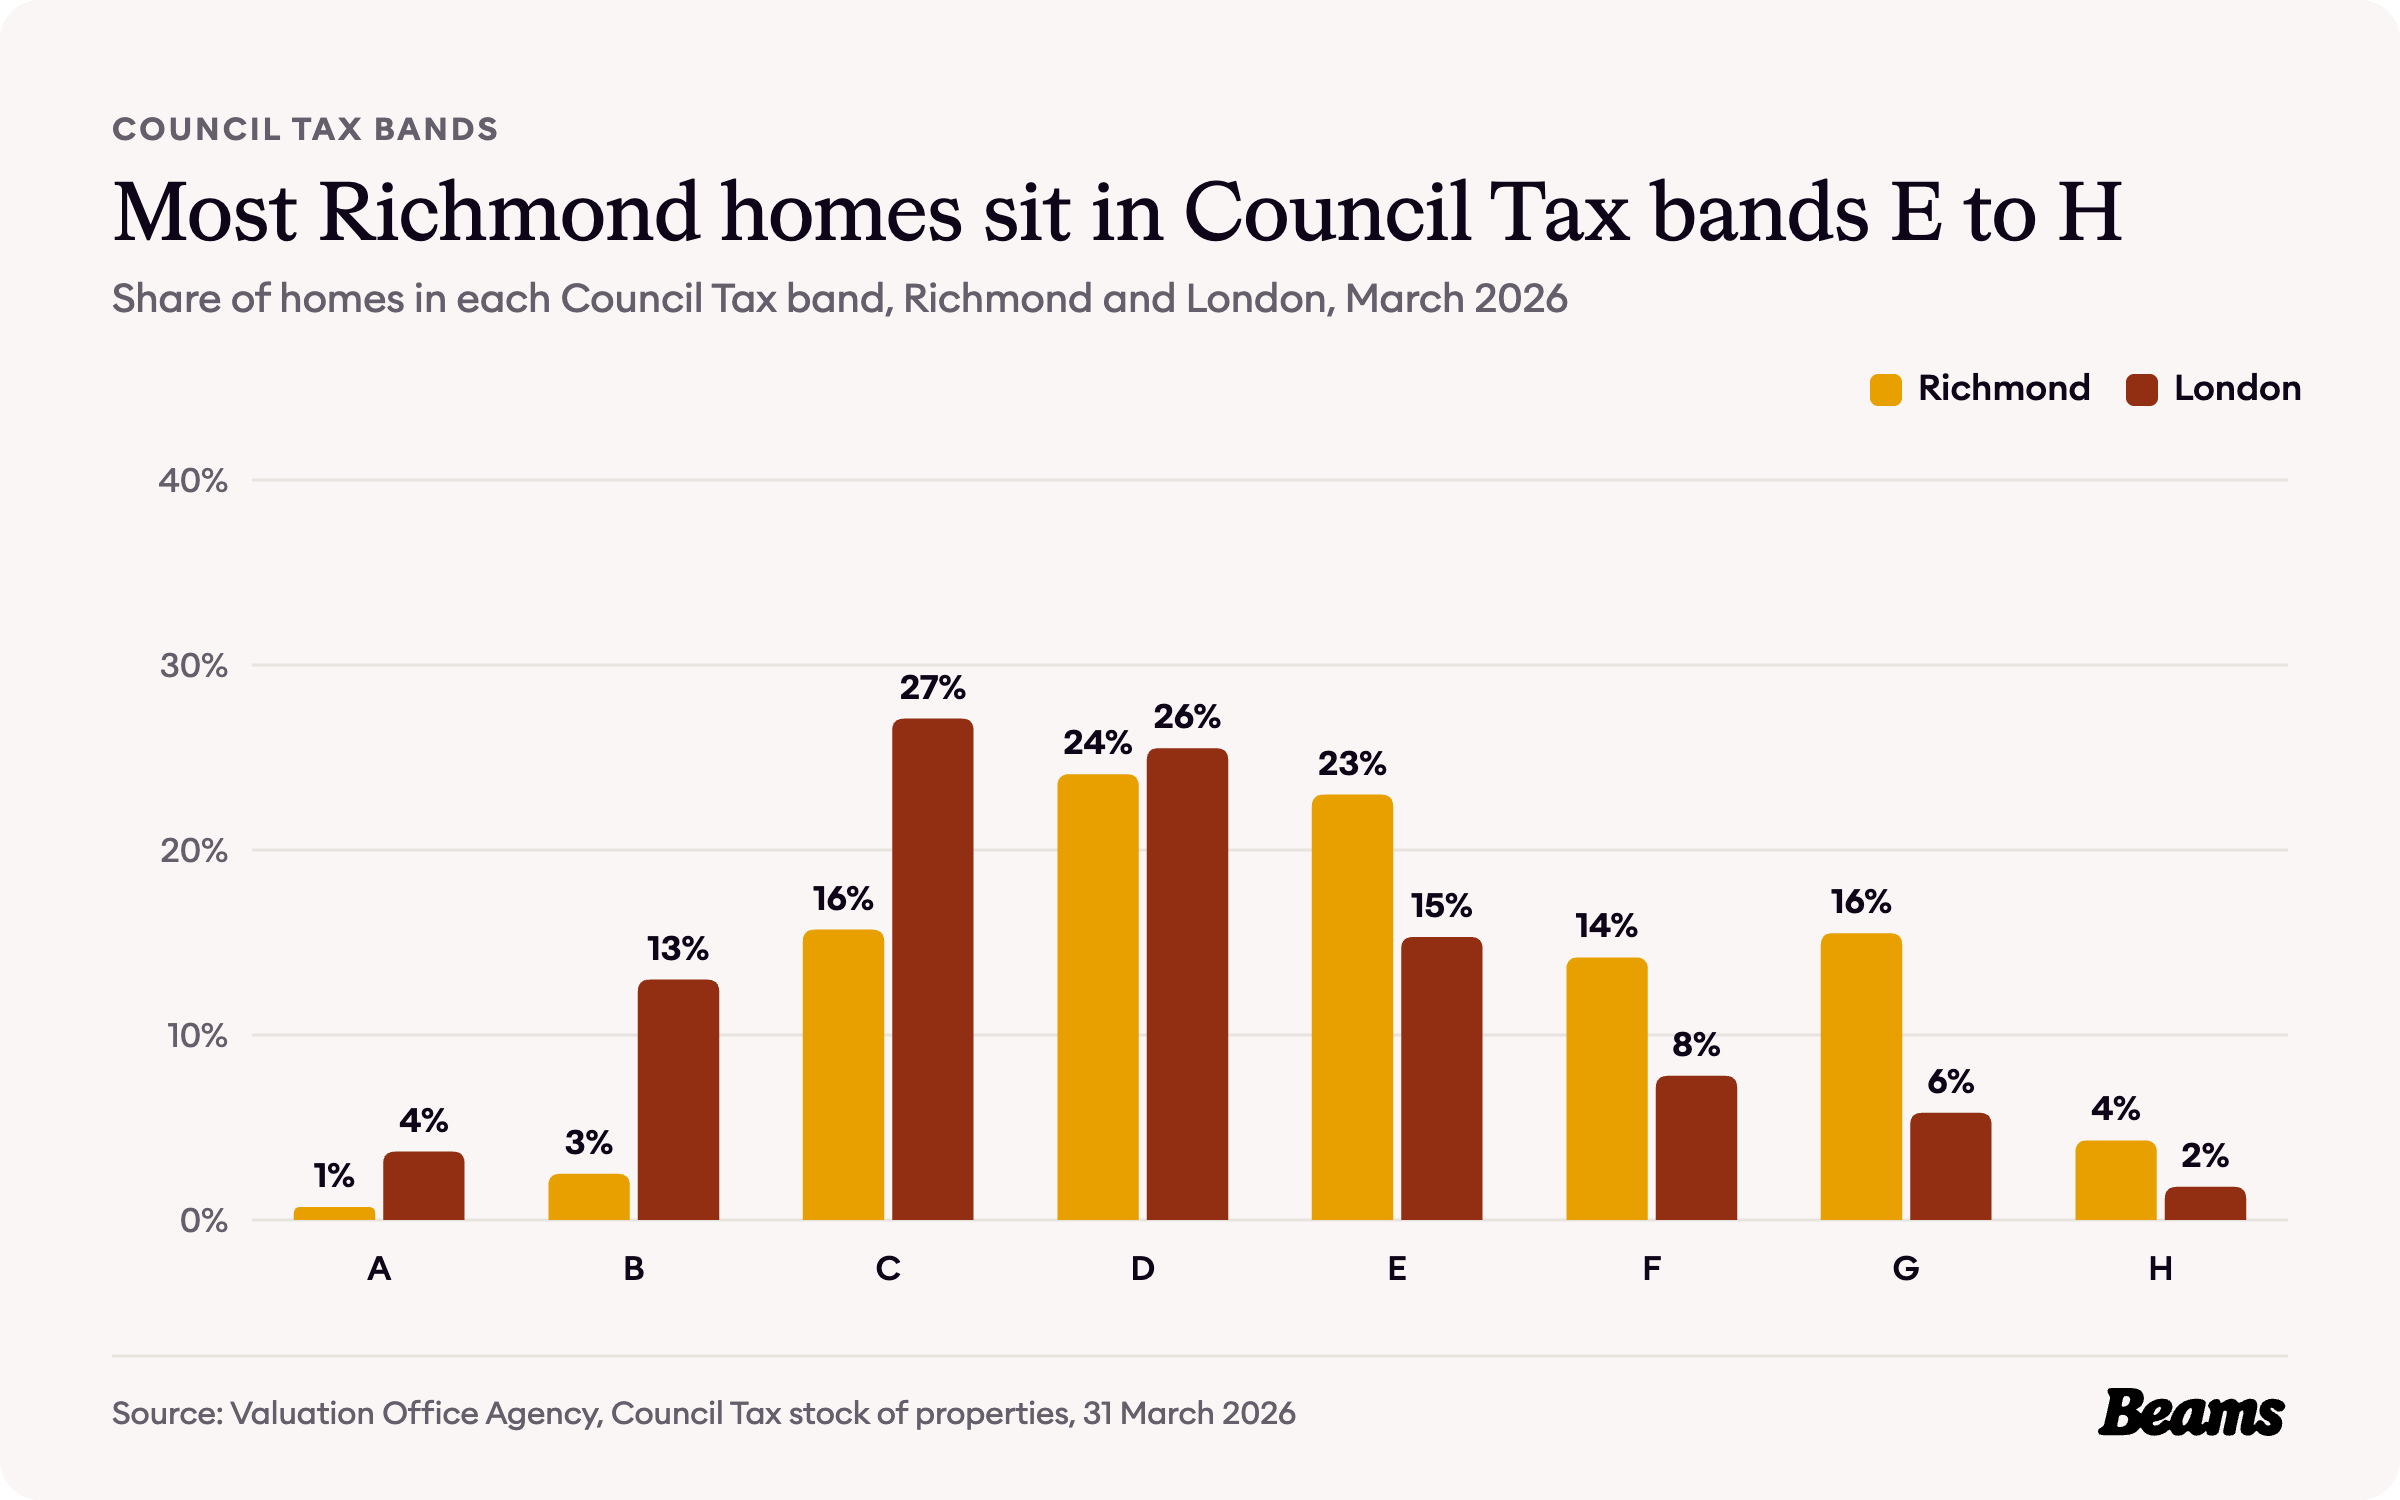
Richmond's homes sit high up the Council Tax scale. 57.0% are in bands E to H, against 30.7% across London, and 34.0% are in bands F to H, more than twice London's 15.4% [2].
Only 3.2% of homes are in bands A and B, compared with 16.7% for London [2]. In larger, higher-value homes like these, interior design in Richmond often makes the biggest difference, settling the layout and finishes before building starts.
The rules on your street
Richmond upon Thames has 85 conservation areas, from former villages to town centres and large open spaces [7]. Inside them, single houses lose permitted development rights for a list of jobs, including enlarging the roof, cladding or rendering walls, dormer windows, front and side extensions, two-storey rear extensions and new windows or doors that look different, so each needs planning permission [7].
Demolishing an unlisted building of 115 cubic metres or more also needs planning permission [7]. Some conservation areas have Article 4 Directions that remove further permitted development rights from single houses, and the council says any home in the borough can be subject to one [7] [8]. Digging down is one of the jobs where these rules matter most, so a basement conversion in Richmond starts with a check of the address.
The council's target is to decide householder and small-scale applications within 8 weeks, and applications for major development within 13 weeks [9]. Our builders in Richmond and planners check what applies to your address before any work begins.
Richmond housing statistics at a glance
- Average house price, August 2026: £813,931 (London £554,430) [5] [6]
- Change on a year earlier: 0.0% (London -2.2%) [5] [6]
- Average flat or maisonette: £492,607 (London £427,310) [5] [6]
- Average terraced house: £931,524 (London £648,650) [5] [6]
- Average private rent, September 2026: £2,349 a month [5]
- Homes built 1900 to 1918: 17.5% (London 8.2%) [2]
- Homes built since 2000: 8.6% (London 18.5%) [2]
- Households living in a house: 59.9% (London 46.0%) [3]
- Households who own their home: 62.4% (London 45.2%) [4]
- Conservation areas: 85 [7]
Frequently asked questions
References
- British History Online, Parishes: Richmond (anciently Sheen). Victoria County History of Surrey, volume 3, 1911.
- Valuation Office Agency, Council Tax: stock of properties 2026. Properties by build period and by Council Tax band at 31 March 2026, Richmond upon Thames and London.
- ONS, Census 2021 table TS044: Accommodation type. Households by type of home, Richmond upon Thames and London.
- ONS, Census 2021 table TS054: Tenure. Households by tenure, Richmond upon Thames and London.
- ONS, Housing prices in Richmond upon Thames. UK House Price Index for August 2026 and Price Index of Private Rents for September 2026, published 21 October 2026.
- HM Land Registry, UK House Price Index. Average prices for Richmond upon Thames, London and England, August 2006 to August 2026.
- Richmond Council, Conservation areas: frequently asked questions. Number of conservation areas and the controls that apply in them. Accessed 29 October 2026.
- Richmond Council, Article 4 Directions: conservation areas. Article 4 Directions in the borough. Accessed 29 October 2026.
- Richmond Council, Make a planning application. Target decision times. Accessed 29 October 2026.
Thinking of improving rather than moving?
Tell us about your Richmond home and what you want to change. We'll give you a free estimate, then up to three vetted builders quote against the same specification.