
Muswell Hill housing statistics 2026
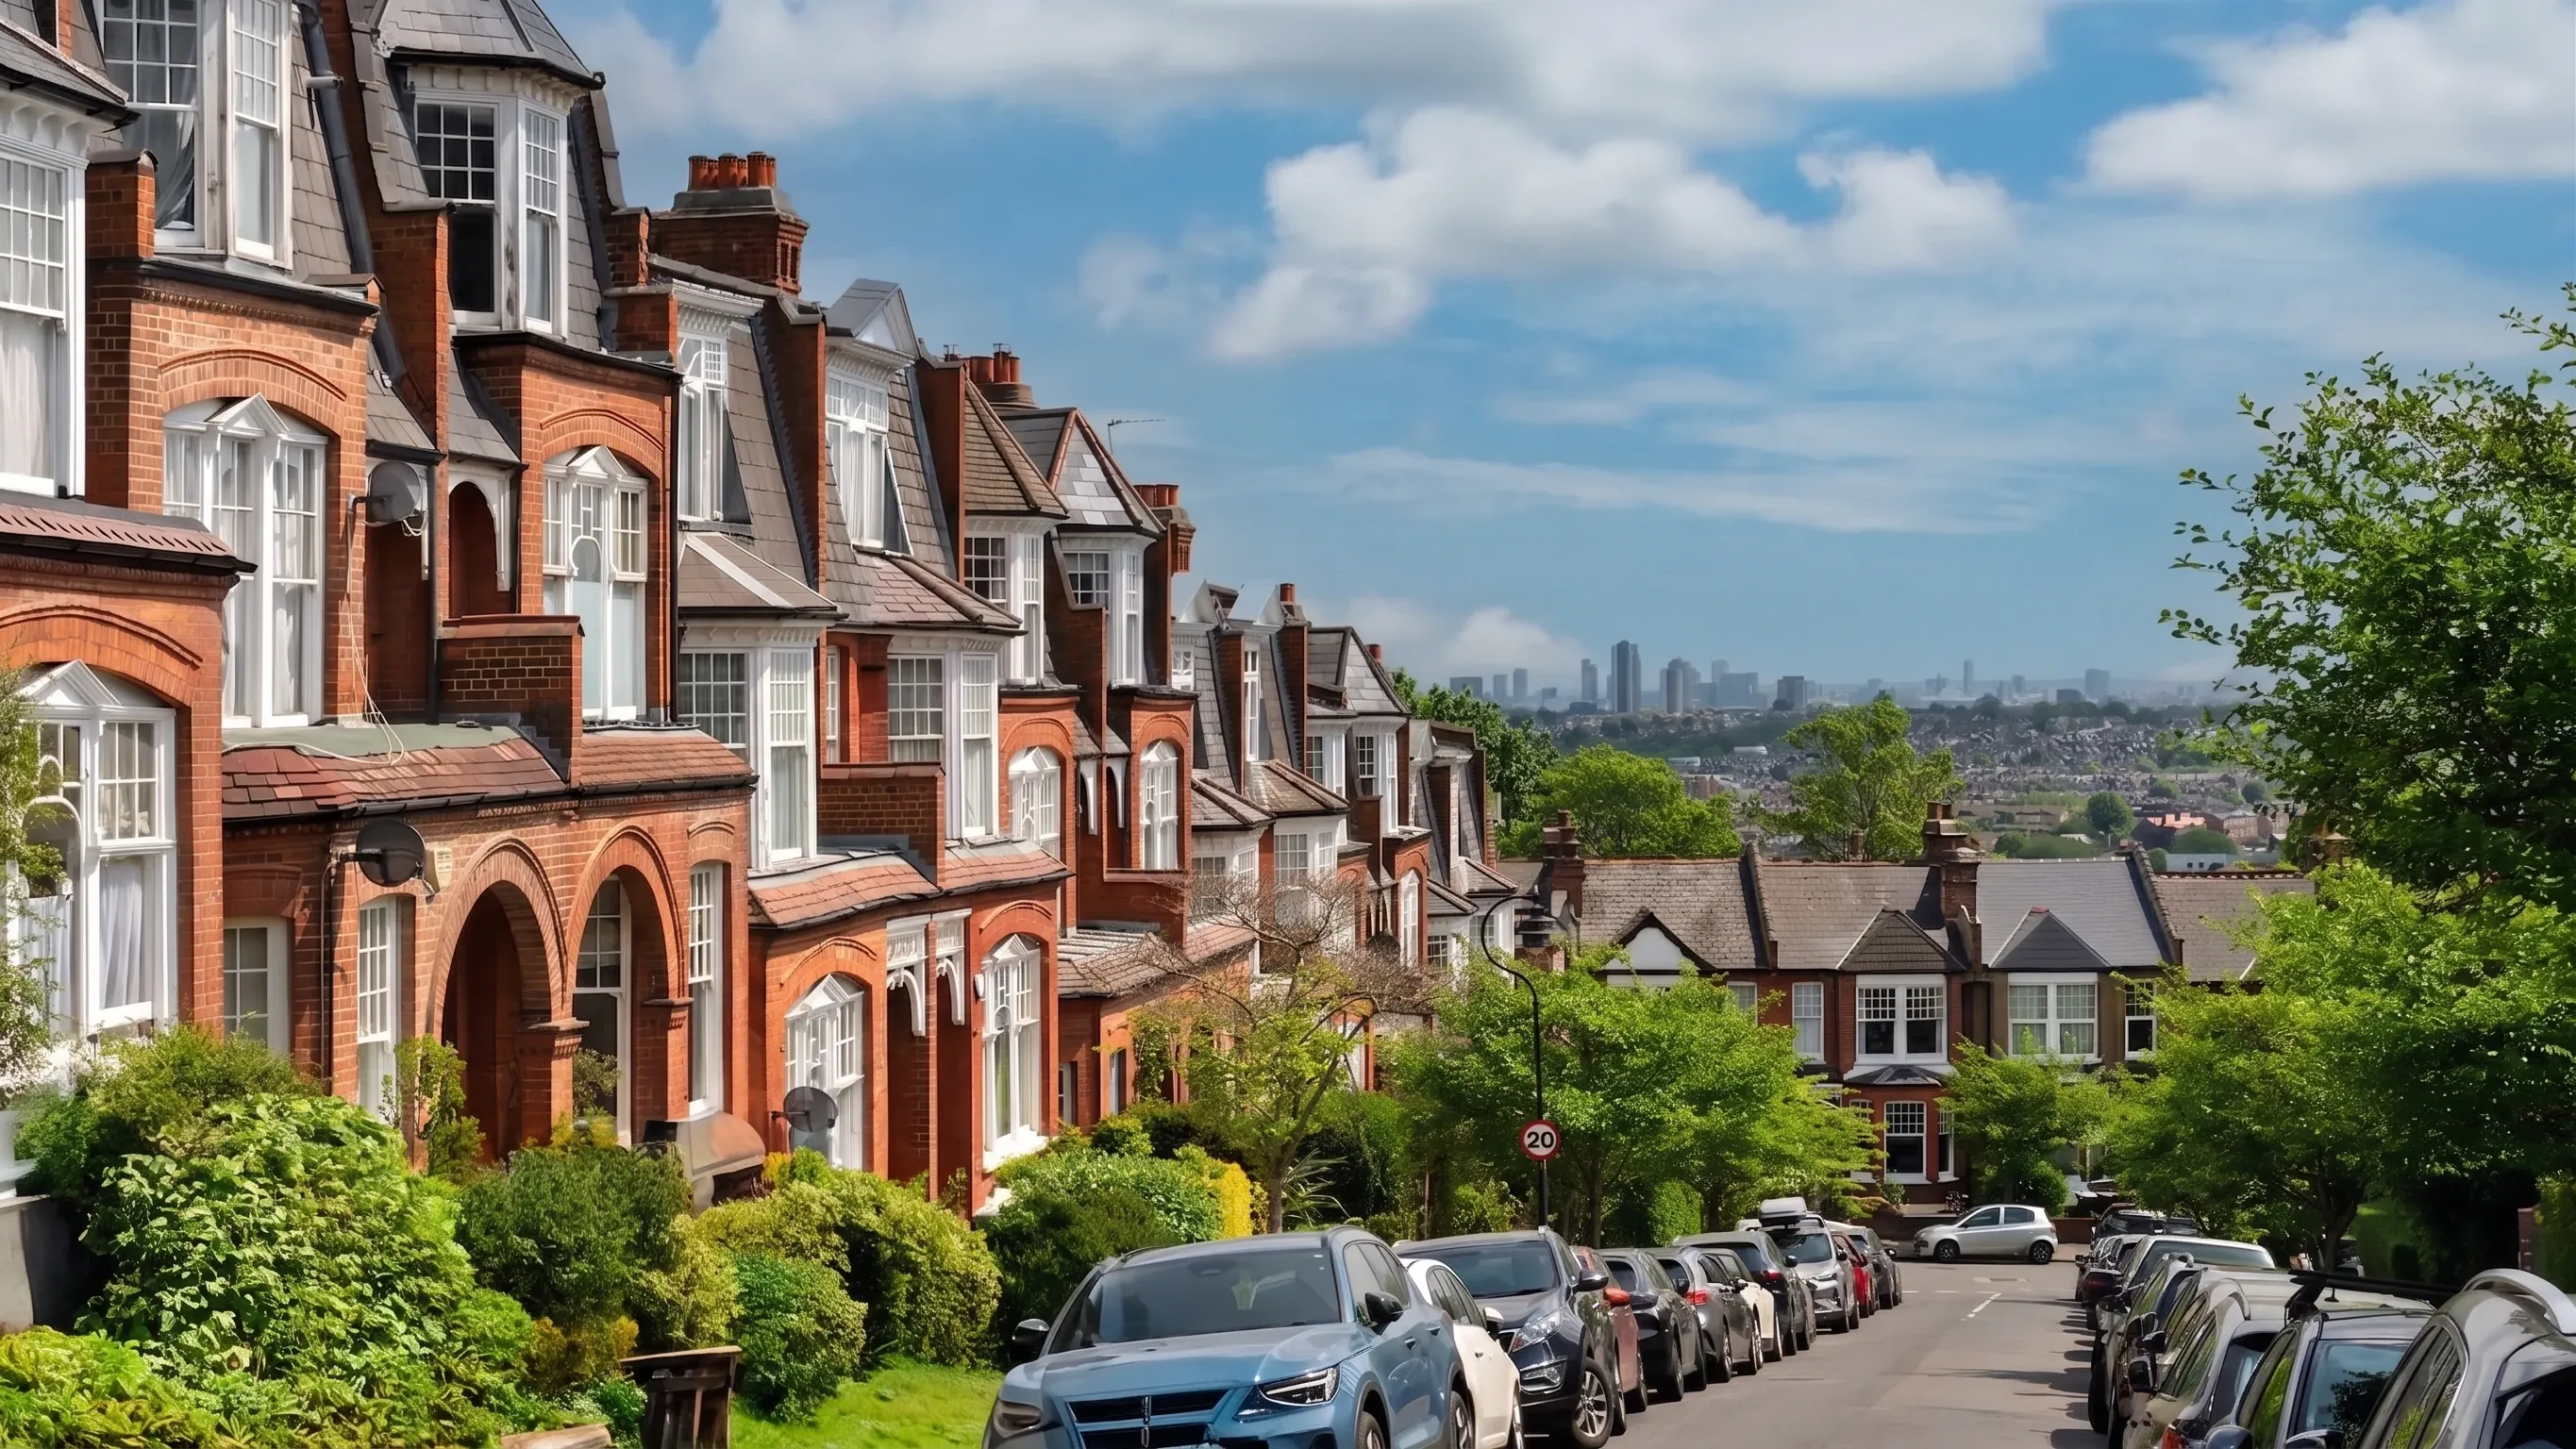
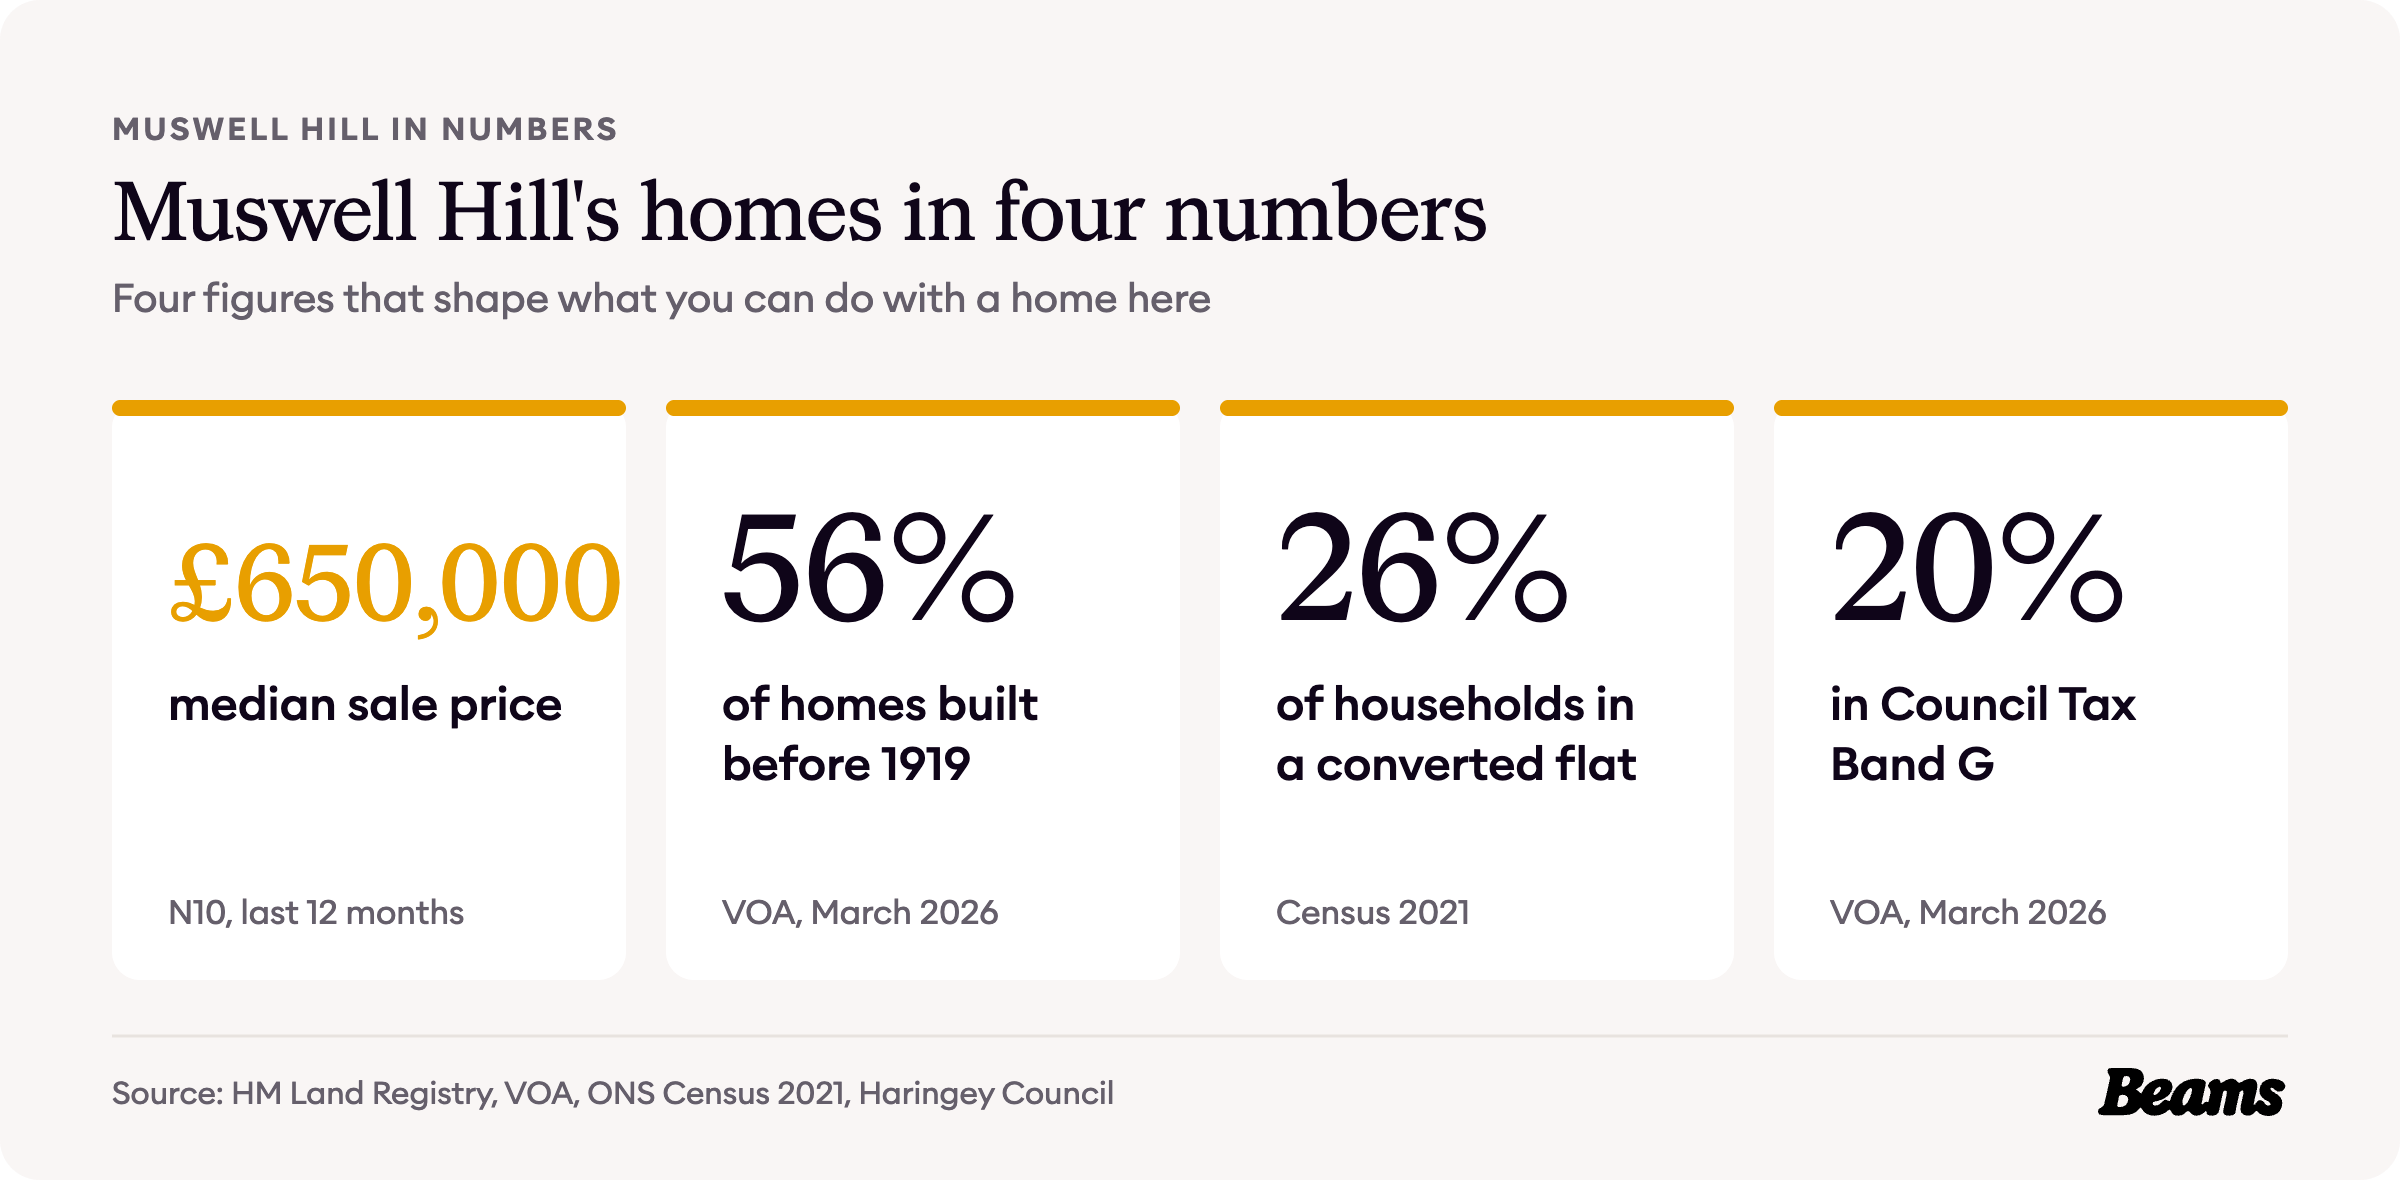
Muswell Hill was built almost in one go. Most of its streets and buildings went up in less than 20 years, between 1896 and 1913, and more than half of its homes still date from before 1919. Many of those Edwardian houses have since been split into flats, and a terraced house in N10 now sells for a median of £1,436,000.
Every figure comes from an official source and is dated, so you can see exactly what you are working with before you plan a home renovation in Muswell Hill. The sources are numbered in brackets and listed in full at the end of the page.
When Muswell Hill was built
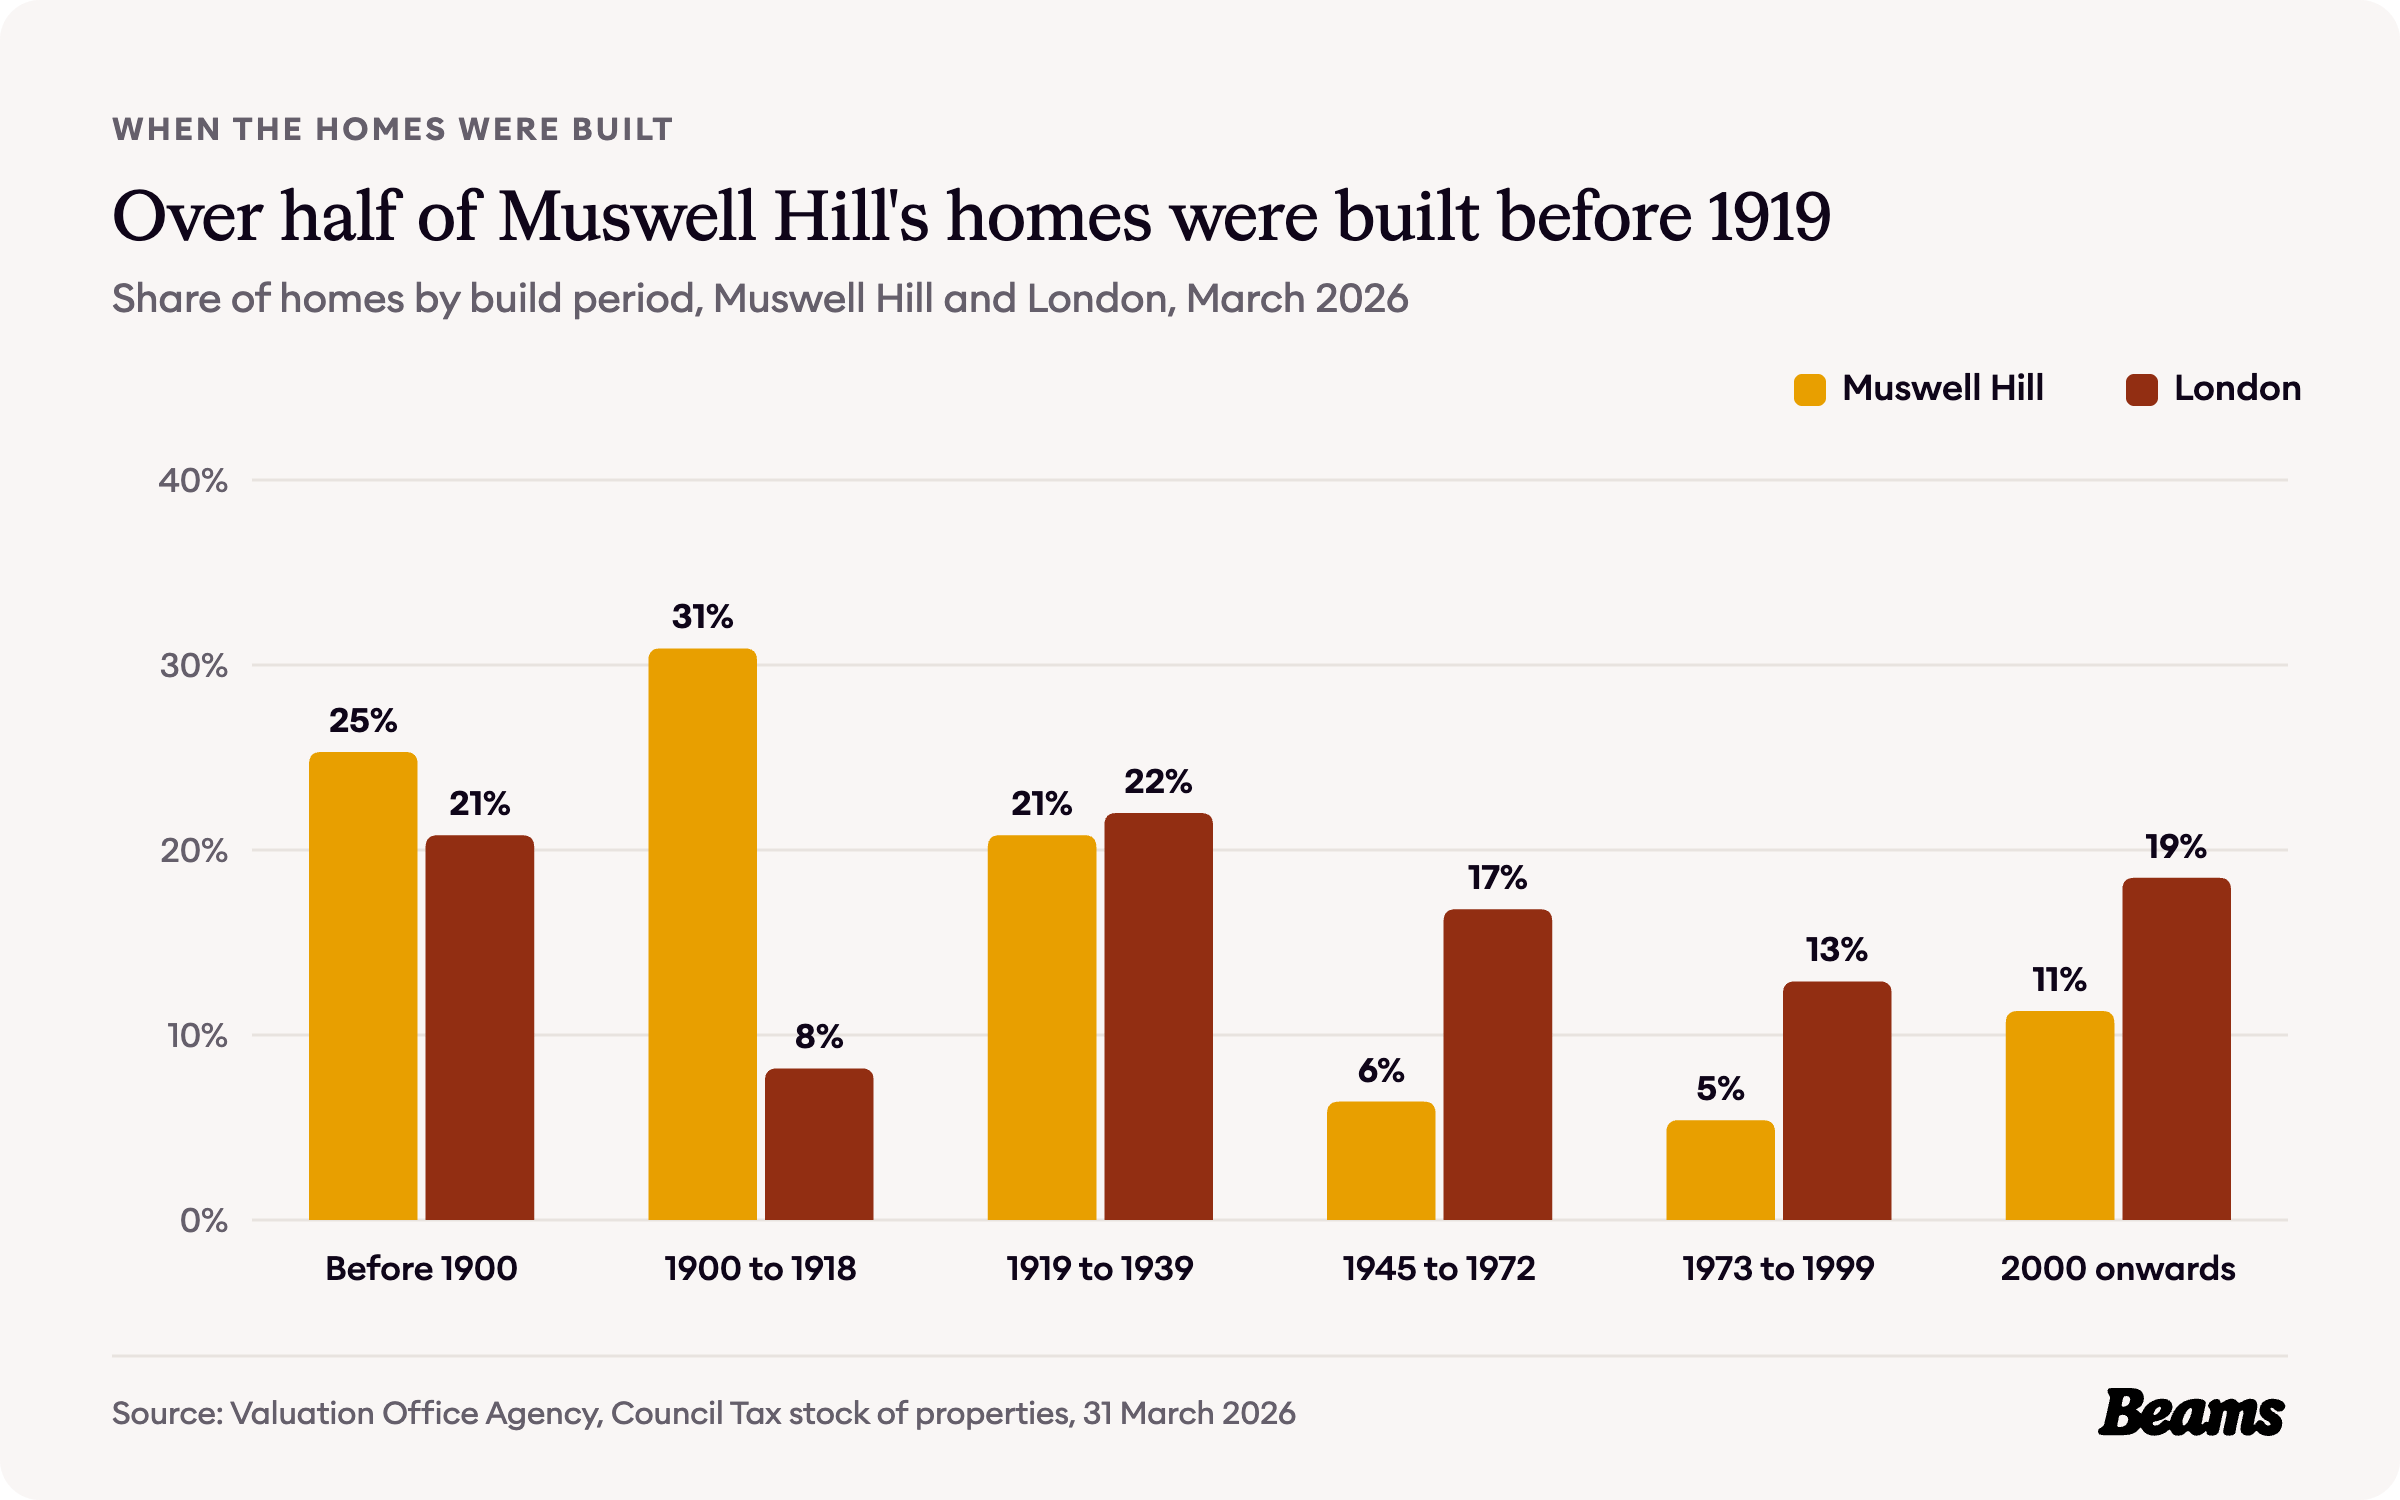
Haringey Council describes Muswell Hill as an essentially Edwardian suburb. The majority of its buildings and streets were laid out over a period of less than 20 years, from 1896 to 1913 [1].
It happened fast. In 1896 Muswell Hill was still a place where the rich built their seats, and that year the builders James Edmondson & Son bought the Limes, whose grounds stretched to Fortis Green, and laid out Queen's Avenue. By 1911 Muswell Hill had 11,391 inhabitants, and by 1920 almost the whole area was built over [2].
The Valuation Office Agency figures for the three census small areas that make up Muswell Hill show how much of that survives. Of their 8,970 homes, 30.9% were built between 1900 and 1918, against 8.2% across London, and another 25.3% before 1900. That puts 56.2% of Muswell Hill's homes before 1919, nearly twice London's 29.0% [3].
Very little was added after the Second World War. Just 6.4% of homes date from 1945 to 1972 and 5.4% from 1973 to 1999 [3]. Those Edwardian terraces, with their pitched roofs and unused roof space, are the classic starting point for a loft conversion in Muswell Hill.
How Muswell Hill households live
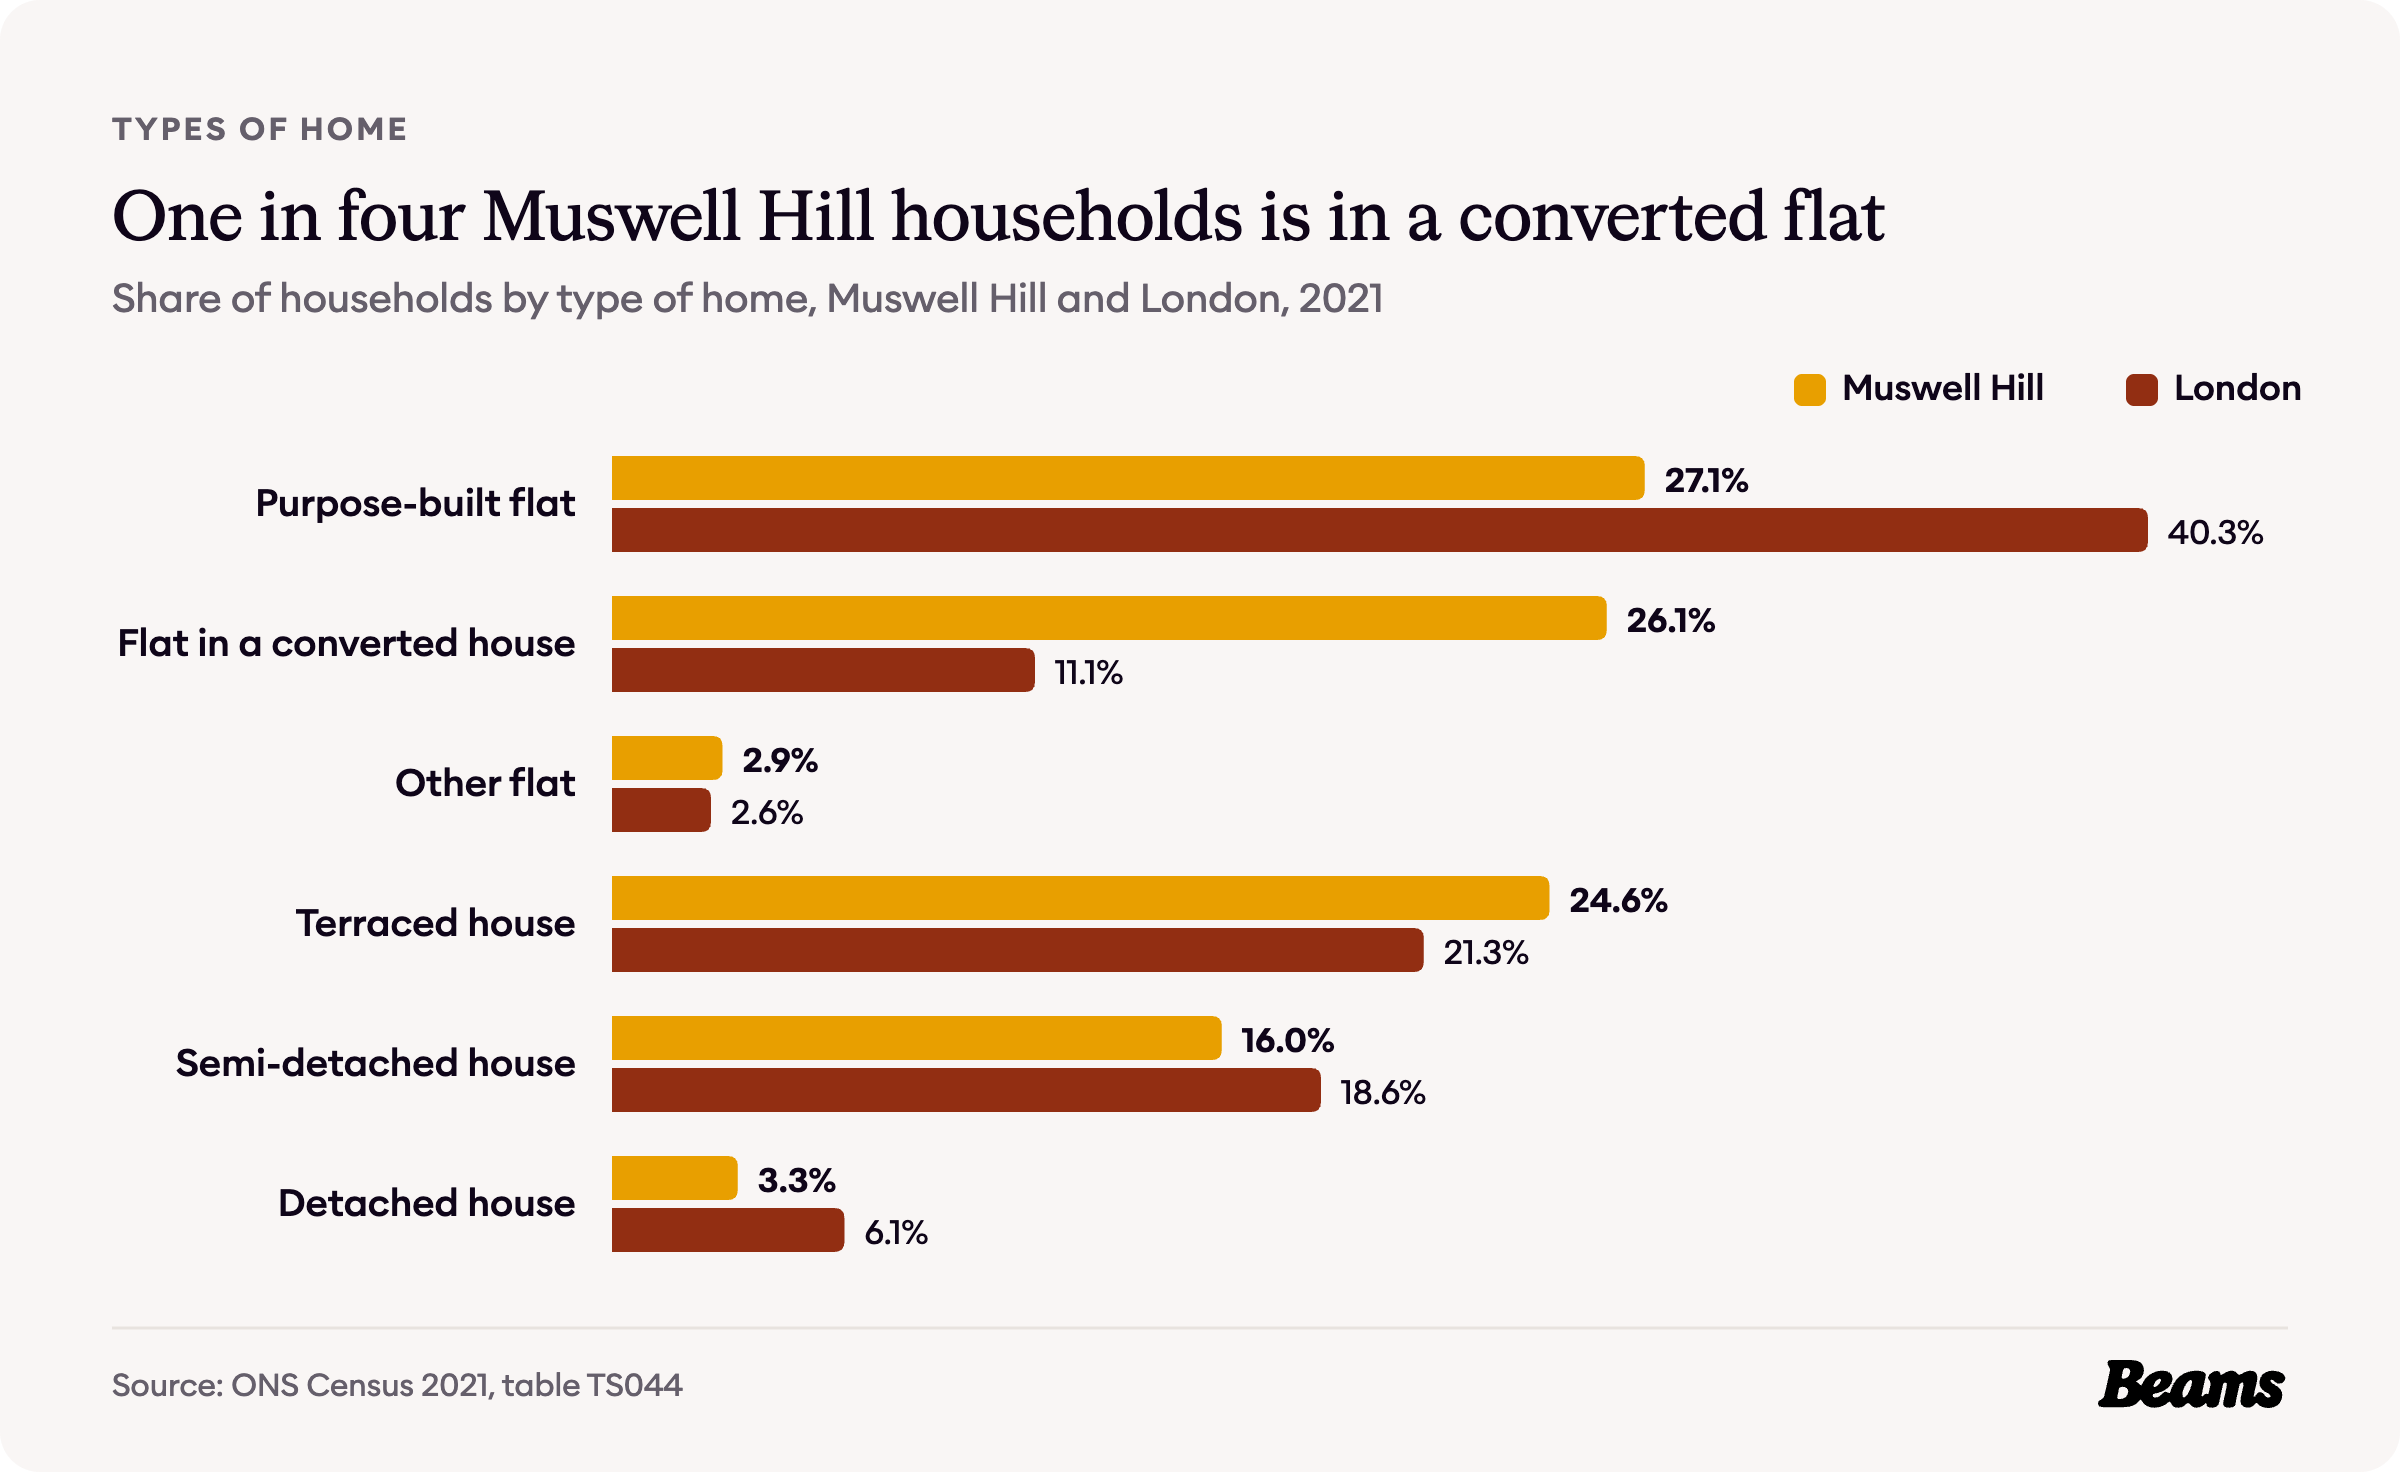
The 2021 Census found 56.1% of Muswell Hill households living in a flat, close to London's 54.0%. What stands out is the kind of flat. 26.1% of households live in a flat inside a converted house, more than twice London's 11.1% [4].
Those conversions are not new. The Victoria County History records that many large houses here were subdivided or replaced, particularly in Colney Hatch Lane [2]. When the council first designated the Muswell Hill conservation area in 1974, it noted that apart from demand to convert houses into flats, pressure for development was moderate [1].
Another 24.6% of households live in a terraced house, against 21.3% across London [4]. In a flat carved out of an Edwardian house, a kitchen renovation in Muswell Hill is usually about getting more from the same floor area.
Who owns Muswell Hill's homes
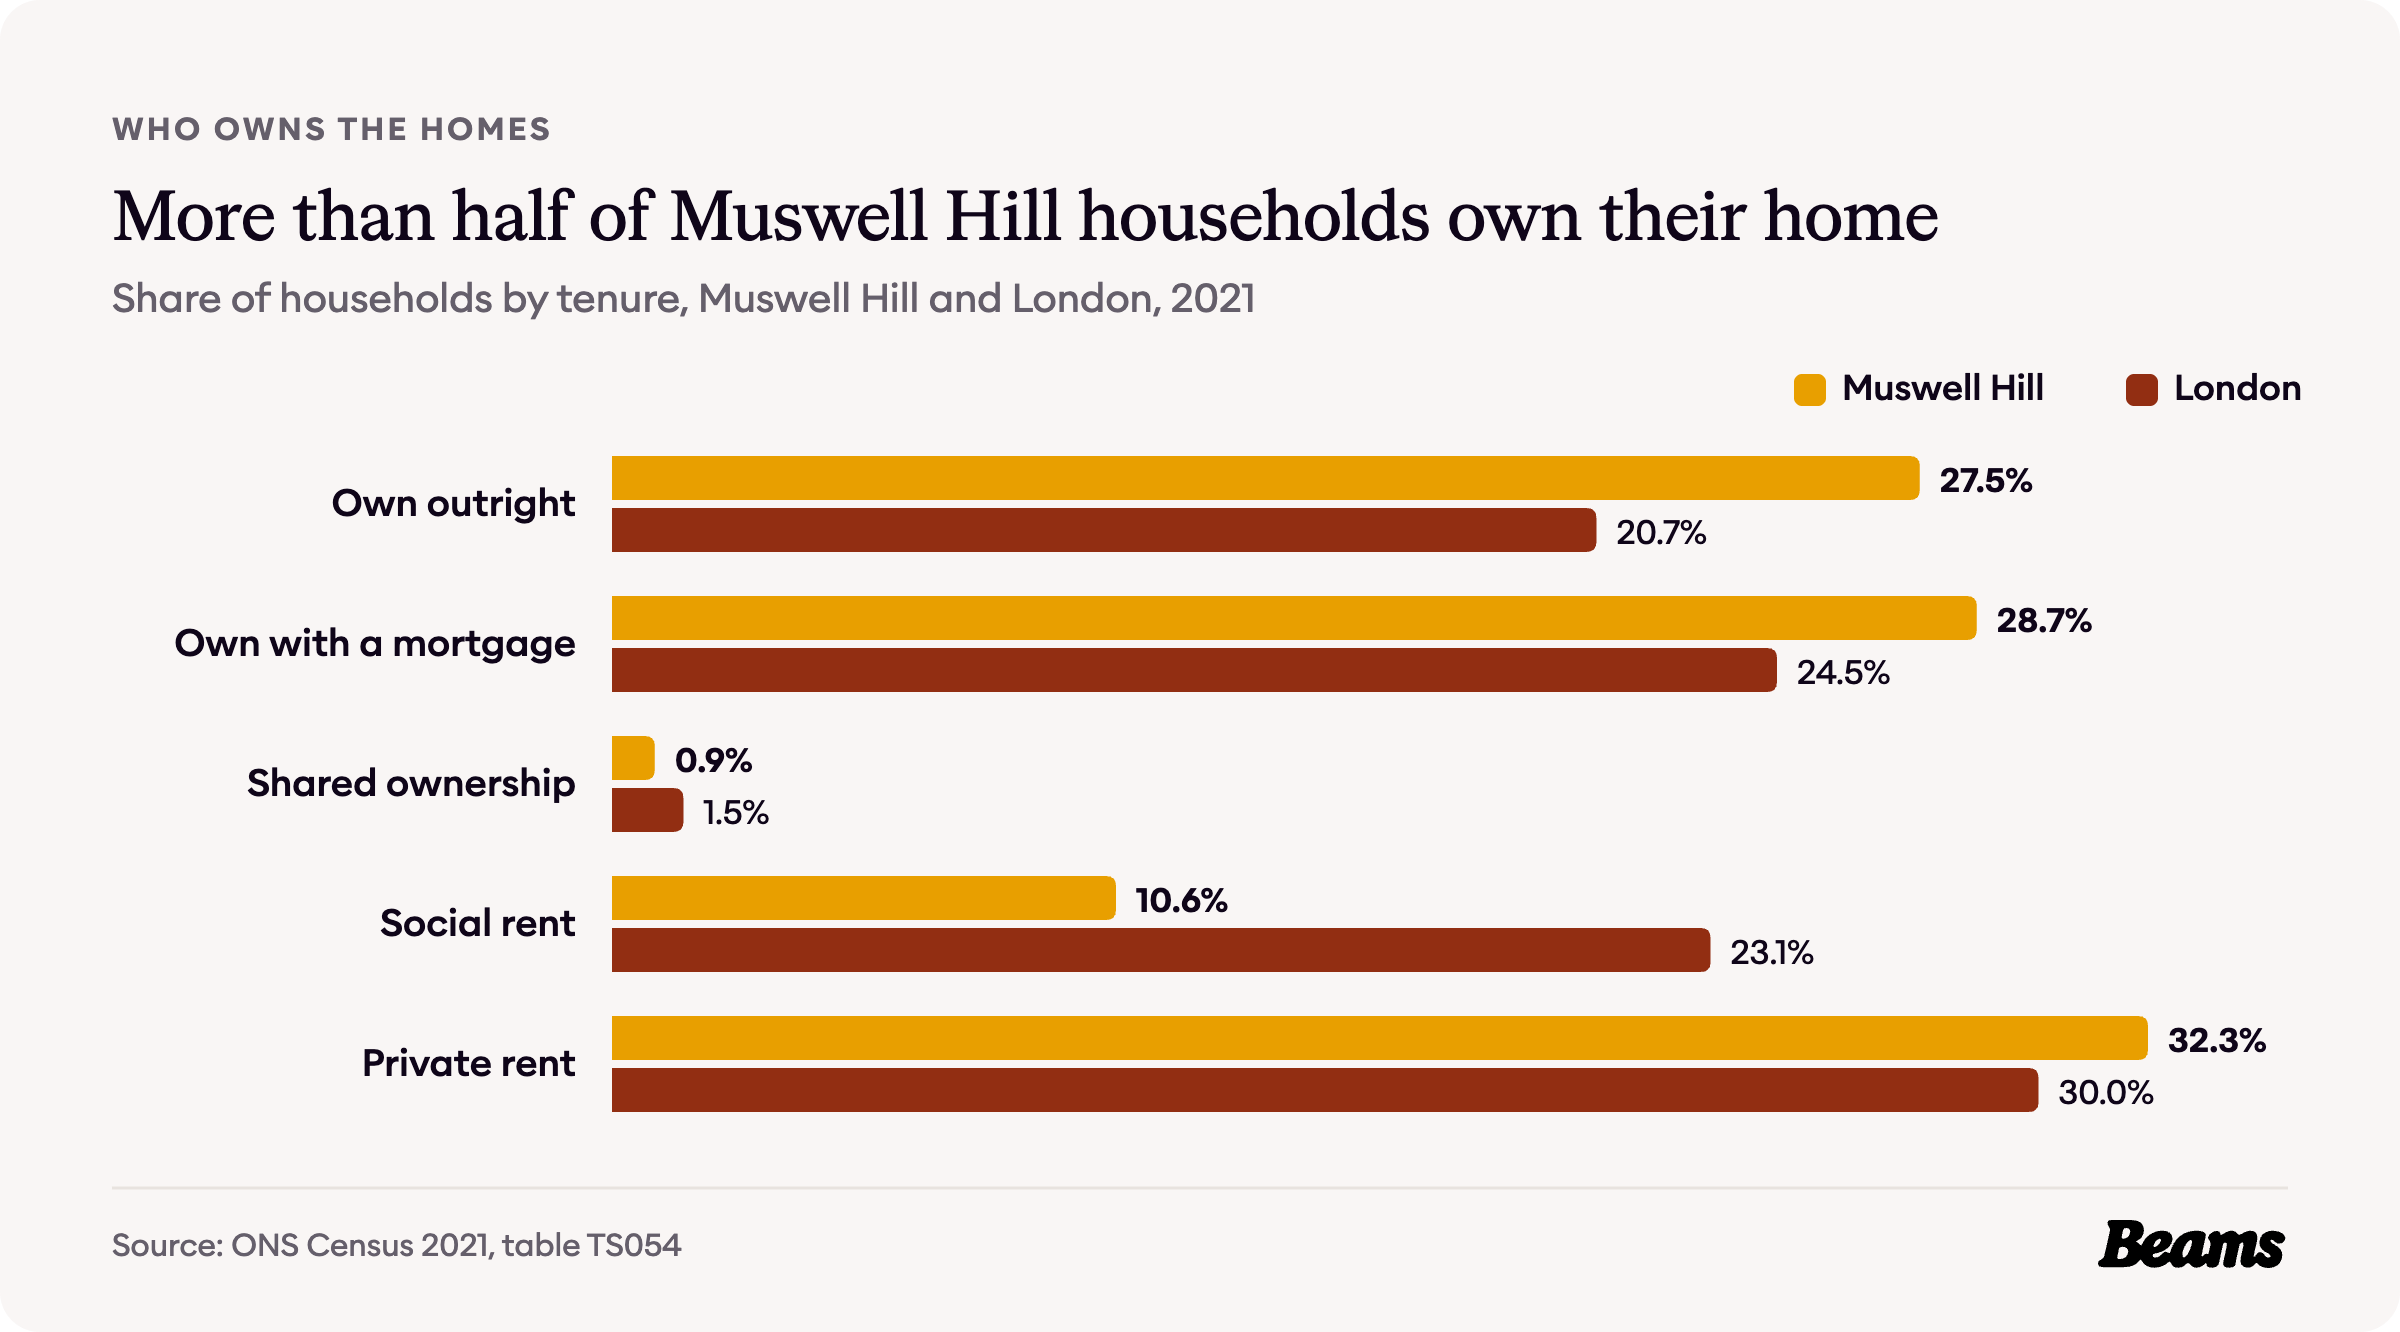
Muswell Hill is a neighbourhood of owners. 27.5% of households own outright and 28.7% with a mortgage, 56.2% in all, against 45.2% across London [5].
Social renting is rare by London standards, at 10.6% of households against 23.1%, while 32.3% rent privately, a little above London's 30.0% [5].
What a Muswell Hill home costs
One thing to know first. The UK House Price Index and rent figures on this page cover the whole borough of Haringey. The census and VOA figures cover the Muswell Hill North, Fortis Green & Coldfall and Muswell Hill South small areas, and the sale prices further down cover the N10 postcode district.
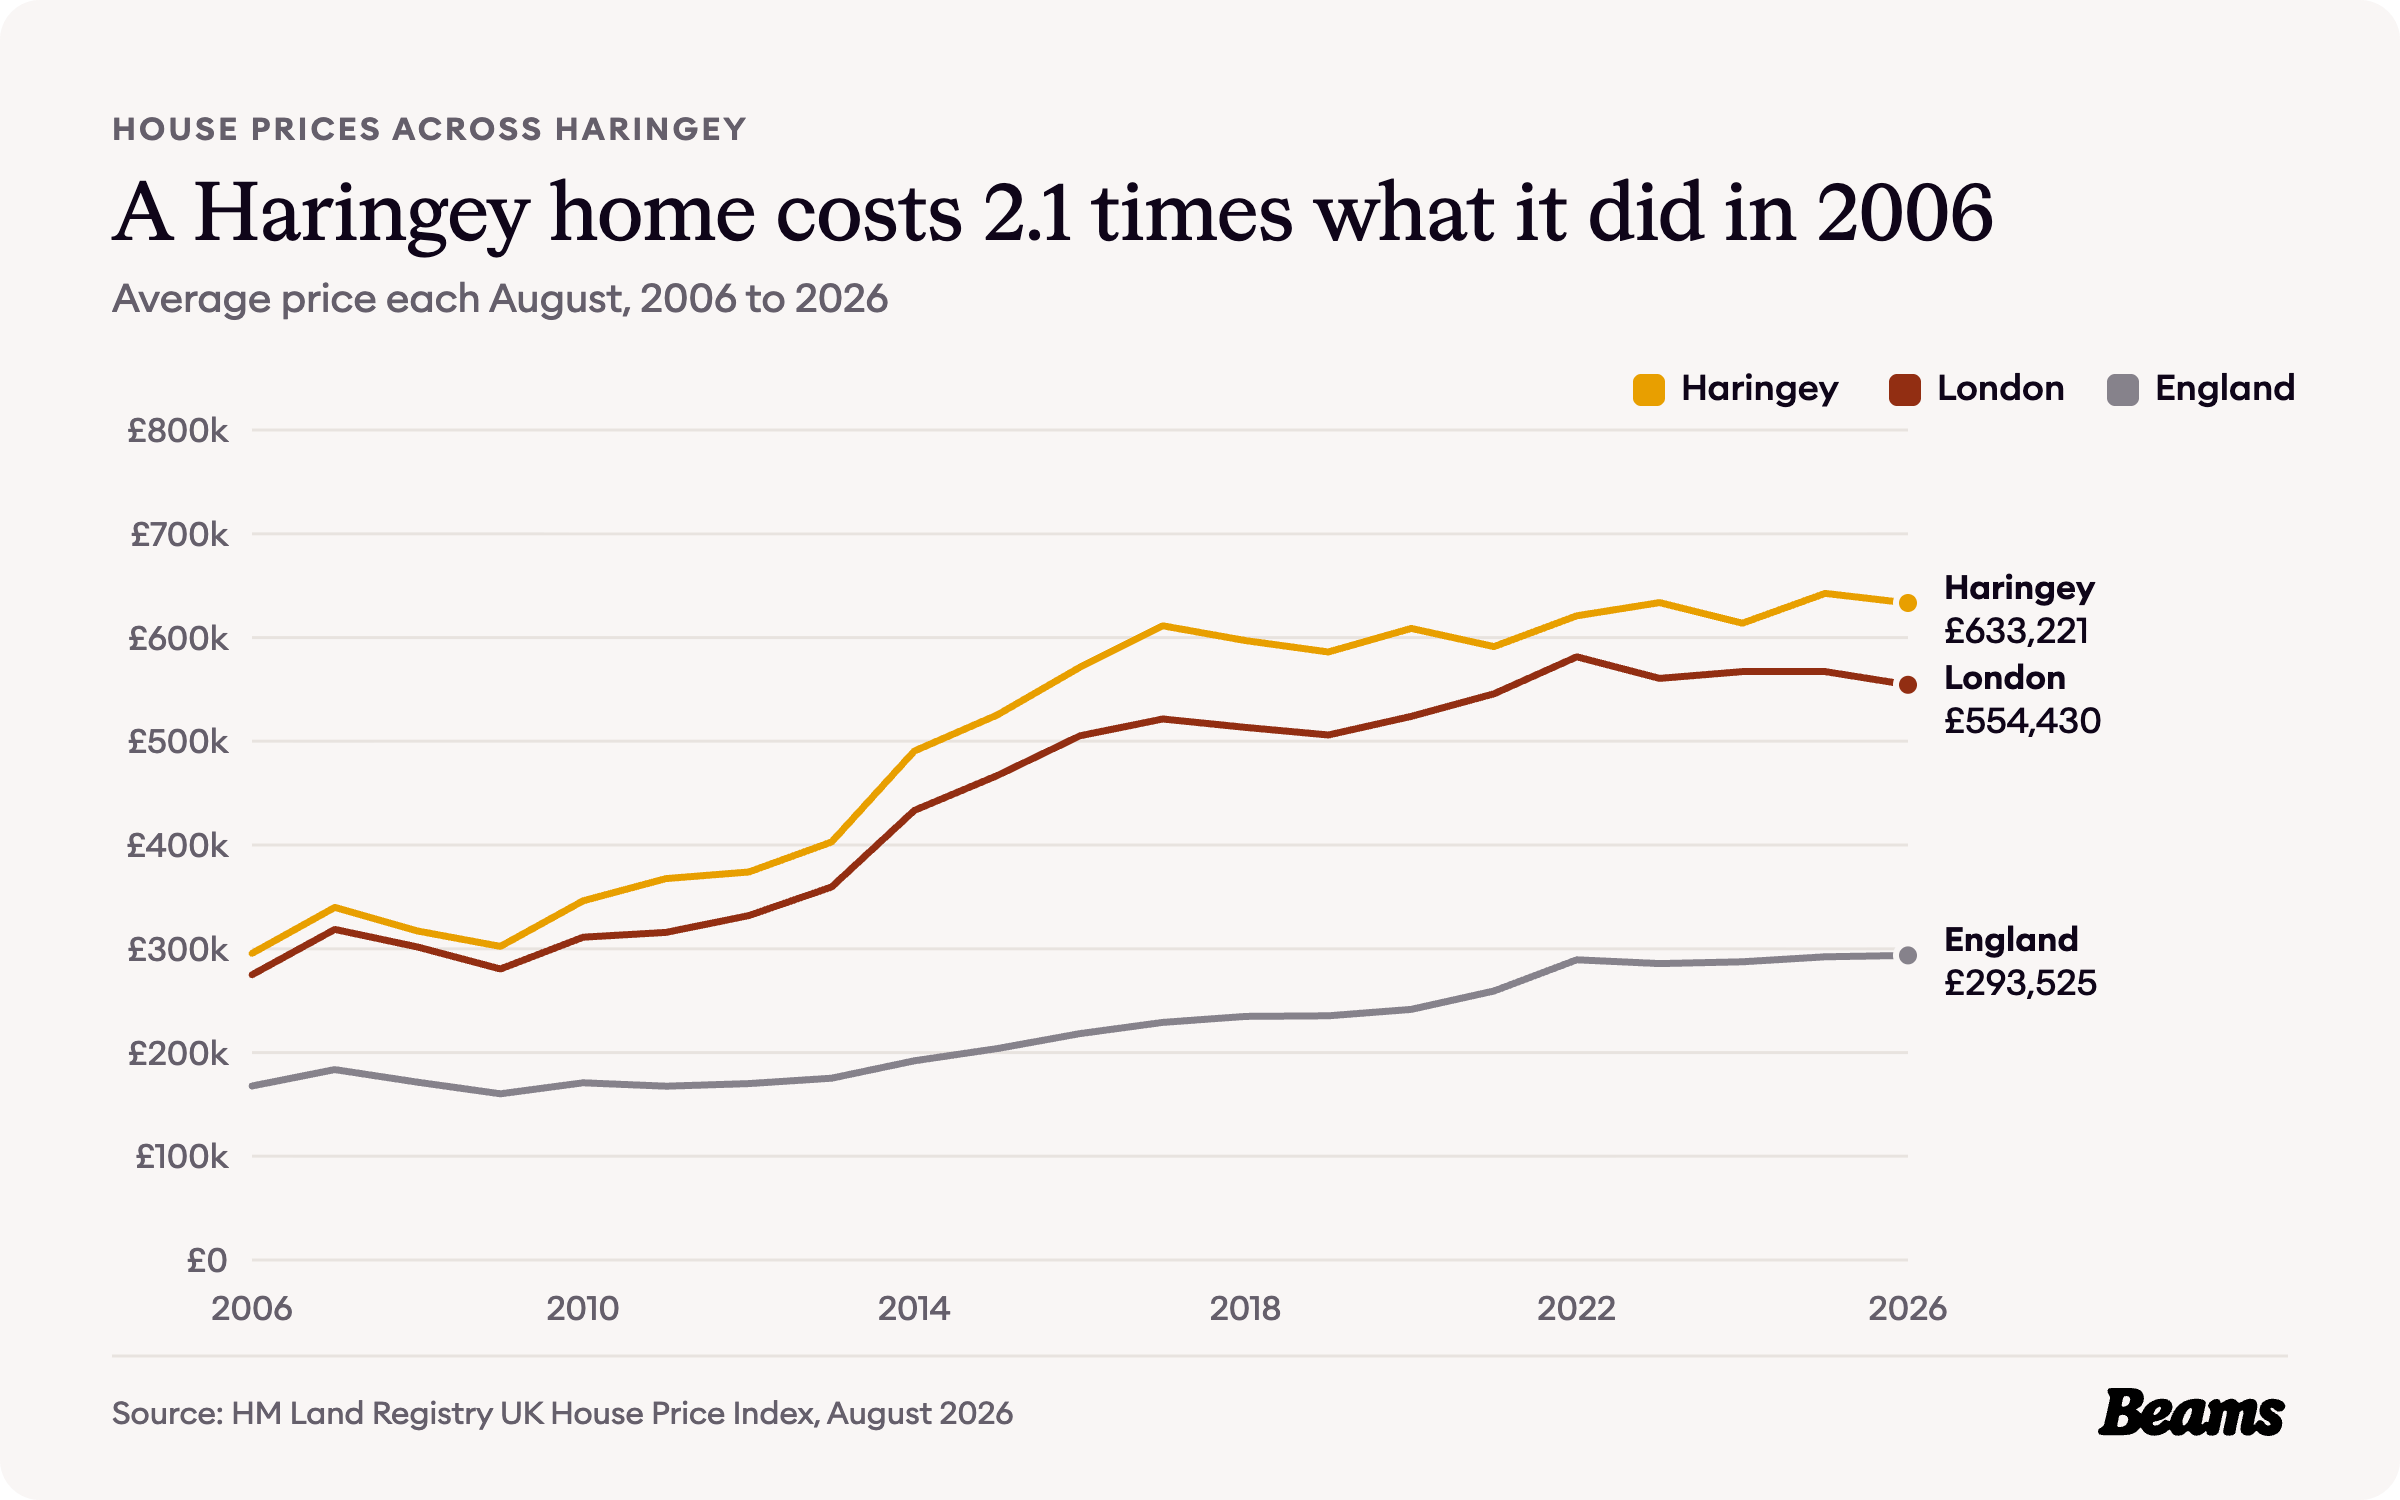
The average Haringey home cost £633,221 in August 2026, 1.4% less than a year earlier [6]. That is about 14% above the London average of £554,430, and more than twice the England average of £293,525 [7].
Haringey has been above the London average every August for twenty years. In August 2006 the average home cost £295,444, against London's £274,815, and it has risen 2.1 times since. The biggest jump came between 2013 and 2014, when the average went from £402,948 to £490,663, and prices peaked at £642,499 in August 2025 [7].
Flats, terraces and the gap between them
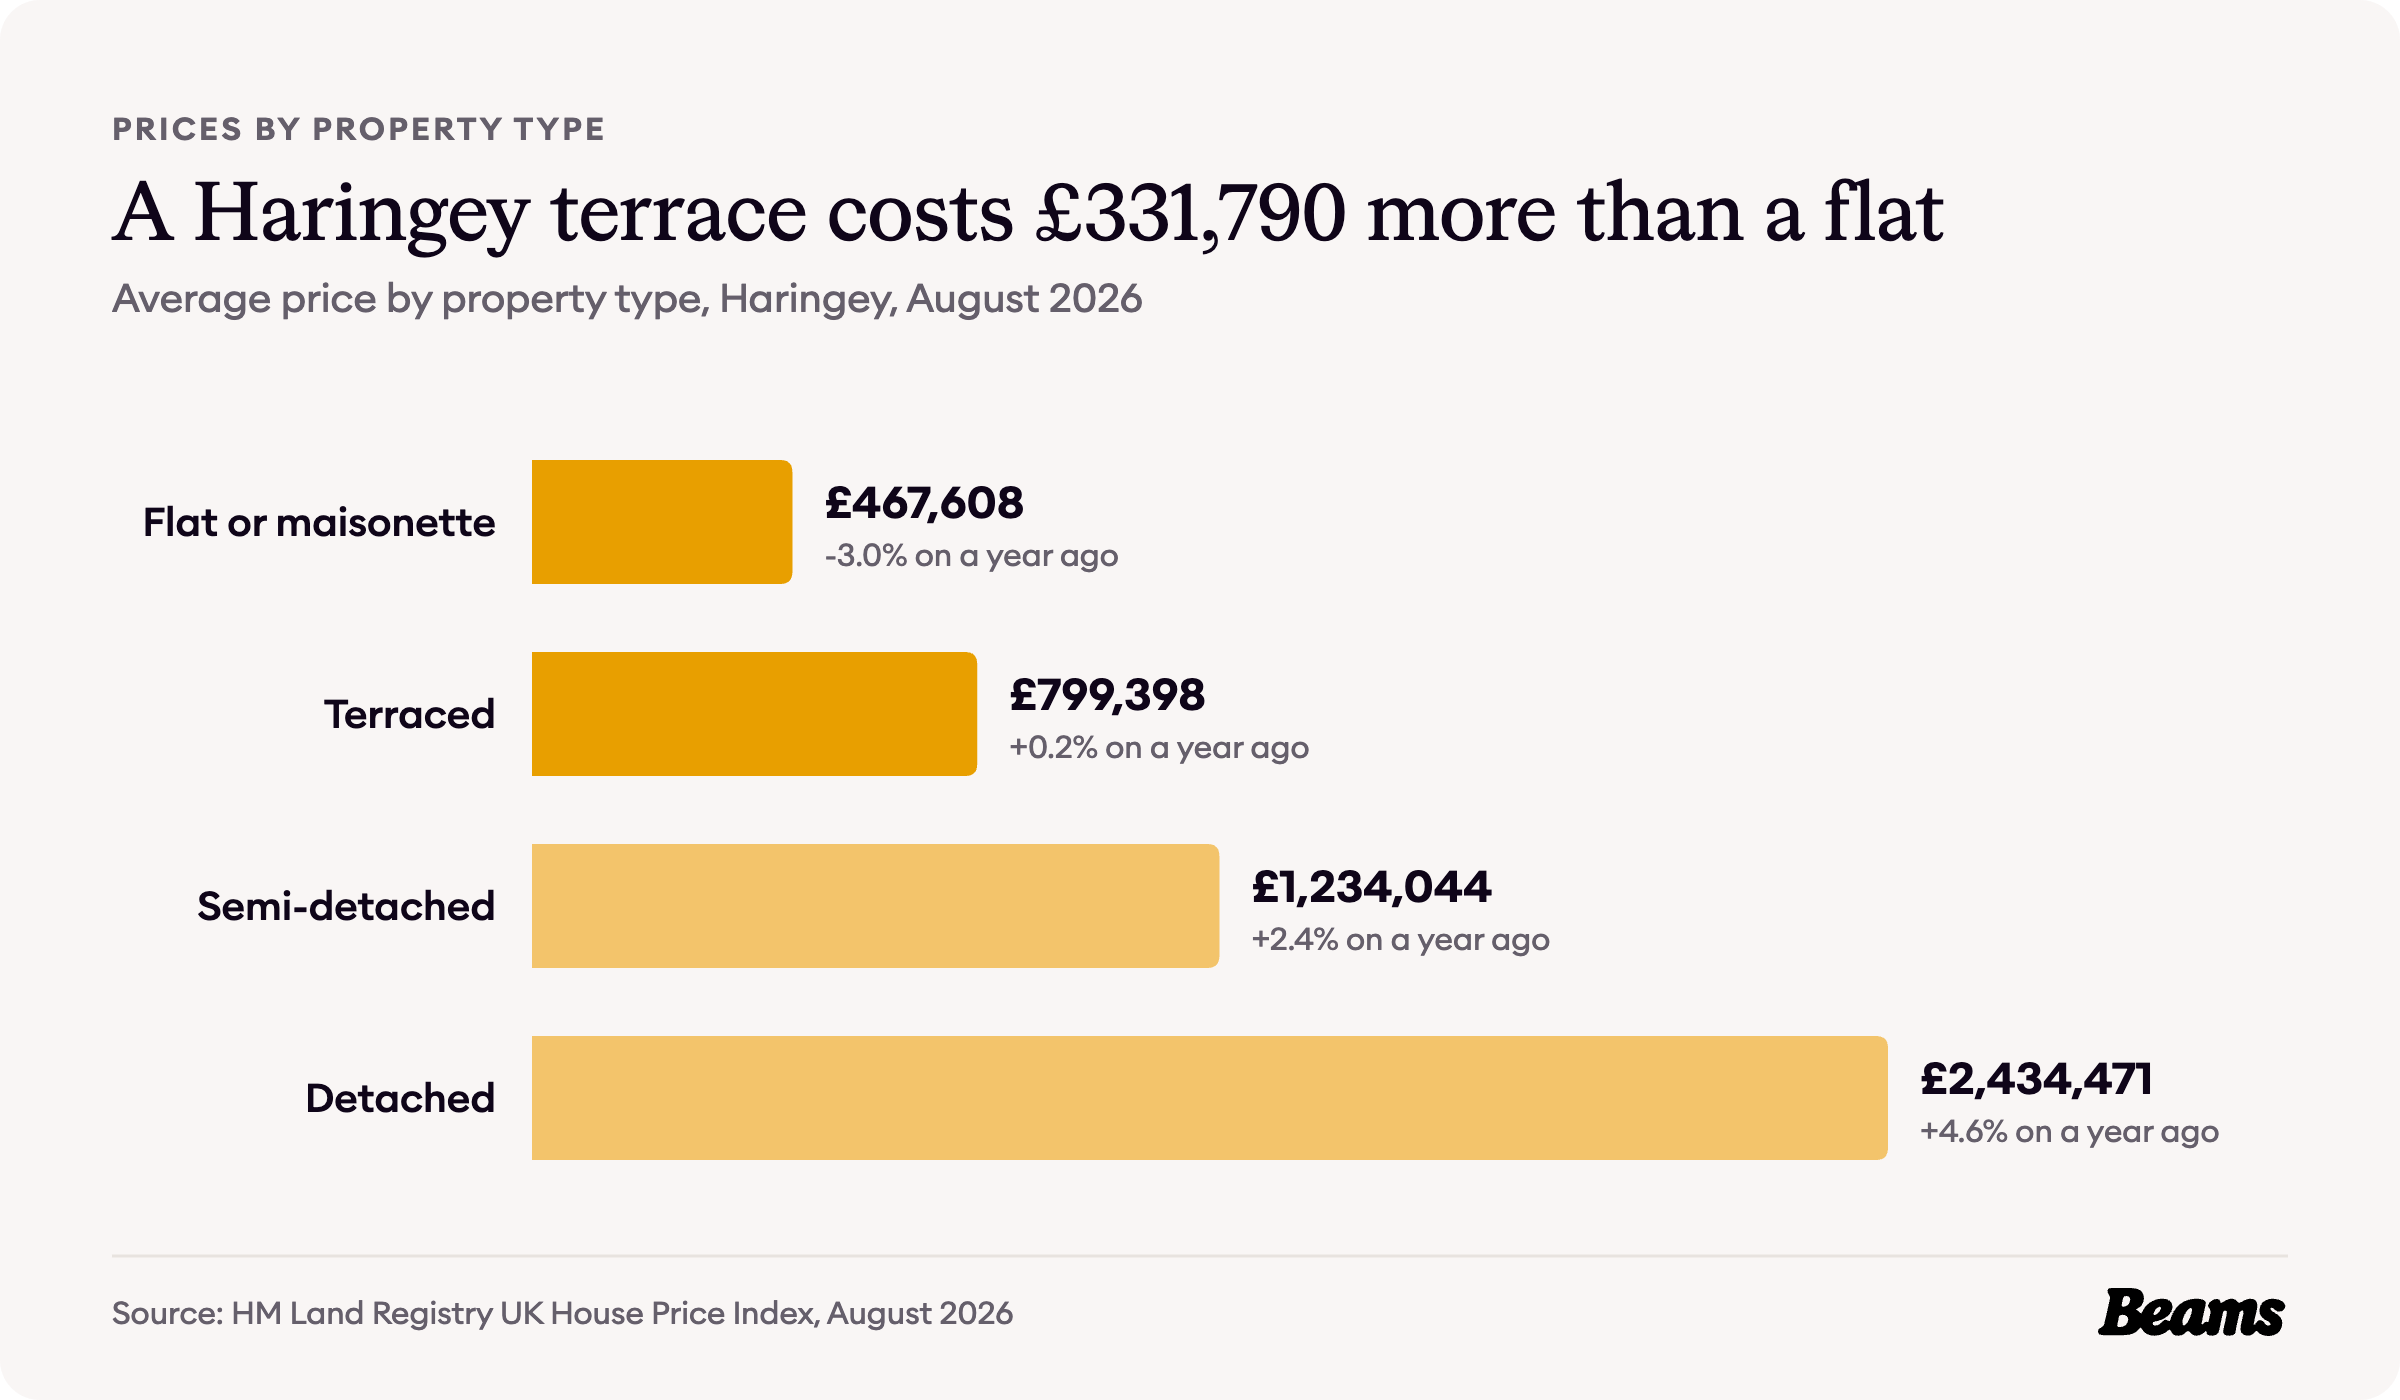
Across Haringey, a flat or maisonette averaged £467,608 in August 2026 and a terraced house £799,398, a gap of £331,790. Semi-detached homes averaged £1,234,044 [6].
First-time buyers in Haringey paid an average of £534,079, while owners moving home paid £801,772 [6].
What homes sell for in N10
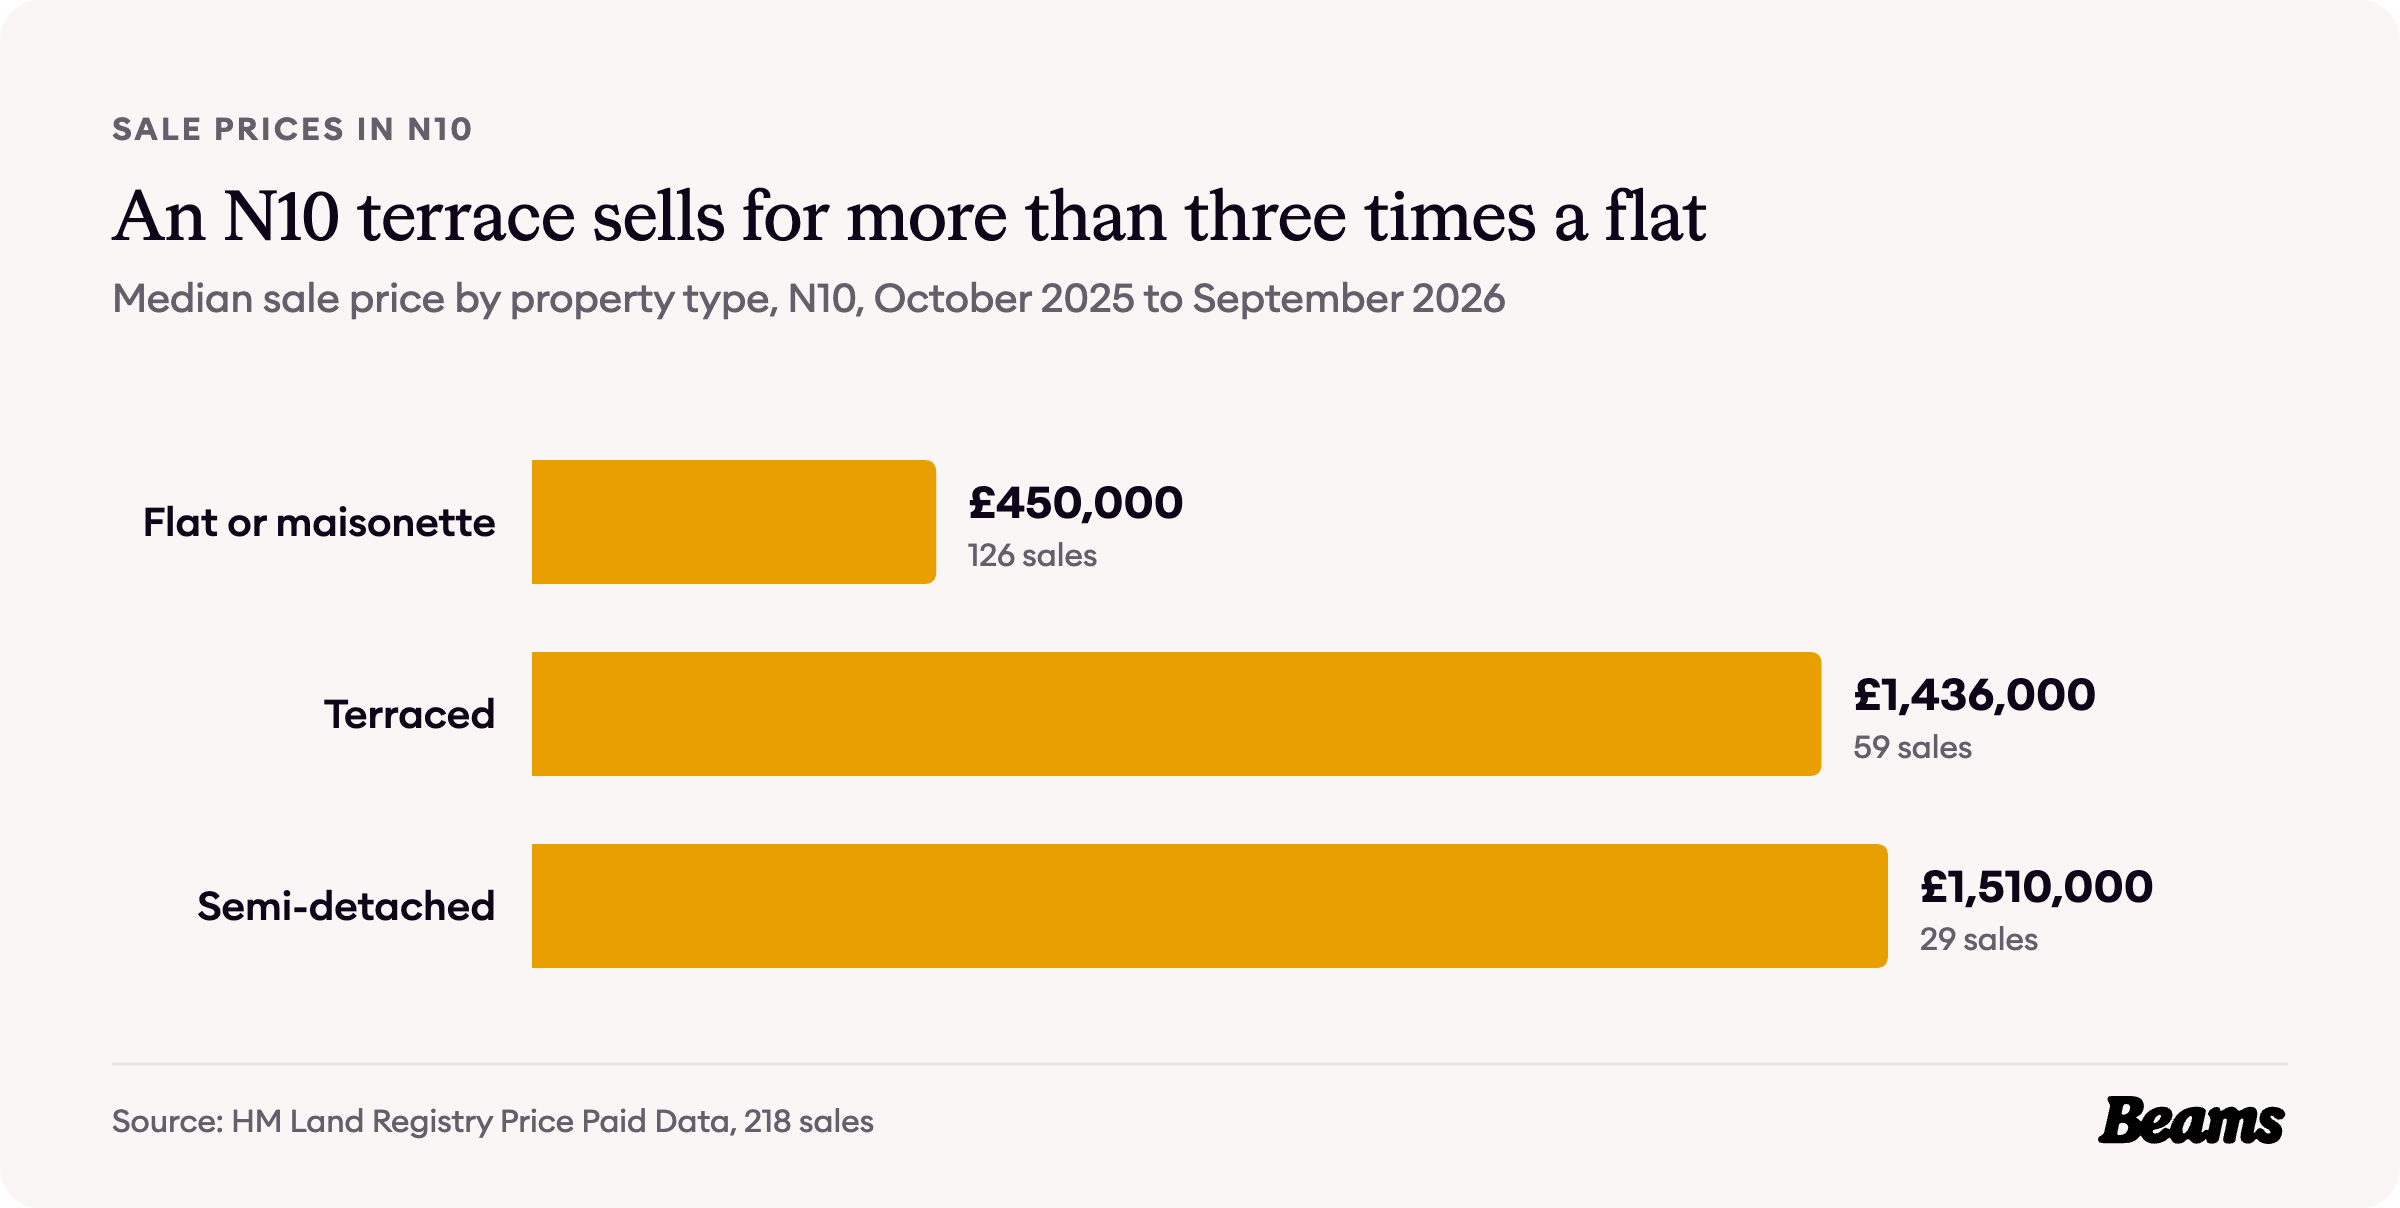
Sales in the N10 postcode district give a closer picture of Muswell Hill itself. In the year from October 2025 to September 2026, 218 homes sold at a median price of £650,000 [8].
A flat or maisonette sold for a median of £450,000 across 126 sales. A terraced house sold for £1,436,000 across 59 sales, more than three times the price of a flat, and a semi-detached house for £1,510,000 across 29 sales [8].
That jump from a flat to a house is the figure most N10 owners weigh up before they move. For a family already in an Edwardian terrace, a house extension in Muswell Hill adds room without paying for the next rung of the ladder.
What it costs to rent
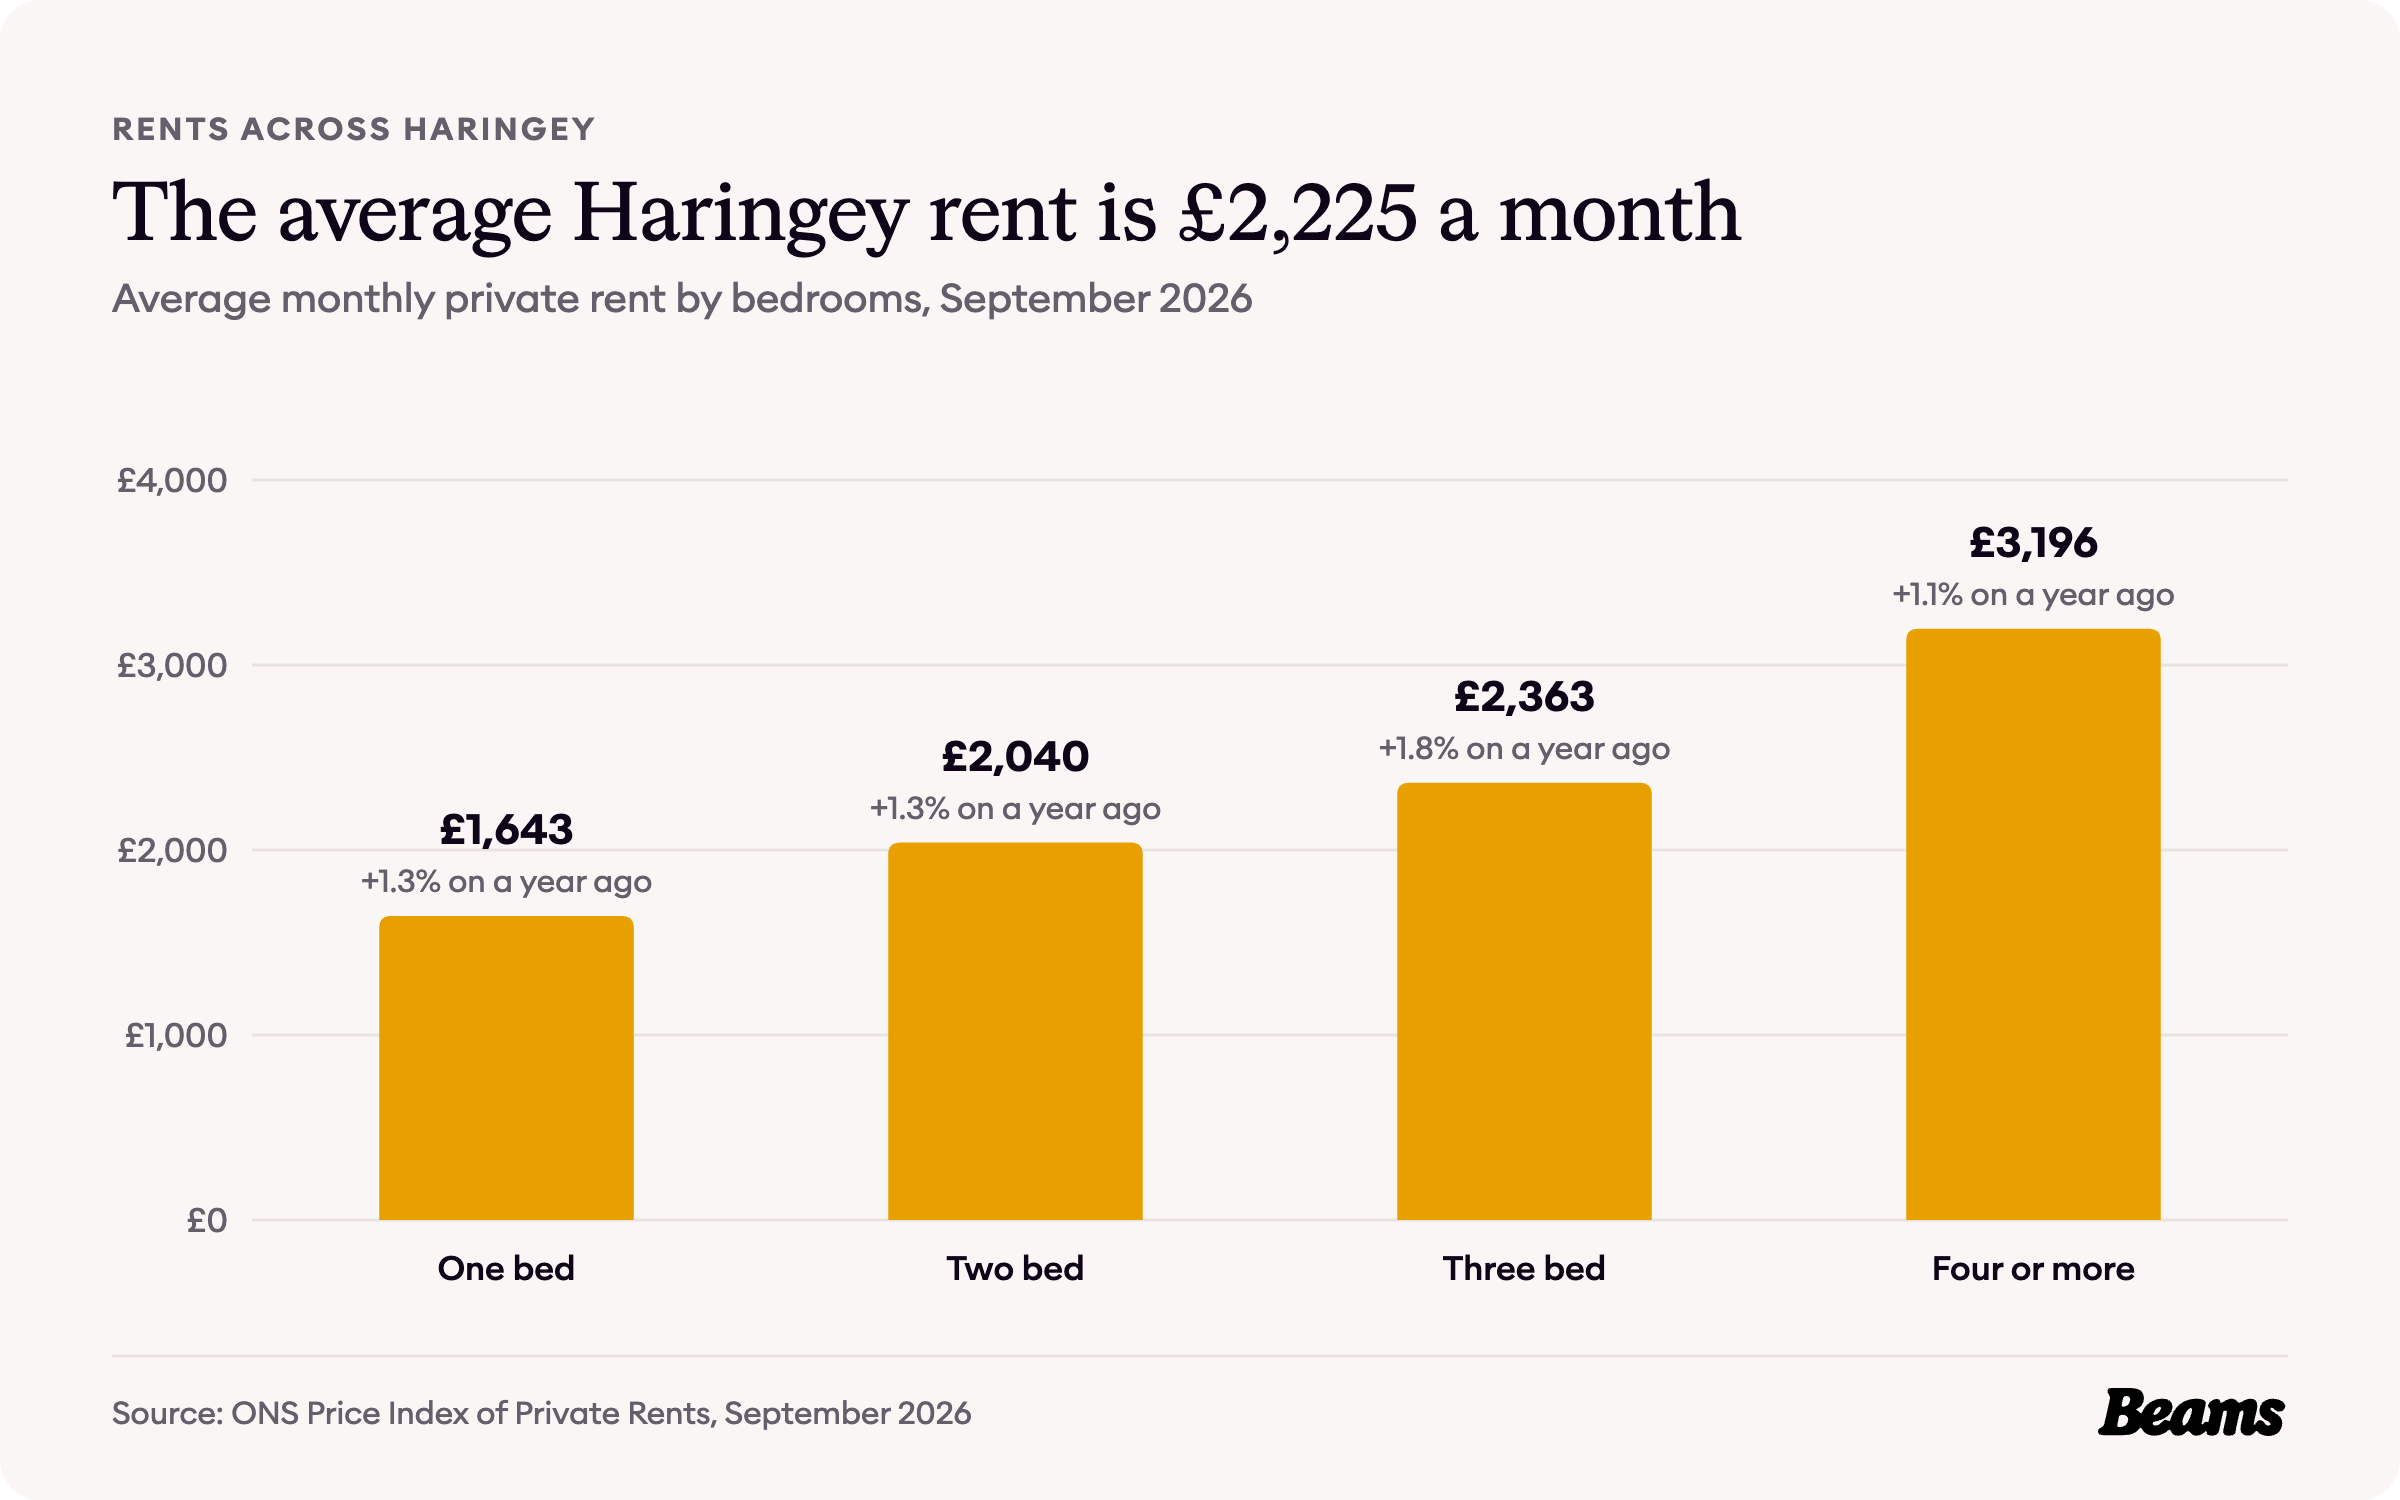
Rents are only published for the borough as a whole. The average private rent in Haringey was £2,225 a month in September 2026, up 1.3% on a year earlier [6]. A one-bedroom home averaged £1,643 a month and a home with four or more bedrooms £3,196.
With 32.3% of Muswell Hill households renting privately, a dated bathroom is often the first thing a bathroom renovation in Muswell Hill puts right between tenancies.
Council Tax bands in Muswell Hill
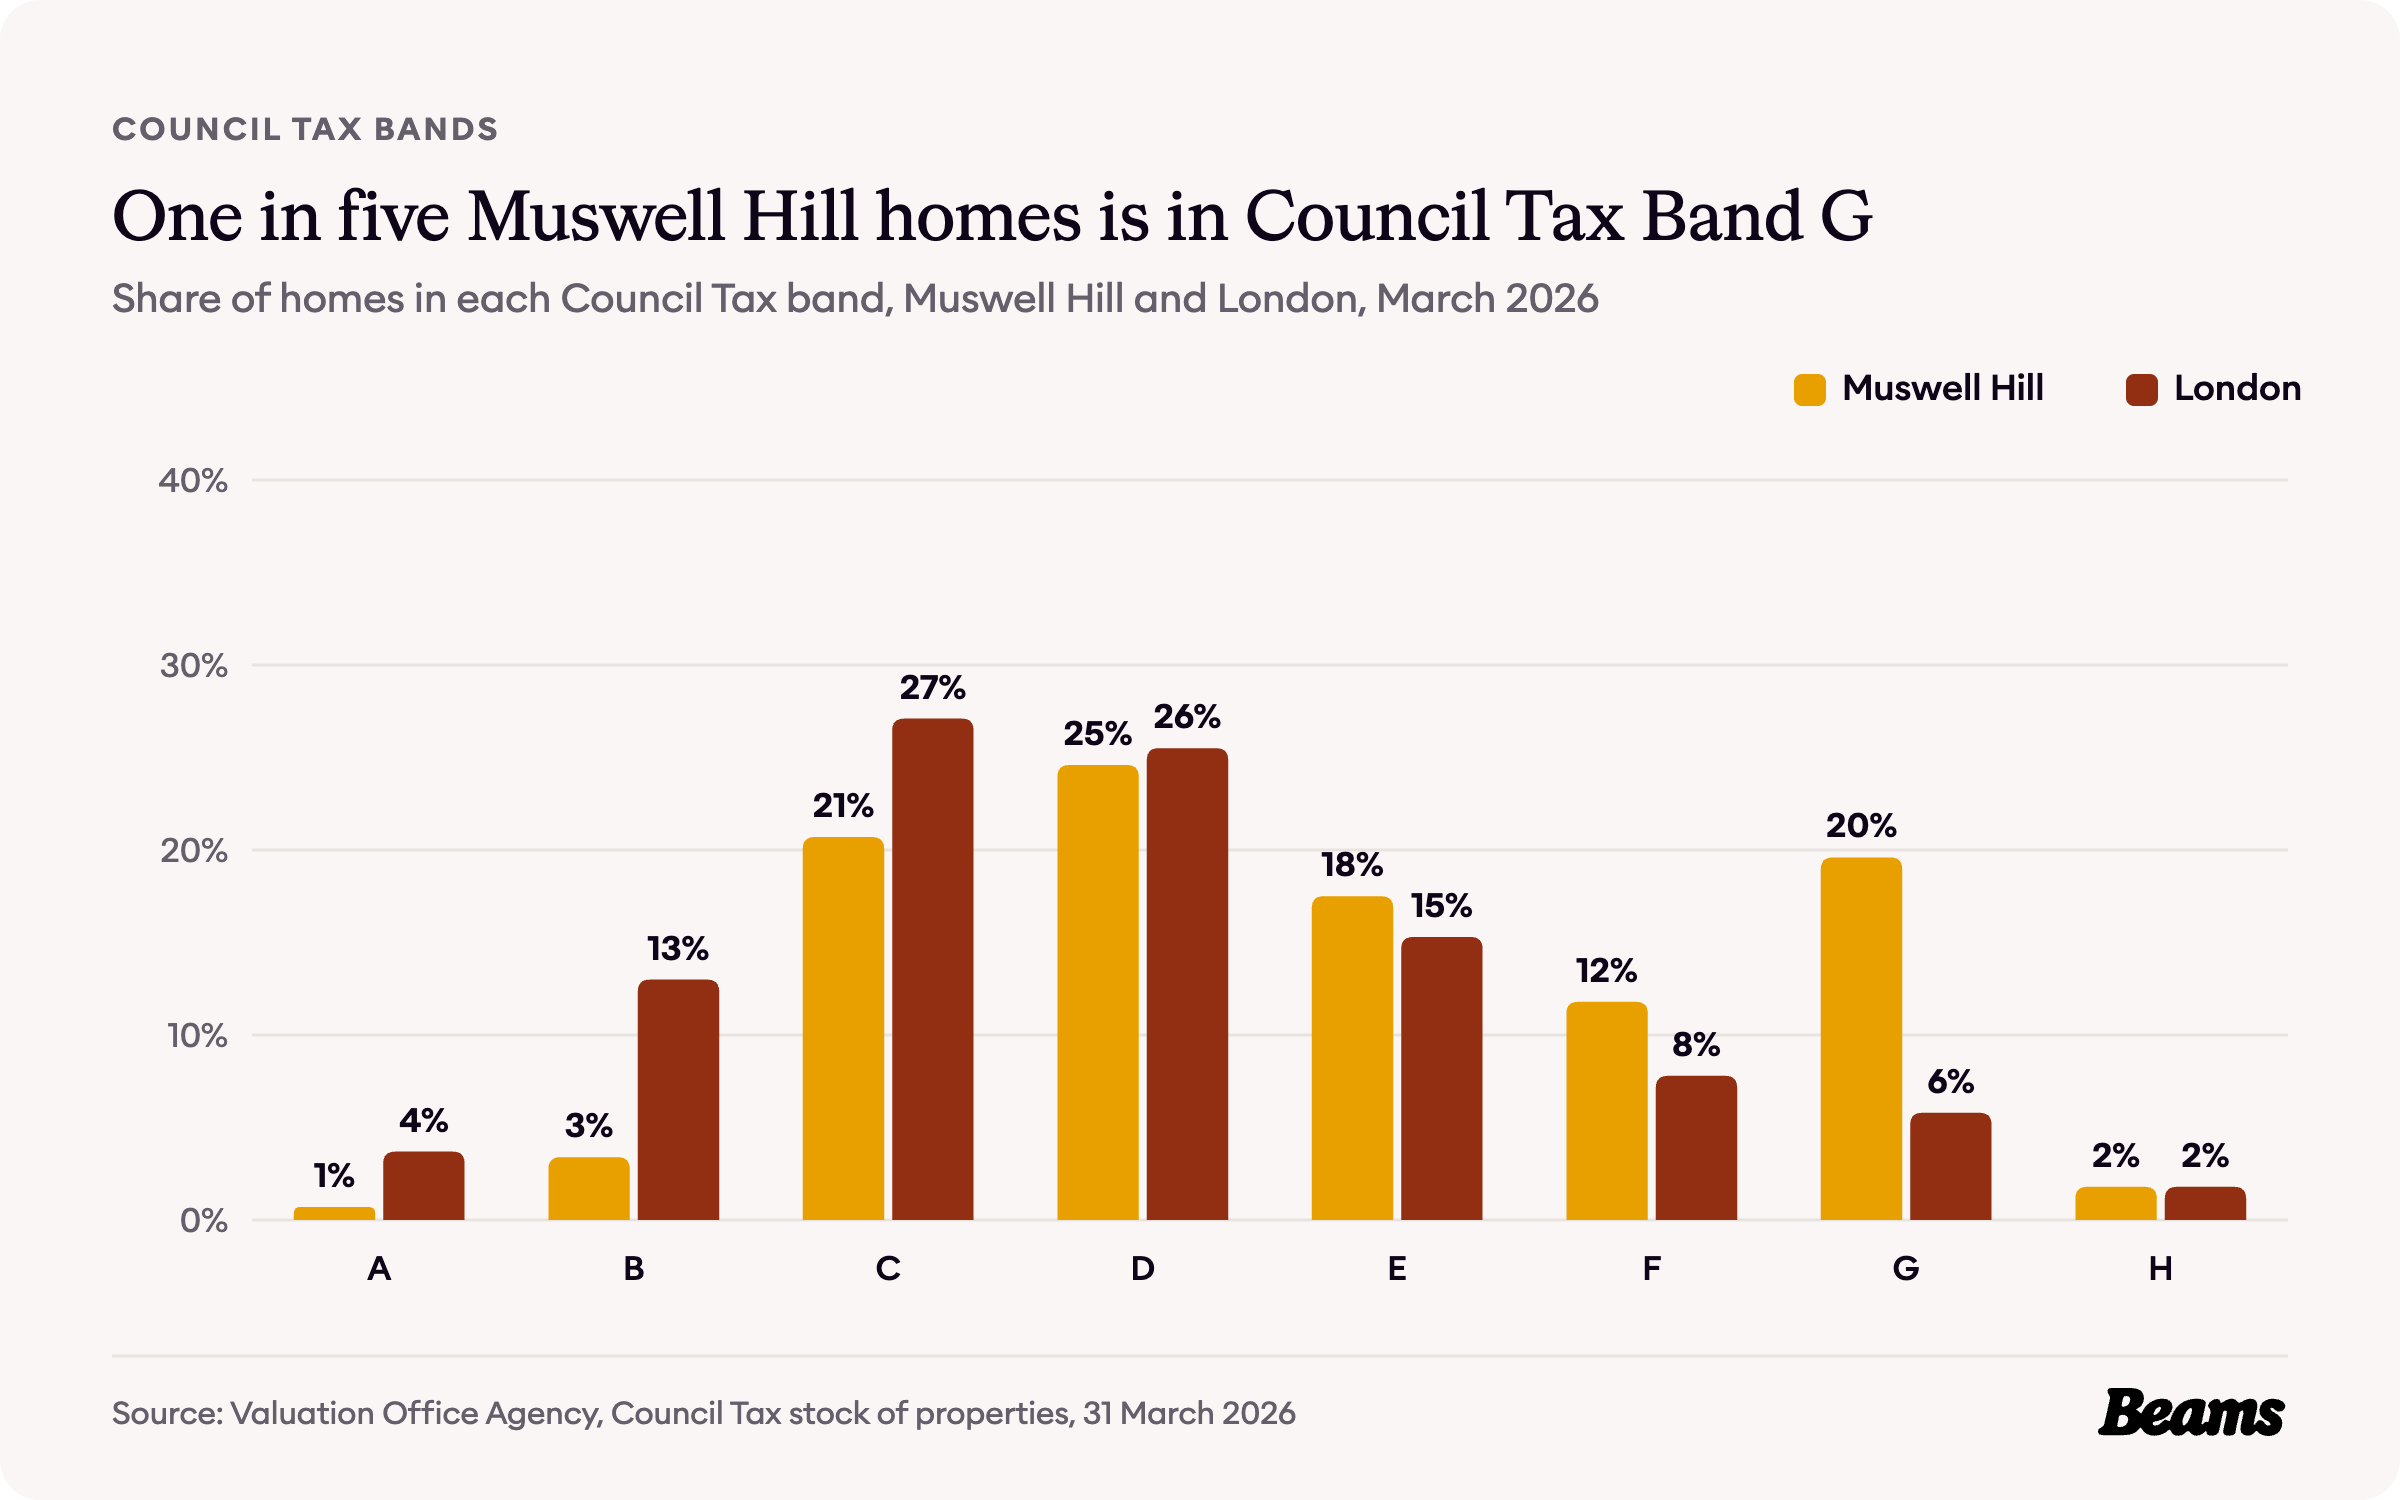
Council Tax bands are based on what a home would have sold for on the open market on 1 April 1991 [9]. In Muswell Hill, 19.6% of homes are in Band G, more than three times London's 5.8%. In all, 50.7% are in Band E or above, against 30.7% across London [3].
Band D is still the largest single band, with 24.6% of homes, and only 4.1% are in Bands A and B, against 16.7% for London [3].
The rules on your street
Haringey has 28 conservation areas [10]. Three of them sit in and around Muswell Hill: the Muswell Hill conservation area, designated on 1 March 1974, the Fortis Green conservation area to its west, designated the same day, and the Rookfield conservation area to its south east, designated on 26 March 1976 [10] [1].
Haringey uses Article 4 directions in four conservation areas, and the Rookfield Estate is one of them, so some works there that would normally be permitted development need planning permission [11]. The Muswell Hill and Fortis Green conservation areas are not on that list, but the council's appraisal notes that new or enlarged dormers on the front slope of a roof in a conservation area need planning permission [1]. Digging down is one of the jobs where the local rules matter most, so a basement conversion in Muswell Hill starts with a check of the address.
Haringey Council says a decision is usually made no more than 8 weeks after receipt for householder or minor applications, and 13 weeks for a major application. It also says applications are checked only when an officer is available, so there may be a number of weeks before one is validated [12]. With more than half the neighbourhood built before 1919, it is worth checking your street on the council's map before anyone starts drawing, then asking up to three vetted builders in Muswell Hill to quote against the same plans.
Muswell Hill housing statistics at a glance
- Median sale price in N10, October 2025 to September 2026: £650,000 [8]
- Median terraced house in N10: £1,436,000 [8]
- Median flat or maisonette in N10: £450,000 [8]
- Average house price in Haringey, August 2026: £633,221 (London £554,430) [6] [7]
- Average private rent in Haringey, September 2026: £2,225 a month [6]
- Homes built before 1919: 56.2% (London 29.0%) [3]
- Households in a flat in a converted house: 26.1% (London 11.1%) [4]
- Households who own their home: 56.2% (London 45.2%) [5]
- Homes in Council Tax Band G: 19.6% (London 5.8%) [3]
- Conservation areas in and around Muswell Hill: 3, of Haringey's 28 [10]
Frequently asked questions
References
- Haringey Council, Muswell Hill Conservation Area character appraisal. Adopted 11 February 2008, updated August 2008.
- British History Online, Hornsey, including Highgate: Growth from the mid 19th century. Victoria County History of Middlesex, volume 6.
- Valuation Office Agency, Council Tax: stock of properties 2026. Table CTSOP4.1, properties by build period and Council Tax band at 31 March 2026, for the Muswell Hill North, Fortis Green & Coldfall and Muswell Hill South small areas.
- ONS, Census 2021 table TS044: Accommodation type. Households by type of home, Muswell Hill small areas and London.
- ONS, Census 2021 table TS054: Tenure. Households by tenure, Muswell Hill small areas and London.
- ONS, Housing prices in Haringey. UK House Price Index for August 2026 and Price Index of Private Rents for September 2026, published 21 October 2026.
- HM Land Registry, UK House Price Index. Average prices for Haringey, London and England, August 2006 to August 2026.
- HM Land Registry, Price Paid Data. Sales in the N10 postcode district, October 2025 to September 2026.
- GOV.UK, How domestic properties are assessed for Council Tax bands. Accessed 29 October 2026.
- Haringey Council, List of conservation areas in Haringey. Accessed 29 October 2026.
- Haringey Council, Development in conservation areas. Accessed 29 October 2026.
- Haringey Council, What happens after you submit a planning application. Accessed 29 October 2026.
Thinking of improving rather than moving?
Tell us about your Muswell Hill home and what you want to change. We'll give you a free estimate, then up to three vetted builders quote against the same specification.