
Lambeth housing statistics 2026
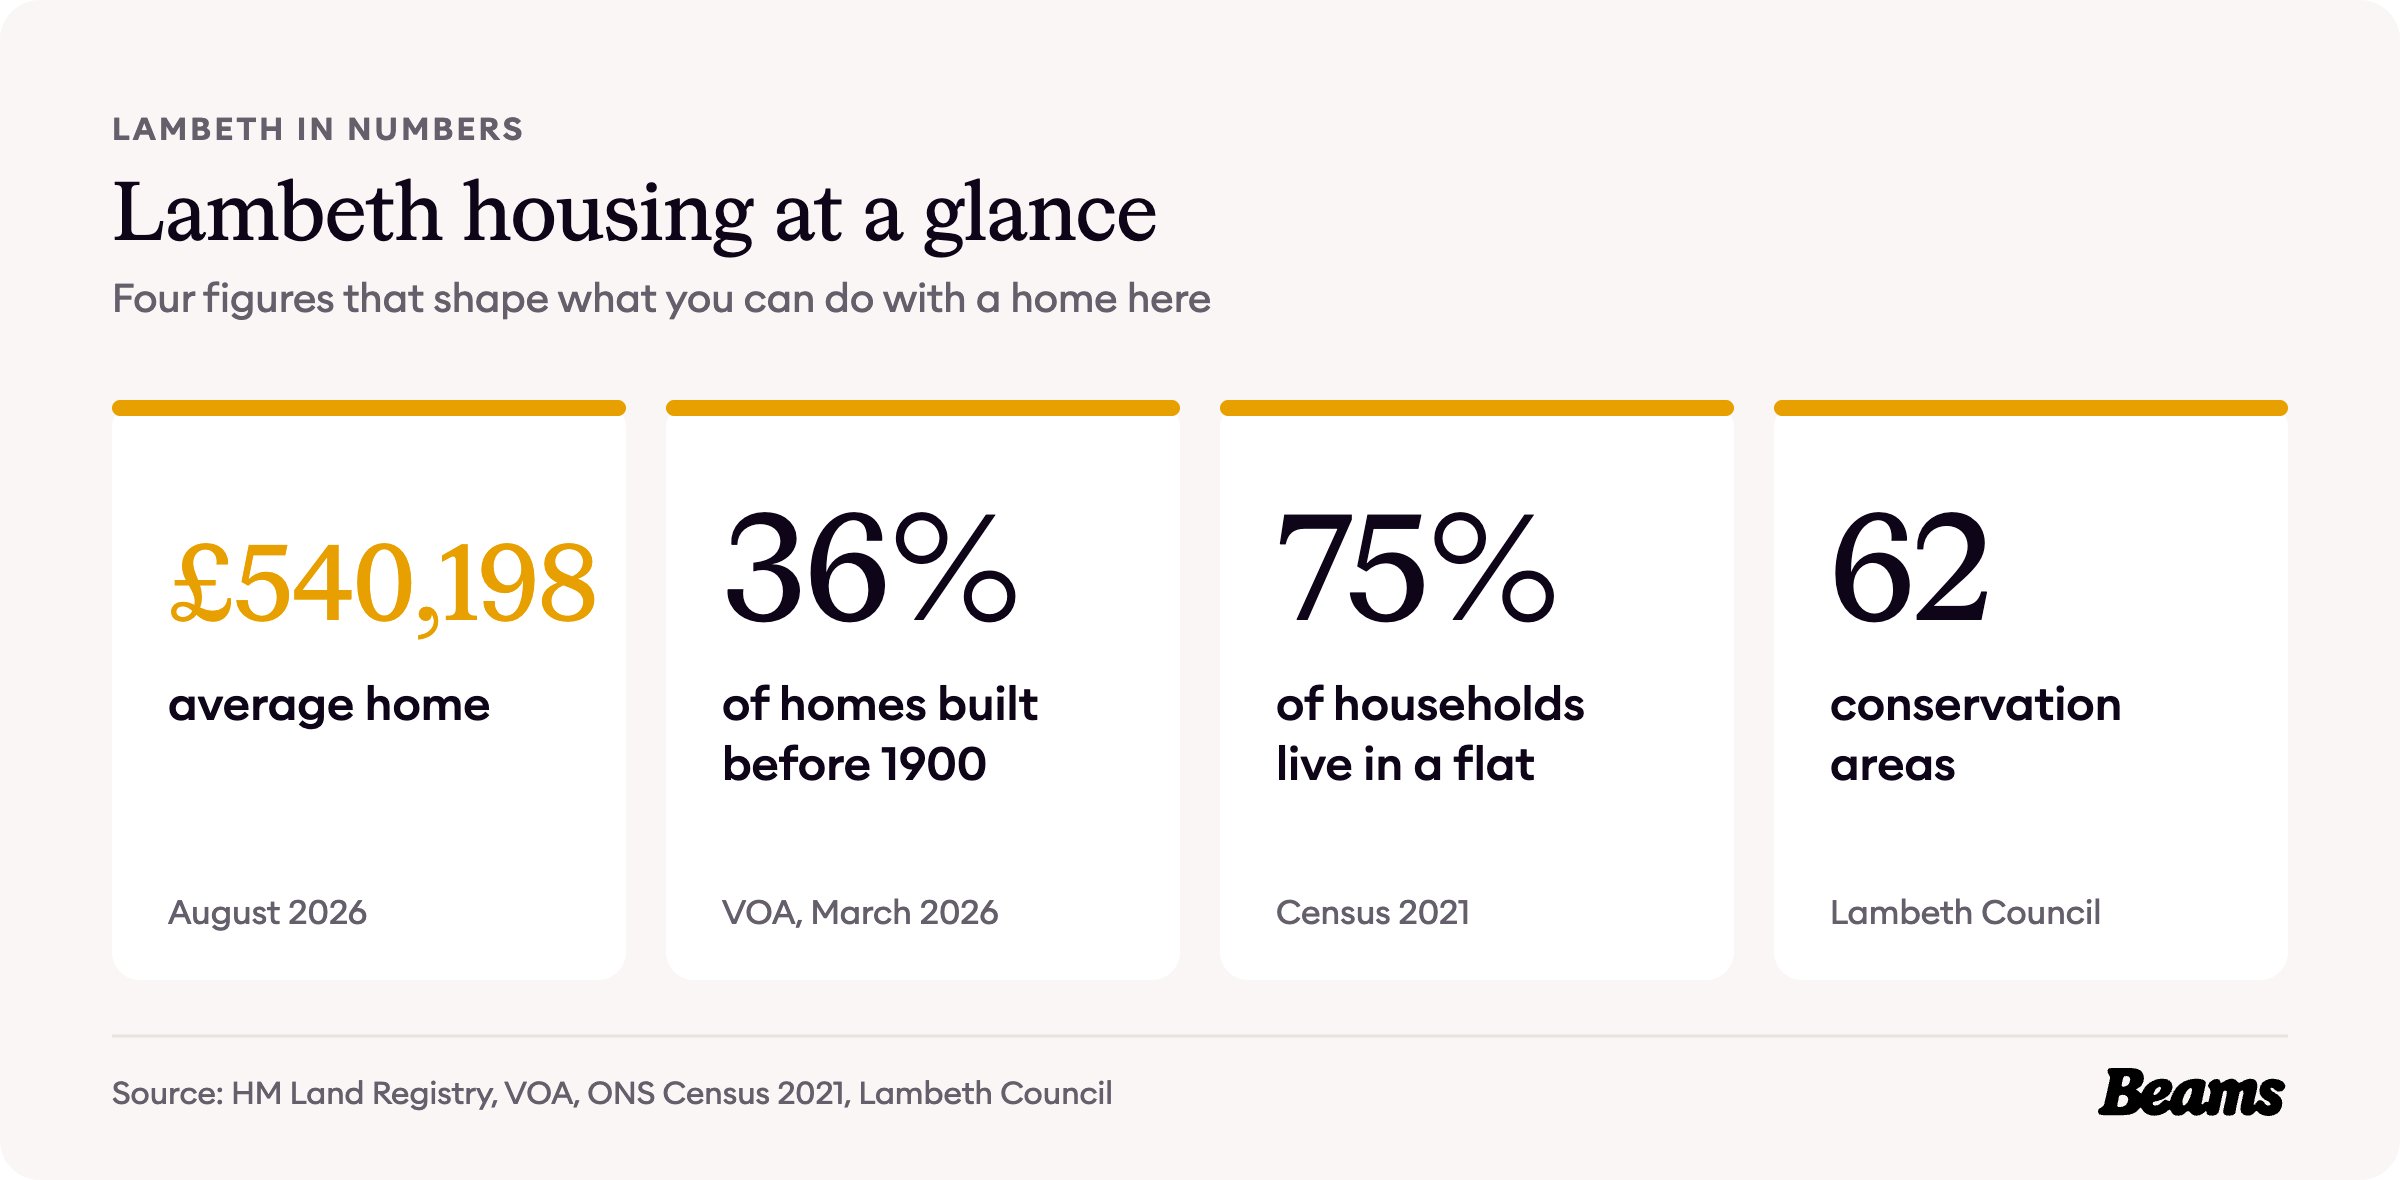
Most of Lambeth was built in a single century, and much of it was later split into flats. Three in four households now live in one, and after a 6.5% fall in the past year the average Lambeth home costs £540,198, just below the London average for the first time in twenty years.
Every figure on this page comes from an official source and is dated, so you can see what you are working with before you plan a home renovation in Lambeth. Sources are numbered in brackets and listed in full at the end.
How Lambeth was built
South of Kennington Common, now Kennington Park, there were few buildings before about 1800. The Survey of London puts the population of the old parish at 27,985 in 1801, and that of the Metropolitan Borough of Lambeth at 301,895 by 1901, so most of the building happened within a single century [1].
The roads came first and the railways followed. In the first half of the nineteenth century large houses, often with a coach-house, went up along the main roads, and many can still be seen on Brixton Road and Clapham Road. In 1890 the City and South London Railway, the first tube railway in London, opened as far as Stockwell [1].
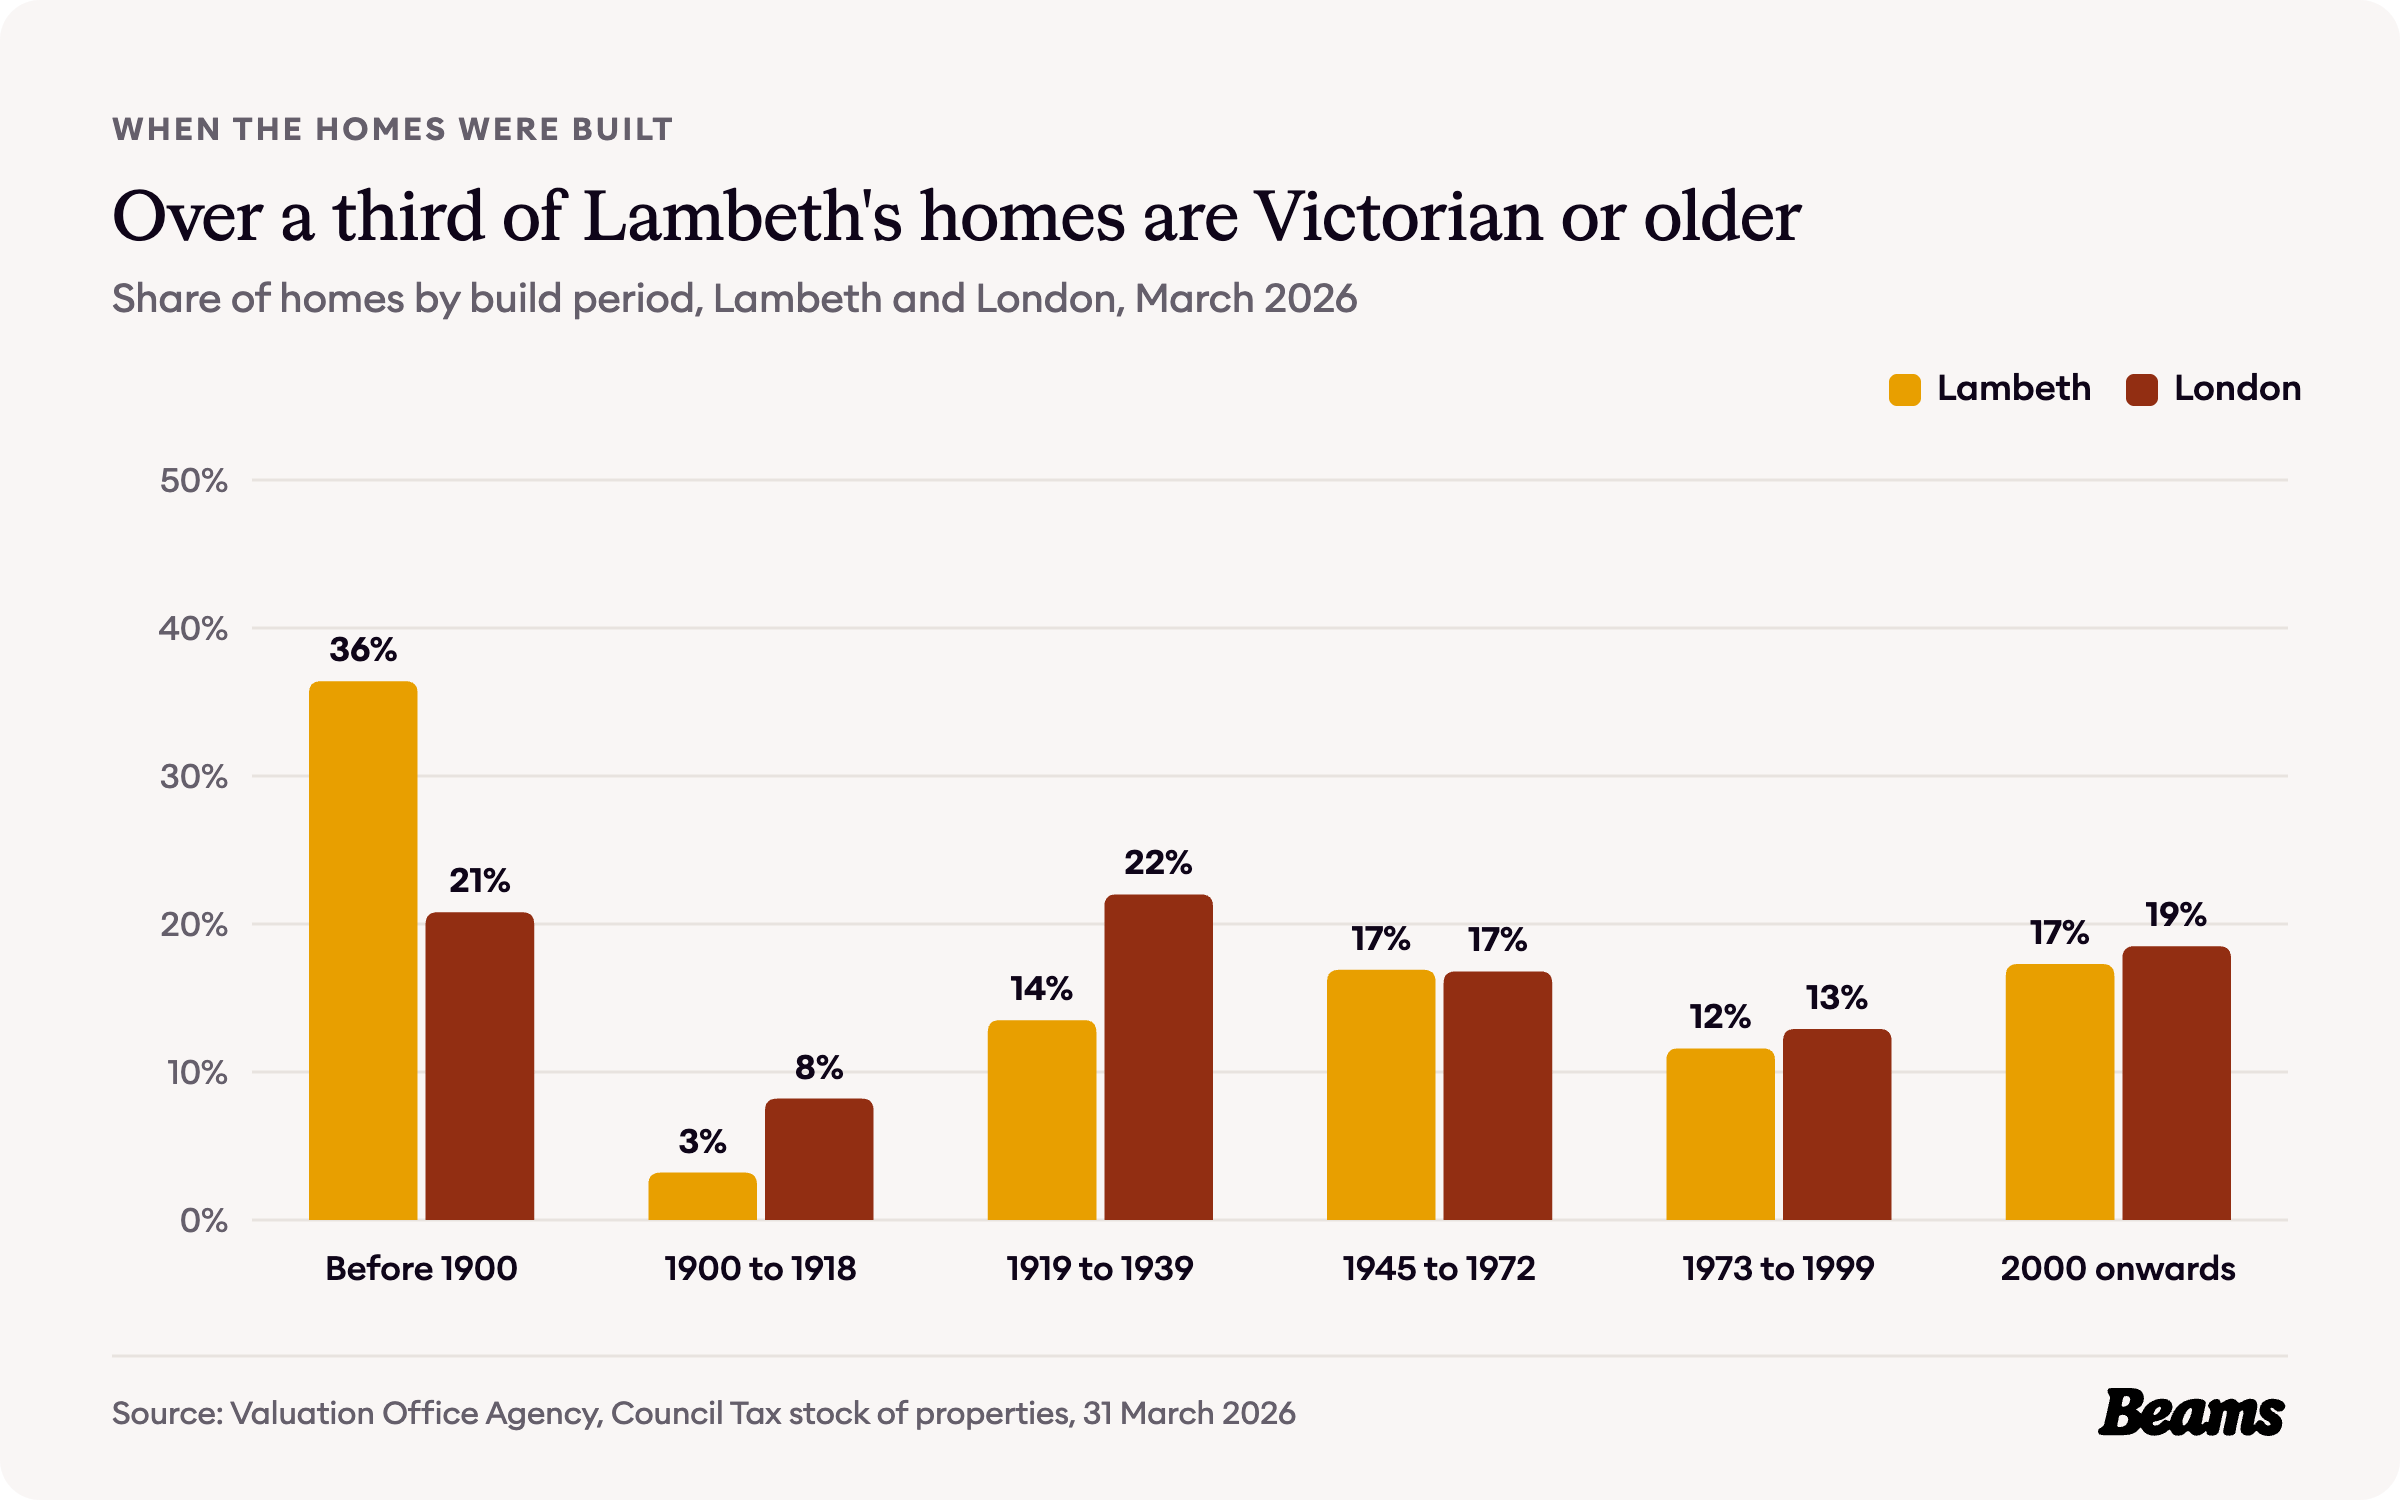
That century of building still dominates. The Valuation Office Agency counts 149,490 homes in Lambeth, and 36.4% of them were built before 1900, against 20.8% across London [2]. Only 3.2% date from 1900 to 1918 and 13.5% from between the wars. Another 16.9% went up from 1945 to 1972 and 17.3% since 2000, against 18.5% for London [2].
More than a third of the borough is Victorian or older, and the pitched roofs on those terraces and villas are the obvious place to find another room, which is why a loft conversion in Lambeth is so often the first big project.
How Lambeth households live
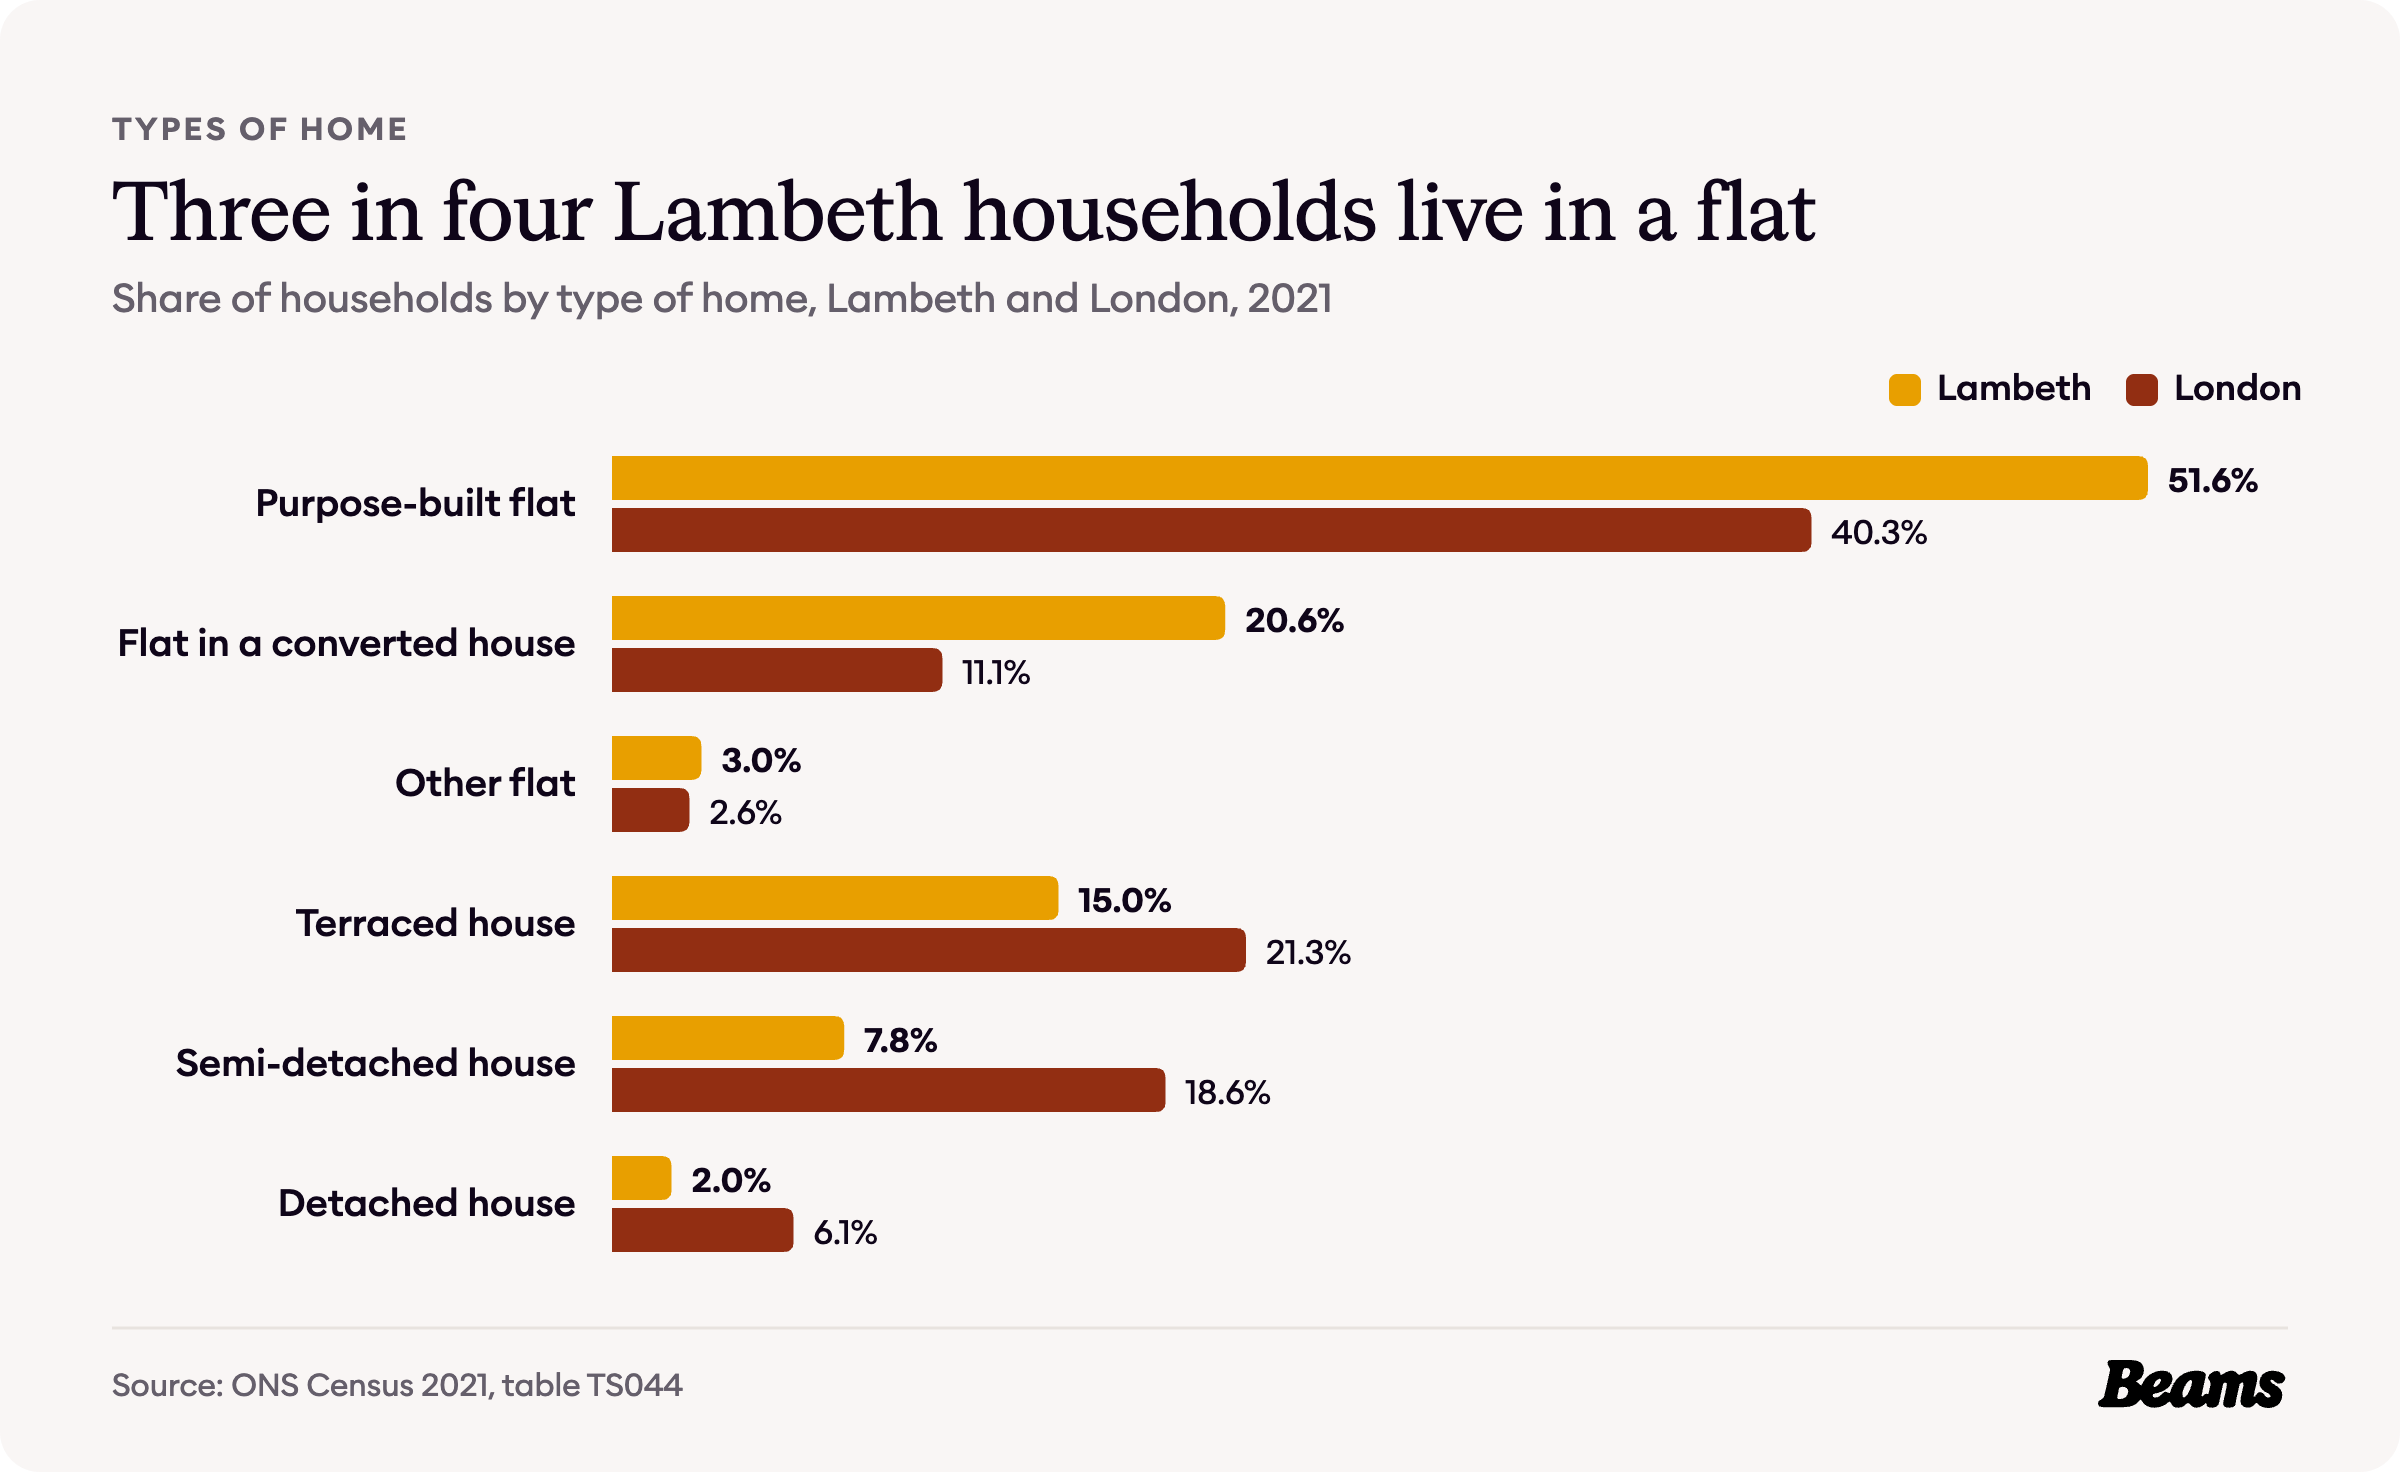
The 2021 Census found 51.6% of Lambeth households in a purpose-built flat and 20.6% in a flat inside a converted house, against 40.3% and 11.1% across London [3]. One household in five lives in a house that has been divided up, nearly twice the London rate.
Counting other flats, 75.2% of Lambeth households live in a flat, against 54.0% for London. Just 15.0% live in a terraced house, 7.8% in a semi-detached house and 2.0% in a detached house [3]. In a converted house the kitchen often sits in a room that was never designed as one, so a kitchen renovation in Lambeth is usually about making a small space work far harder.
Who owns Lambeth's homes
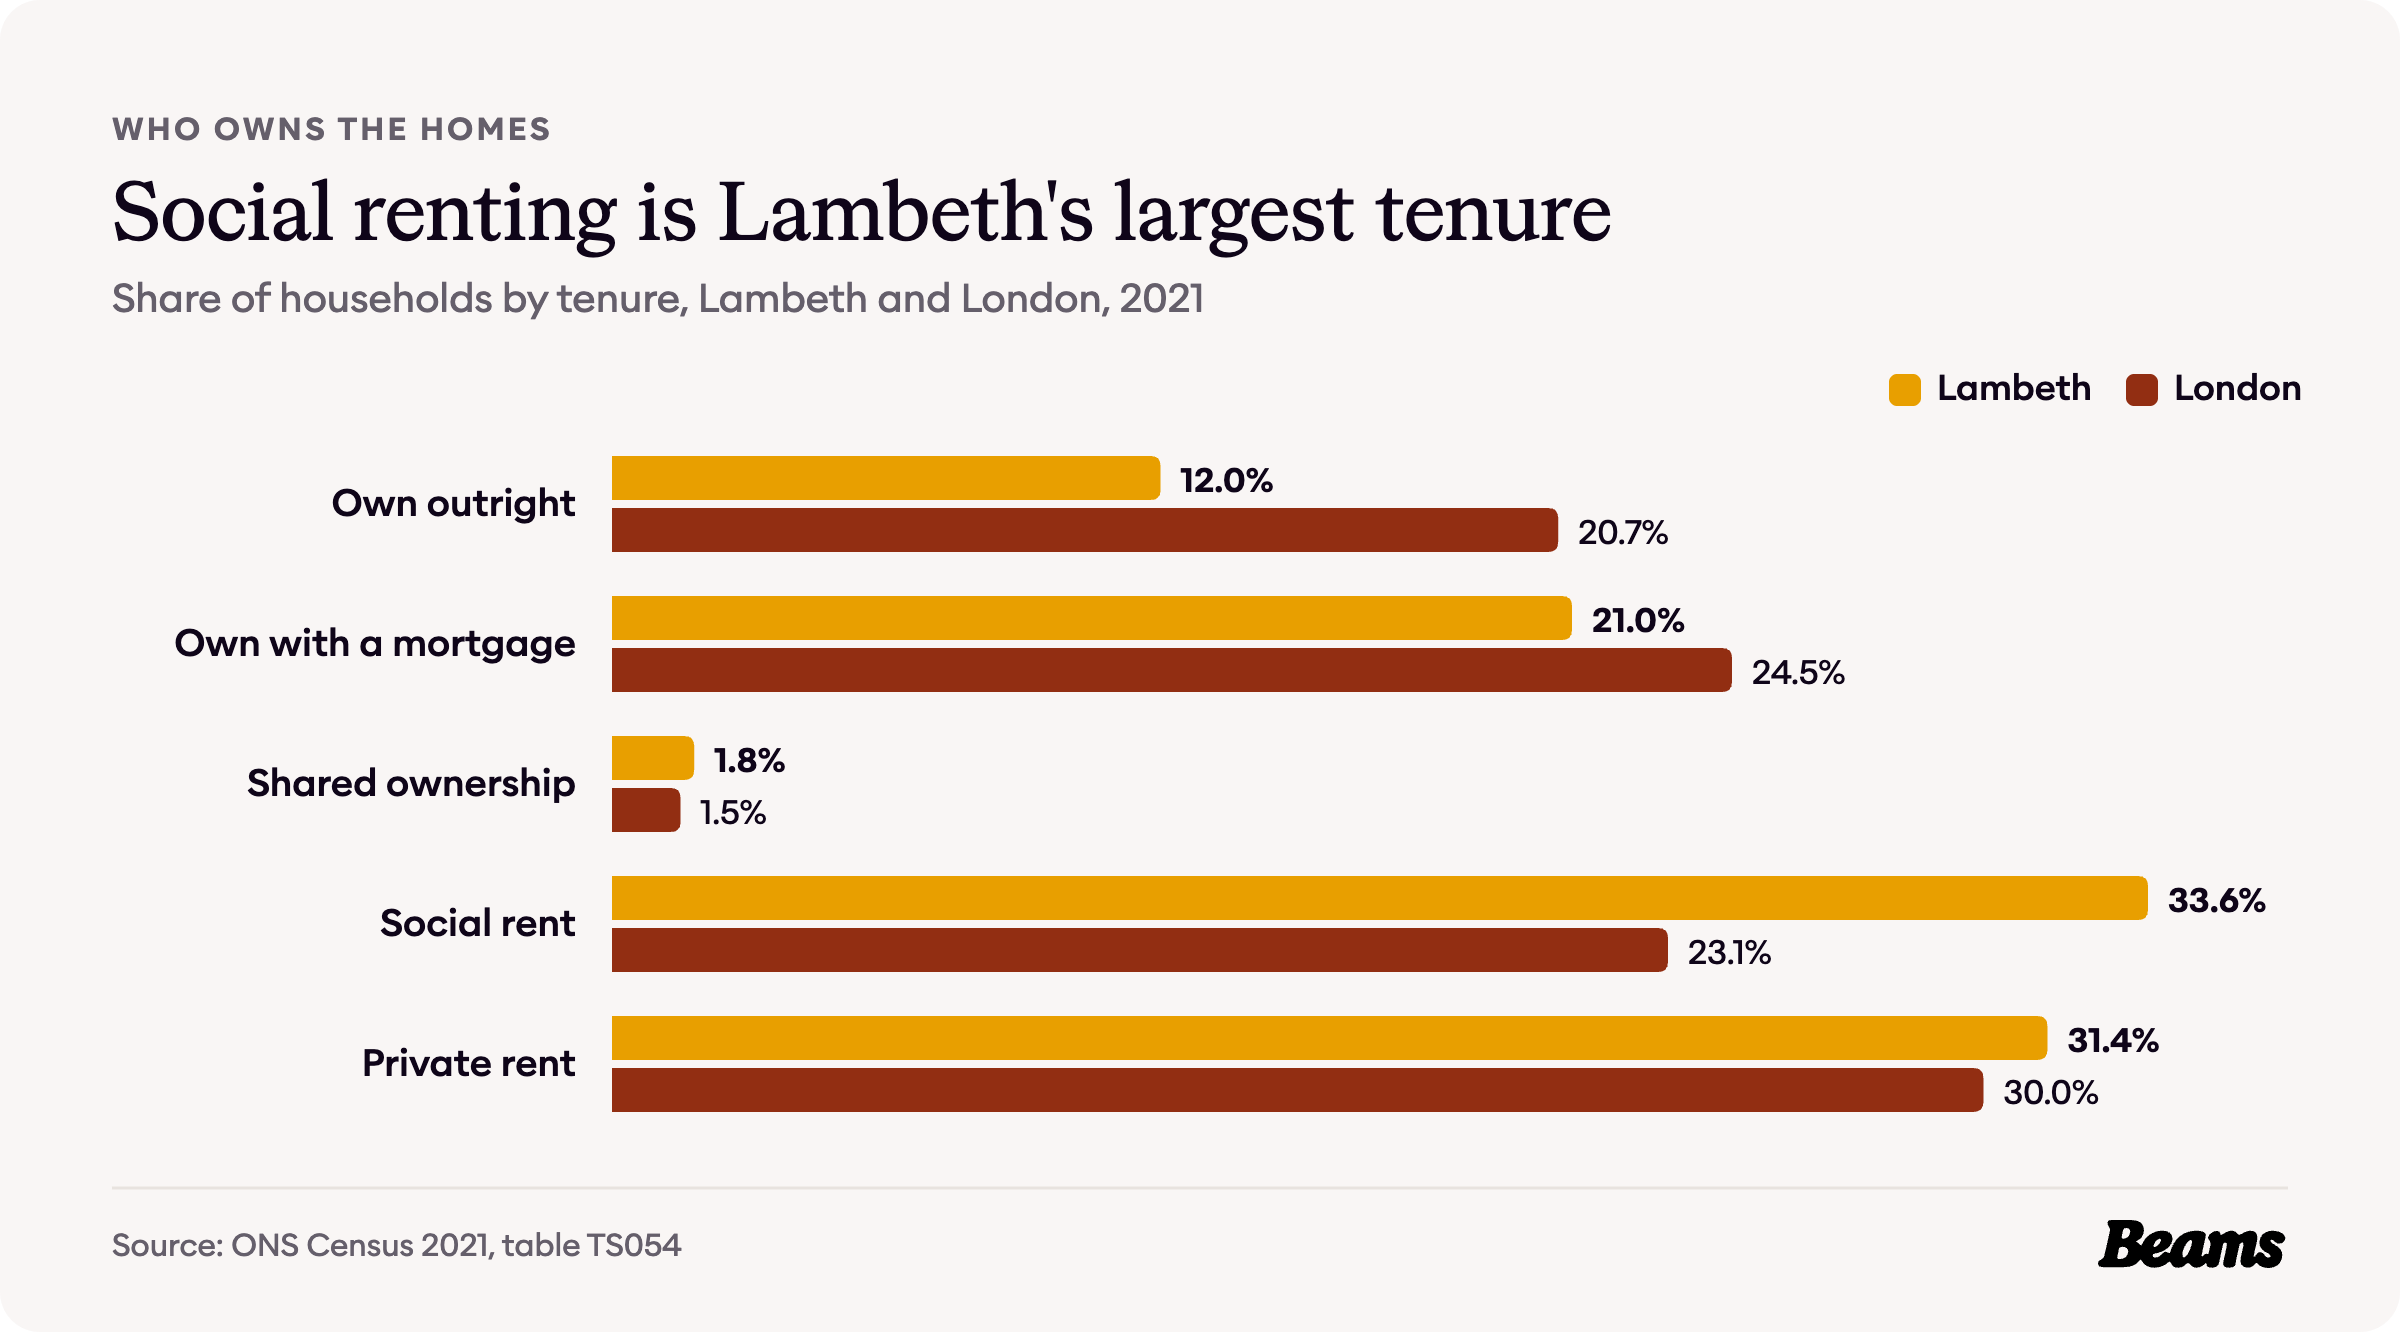
Social renting is the largest tenure in Lambeth, at 33.6% of households, against 23.1% across London. Private renting comes next, at 31.4% [4].
Only 33.0% of households own their home, 12.0% outright and 21.0% with a mortgage, against 45.2% across London. Another 1.8% are in shared ownership [4].
What a Lambeth home costs
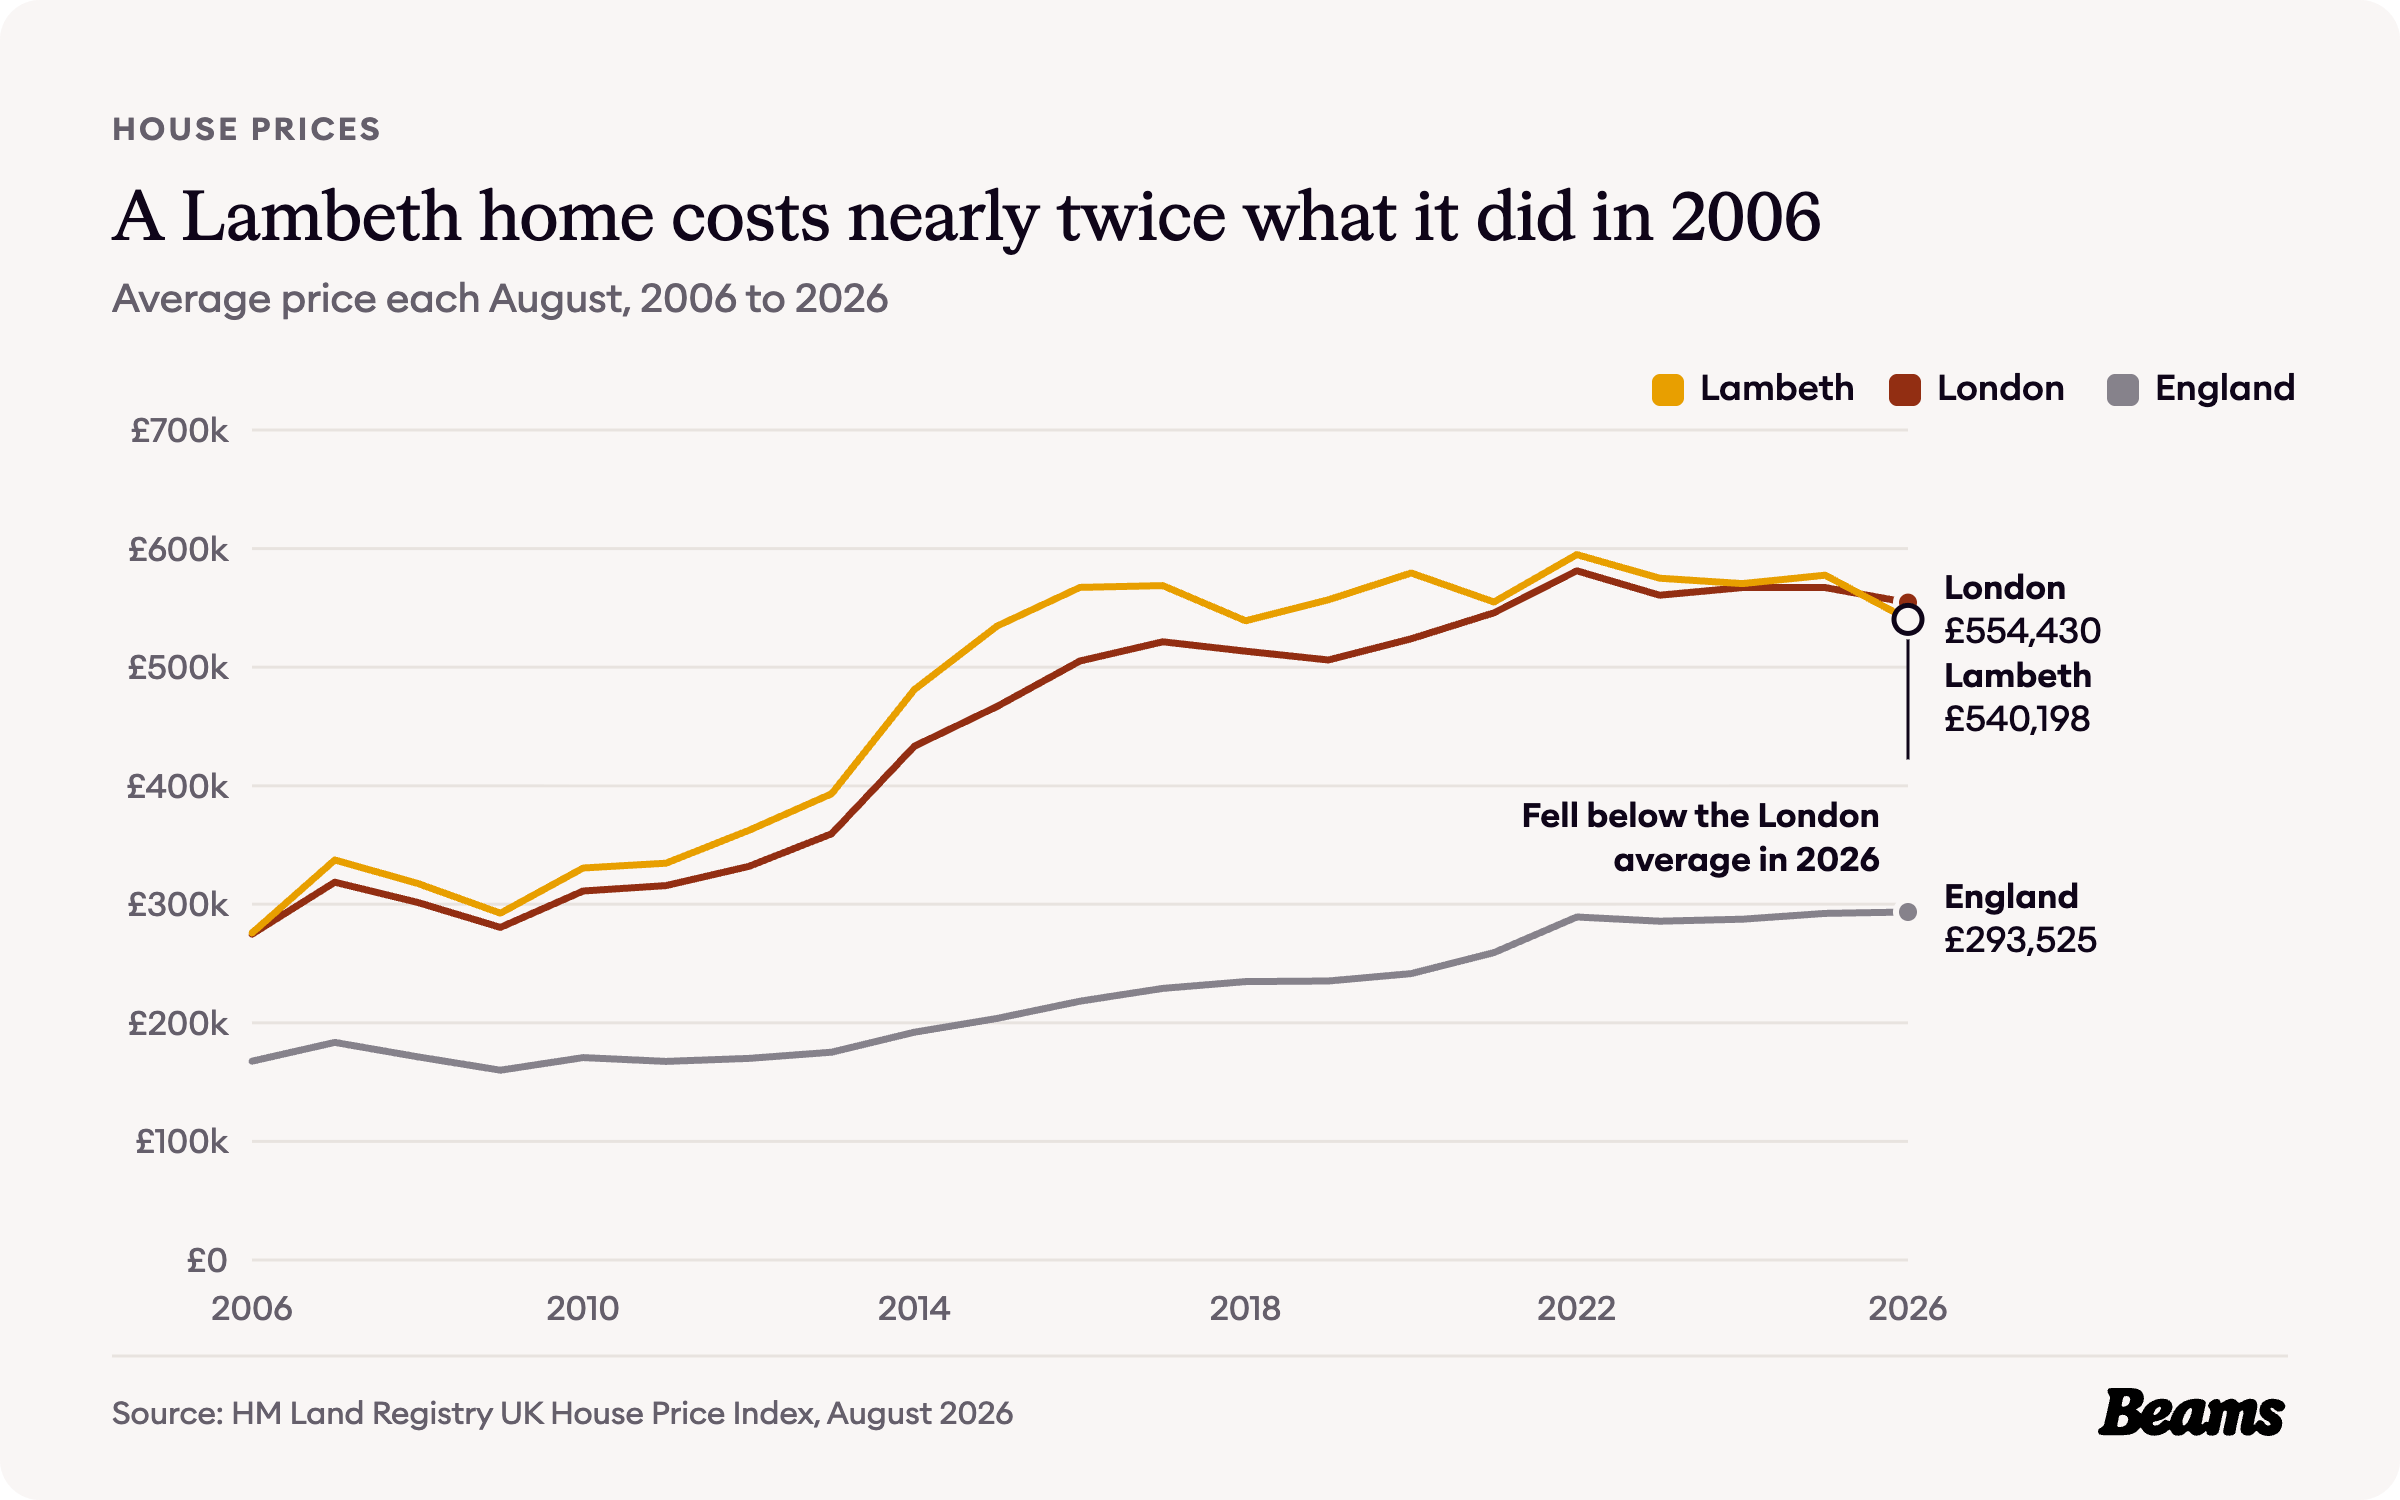
The average Lambeth home cost £540,198 in August 2026, 6.5% less than a year earlier, a steeper fall than London's 2.2% [5]. That puts it just below the London average of £554,430, though still well over the England average of £293,525 [6].
For twenty years Lambeth ran just ahead of London. In August 2006 its average was £275,726, a fraction above London's £274,815, and it stayed above every August until 2026. The biggest jump came between 2013 and 2014, from £393,217 to £480,985, and the August peak was £594,977 in 2022 [6].
Flats, terraces and the cost of moving up
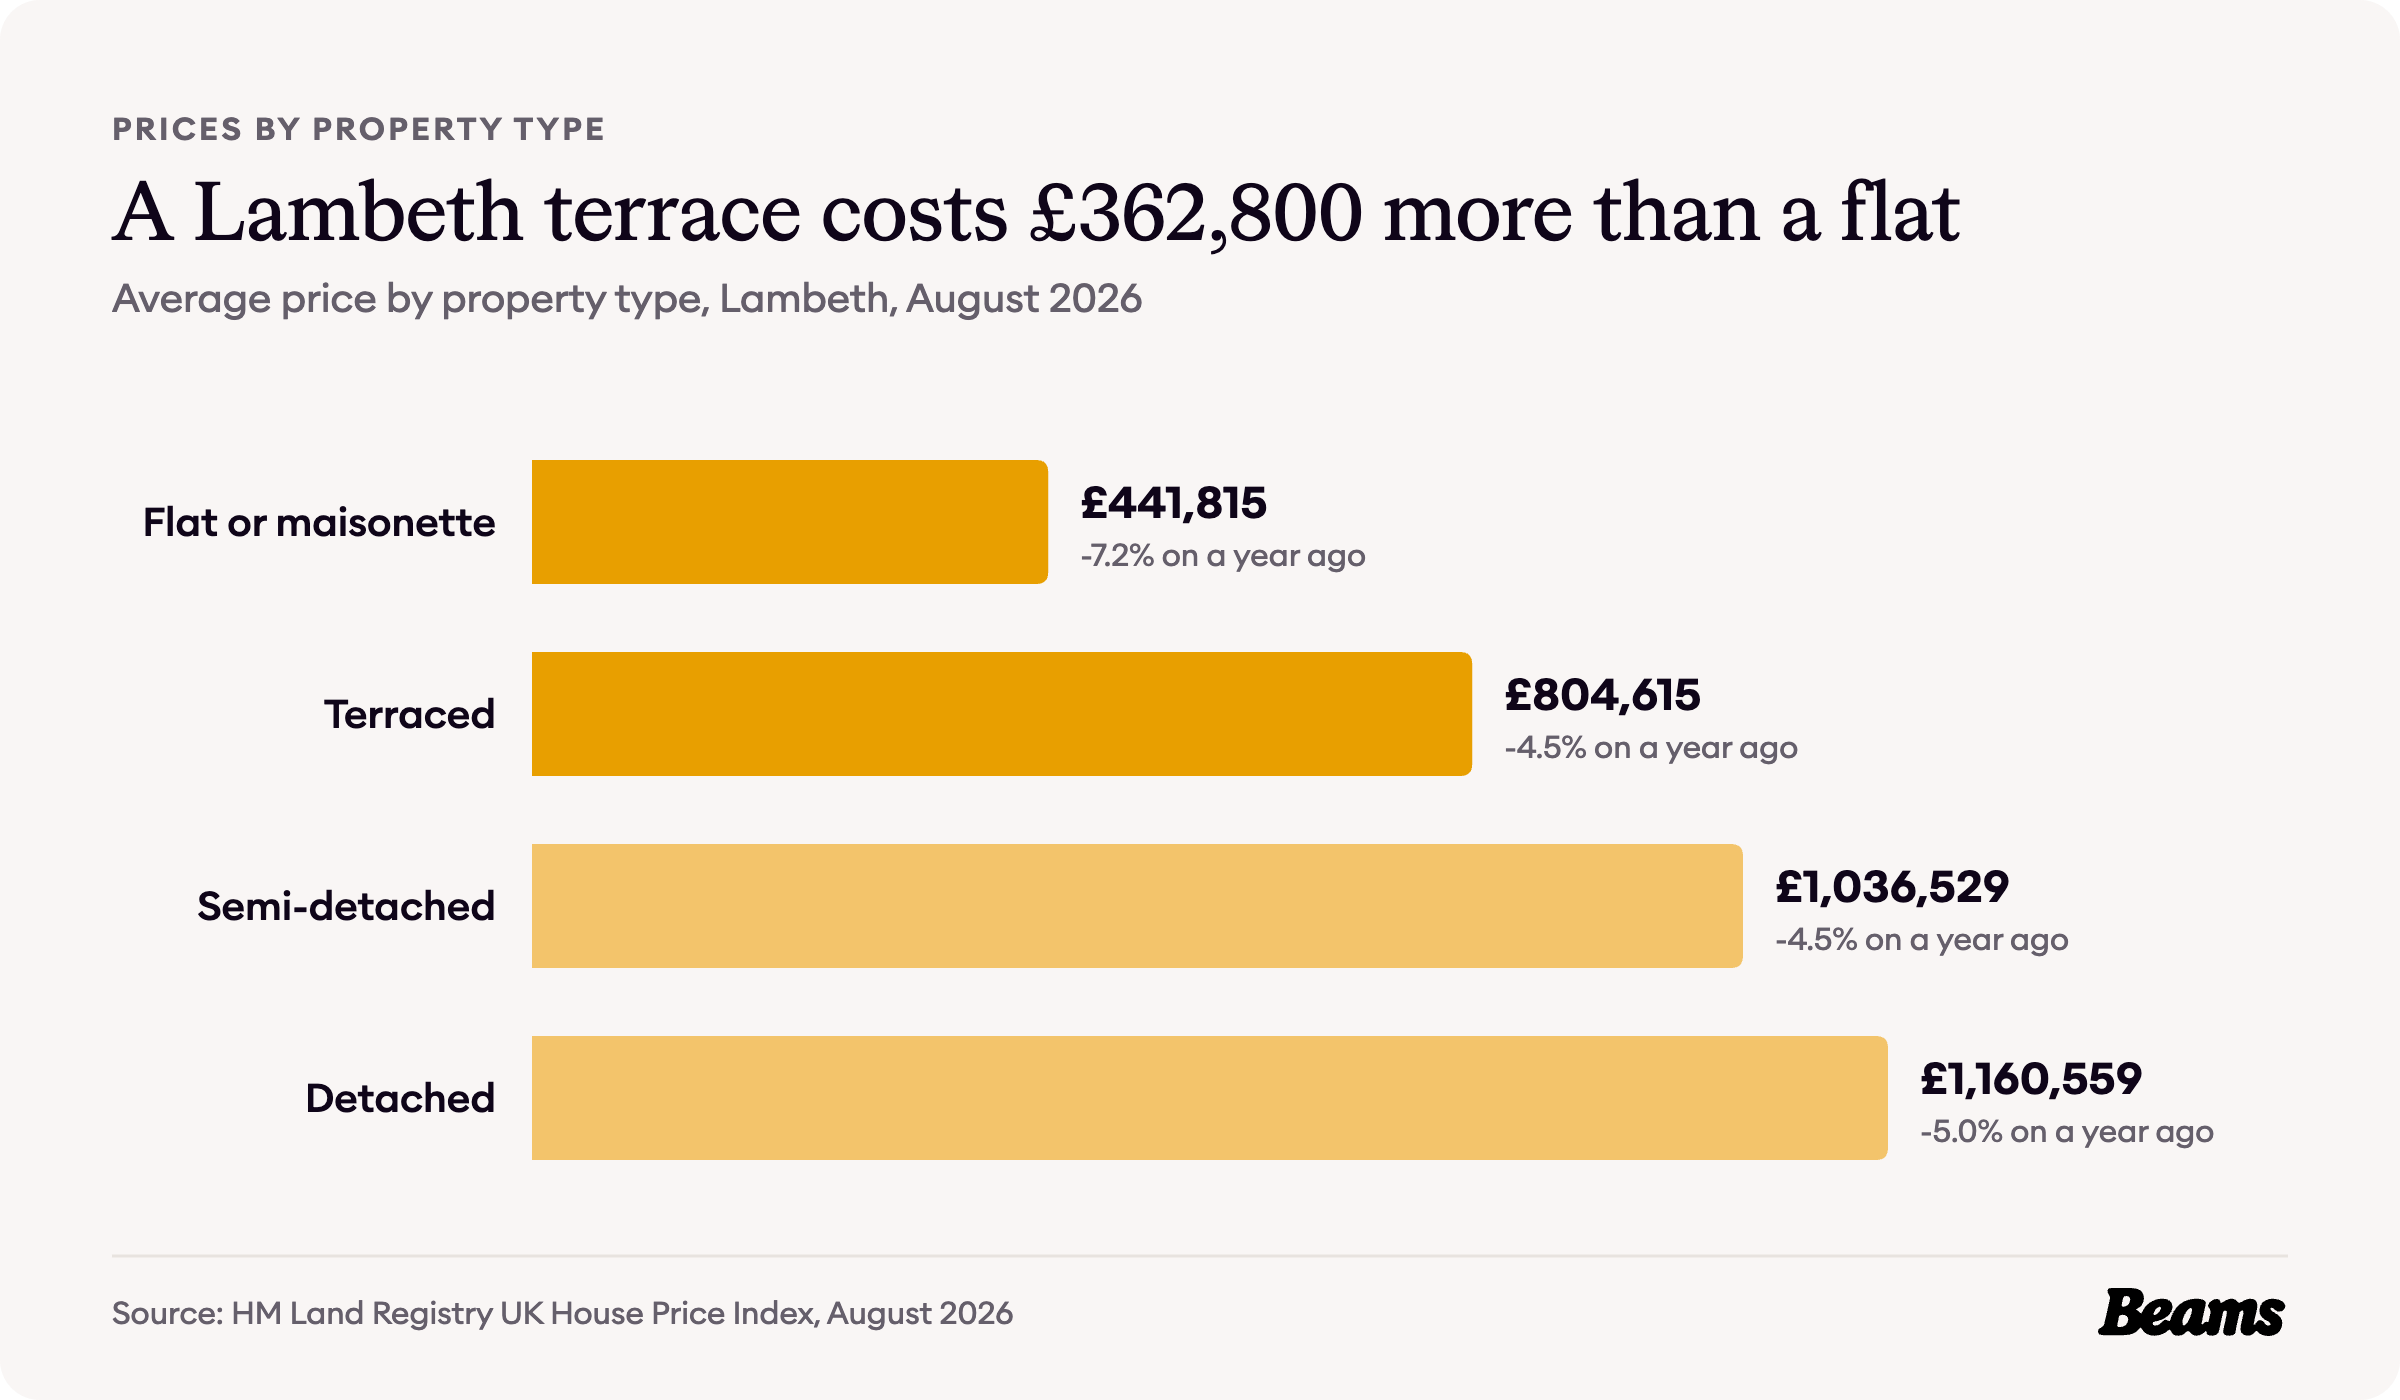
A Lambeth flat or maisonette averaged £441,815 in August 2026, down 7.2% on a year earlier, and a terraced house £804,615, a gap of £362,800 [5]. Semi-detached houses averaged £1,036,529 and detached houses £1,160,559. Lambeth's terraces cost far more than London's £648,650 average, while its flats are close to London's £427,310 [6].
First-time buyers paid an average of £474,320 and home movers £682,063 [5]. For a household in a terrace that has outgrown it, a house extension in Lambeth adds the room without paying the next price step, and with it the moving costs.
What it costs to rent in Lambeth
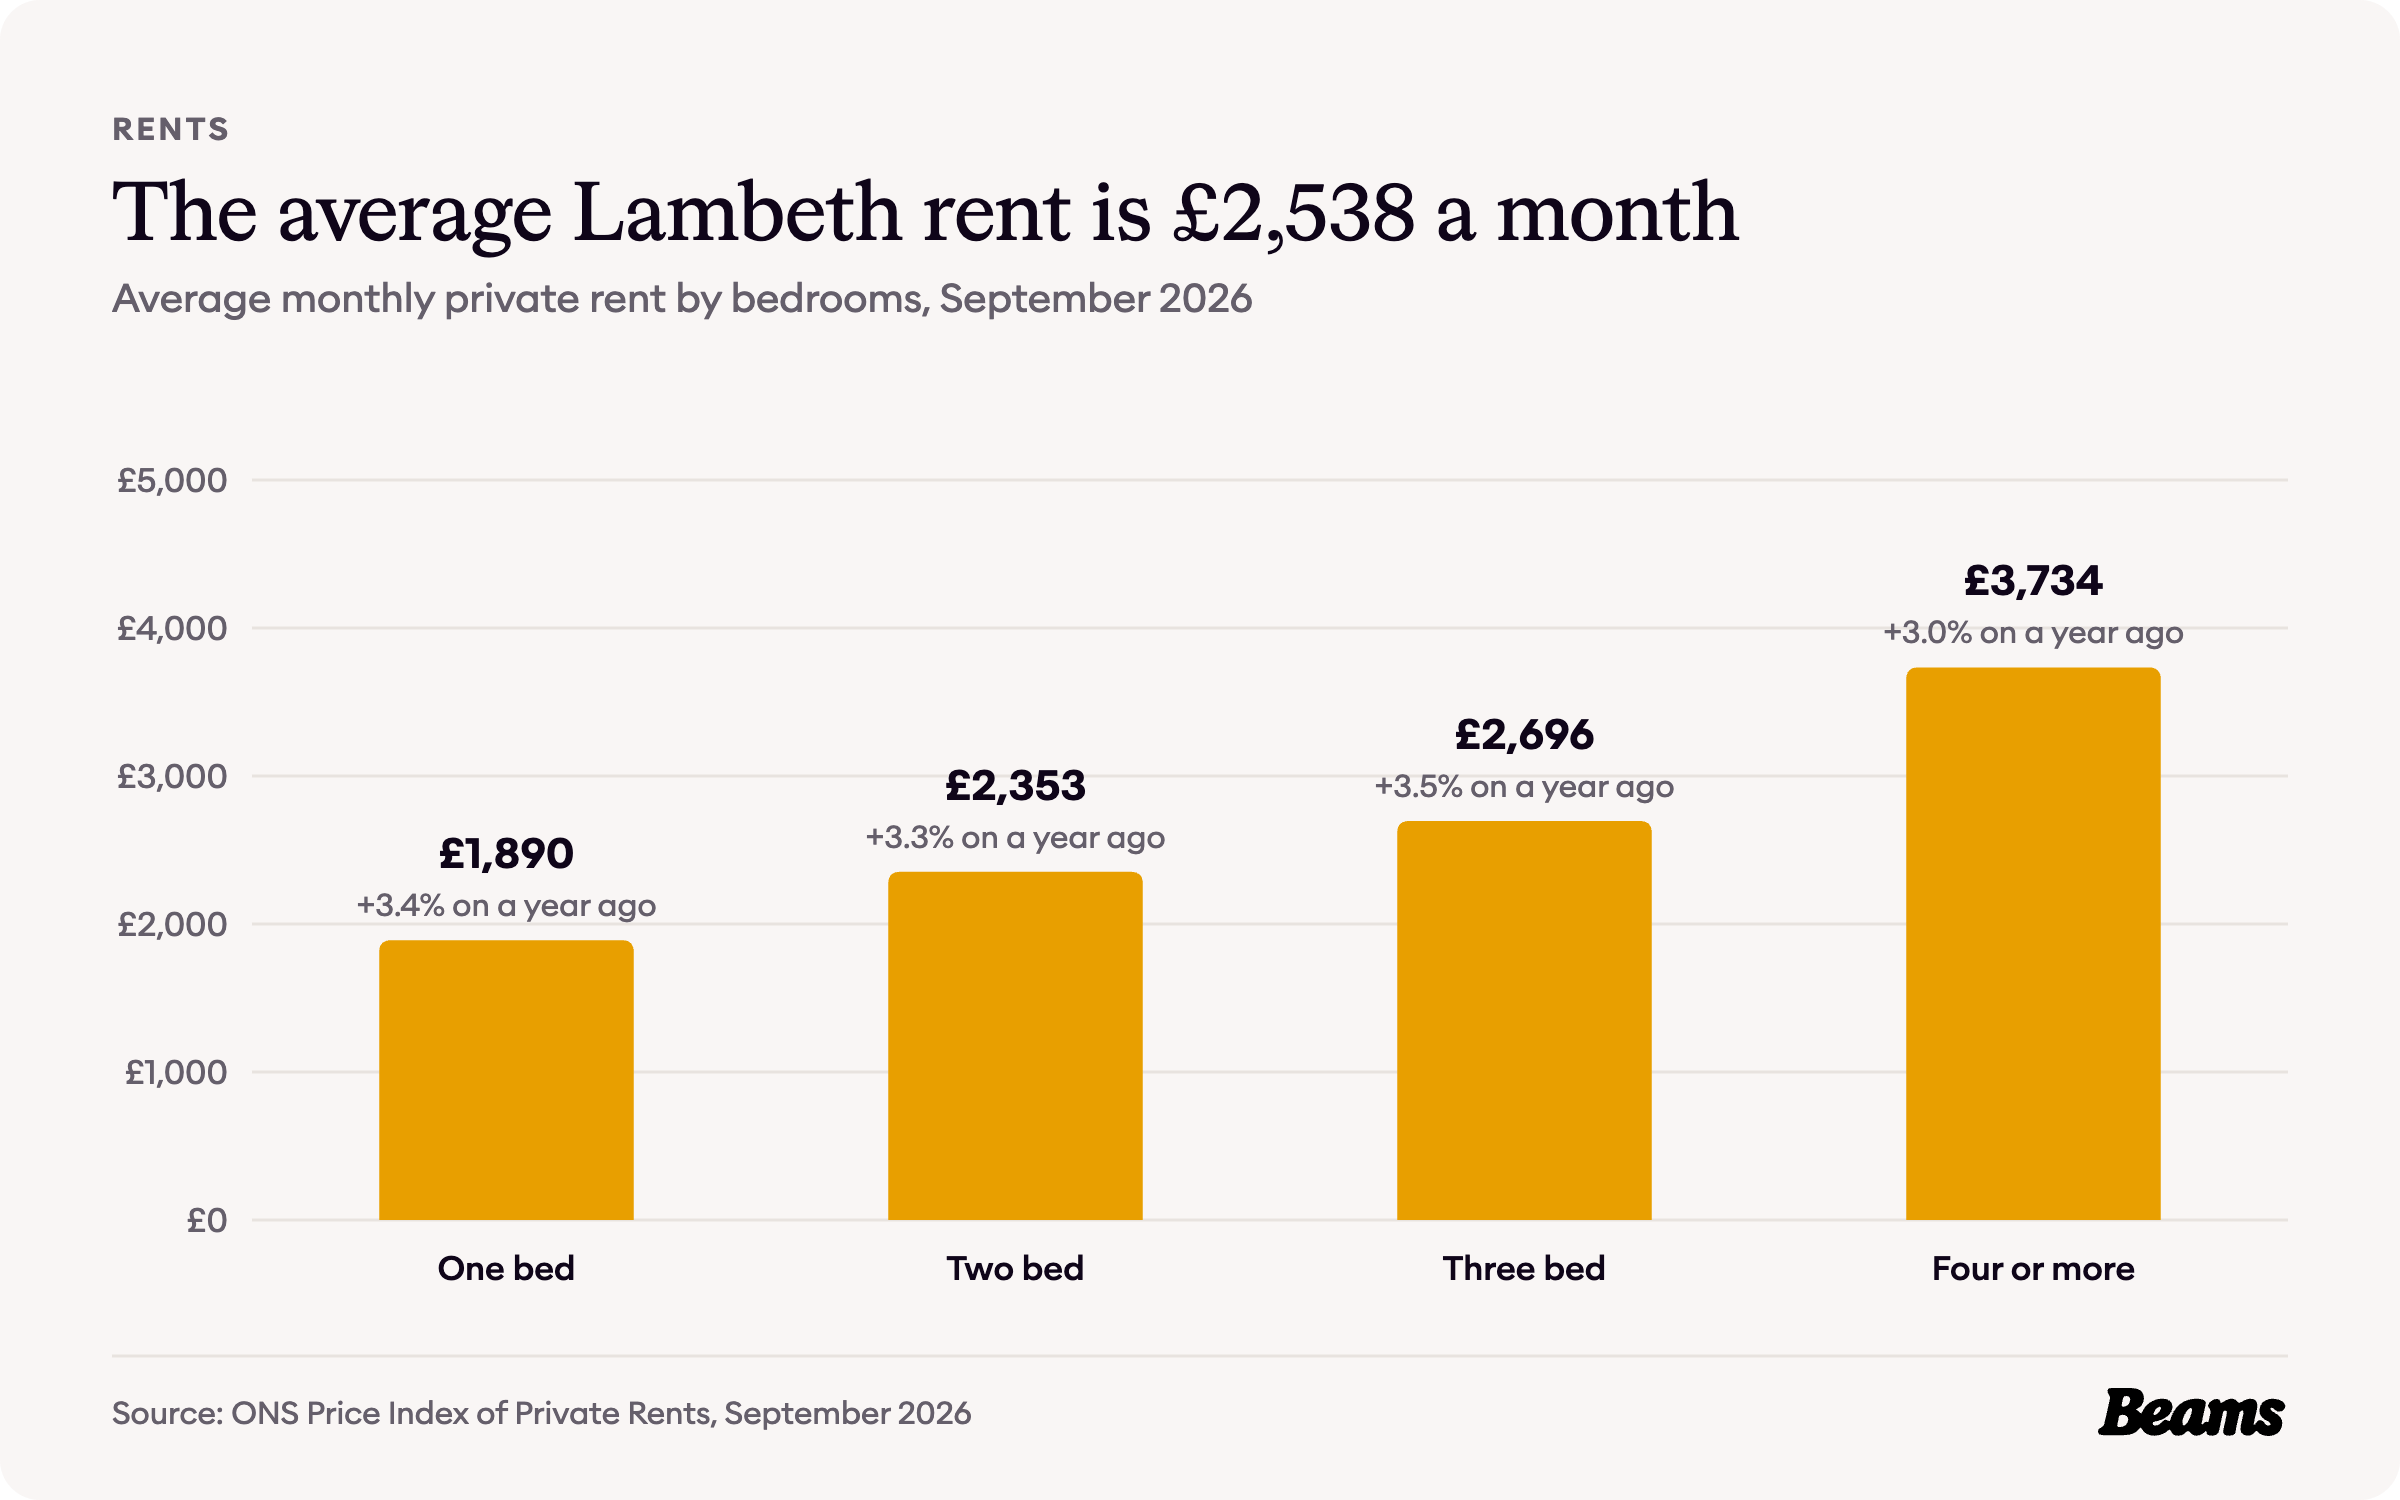
The average private rent in Lambeth was £2,538 a month in September 2026, up 3.4% from £2,454 a year earlier, a rise the ONS describes as similar to London's [5]. Rents rose while prices fell, so over the year renting got dearer and buying got cheaper.
A one-bedroom home averaged £1,890 a month, a two-bedroom home £2,353, a three-bedroom home £2,696 and a home with four or more bedrooms £3,734 [5]. Nearly a third of households rent privately [4], and when a converted flat is refitted between tenancies the bathroom is usually near the top of the list, which is where a bathroom renovation in Lambeth pays its way.
Council Tax bands in Lambeth
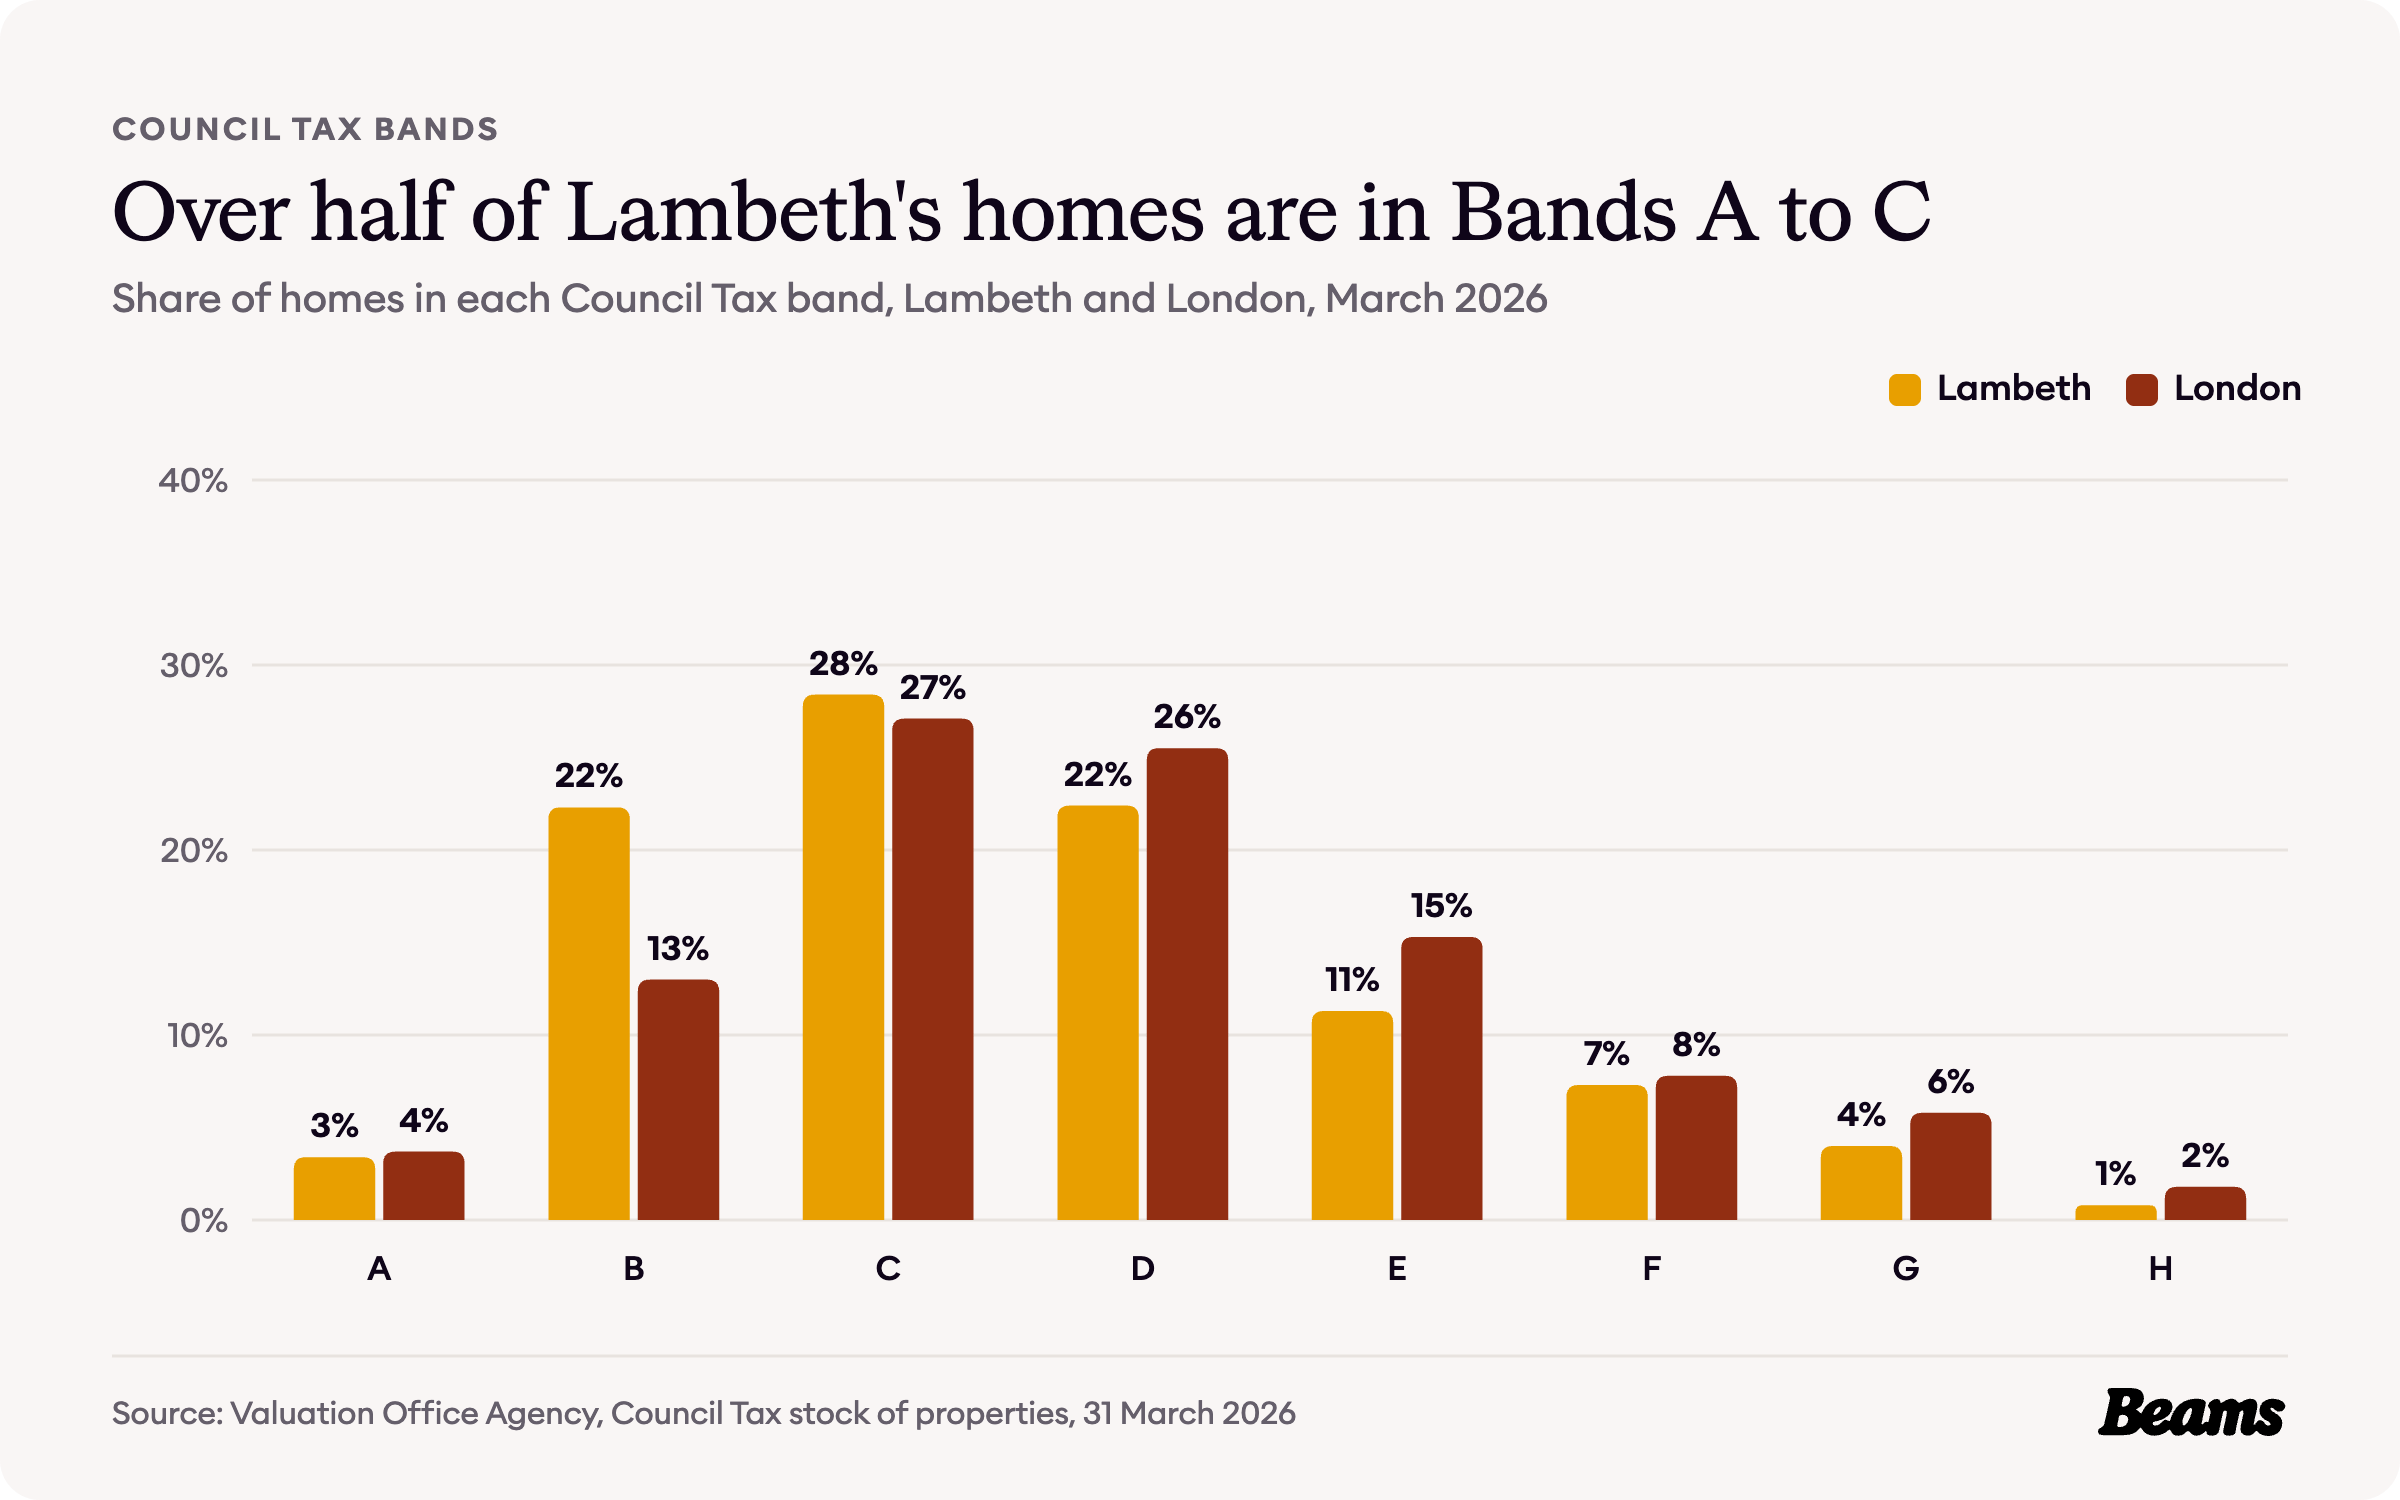
Lambeth's homes sit lower in the Council Tax bands than London's as a whole. 54.1% are in Bands A to C, against 43.8% across London, and Band B alone holds 22.3%, against 13.0% for London [2].
At the top end, 12.1% of homes are in Bands F, G or H, against 15.4% for London, and only 0.8% are in Band H [2]. That fits a borough of converted houses. GOV.UK lists splitting a property into self-contained flats among the changes that can move a home into a different band, and each self-contained unit has its own band [7].
The rules on your street
Lambeth has 62 conservation areas, and the council says they cover approximately 30% of the borough [8].
In all or parts of nine of them, Article 4 Directions remove some permitted development rights for changes to the outside of buildings, so planning permission is needed for the works the direction lists: Albert Square, Hyde Farm, Lansdowne Gardens, Leigham Court Estate, Park Hall Road, St Marks, Stockwell Park, Streatham Lodge and Vauxhall [9]. Basements are among the jobs where these local rules matter most, so a basement conversion in Lambeth starts with a check of the address.
Lambeth also has a 2024 Article 4 Direction that withdraws the permitted development right to turn a house into a small house in multiple occupation, so that change now needs a planning application [9].
On timing, the national rule applies: once an application is valid, a council should decide anything other than major development within eight weeks, unless a longer period is agreed in writing [10]. With about 30% of the borough in a conservation area, our builders in Lambeth and planners check what applies to your address before any work begins.
Lambeth housing statistics at a glance
- Average house price, August 2026: £540,198 (London £554,430) [5] [6]
- Change on a year earlier: -6.5% (London -2.2%) [5]
- Average flat or maisonette: £441,815 (London £427,310) [5] [6]
- Average terraced house: £804,615 (London £648,650) [5] [6]
- Average private rent, September 2026: £2,538 a month, up 3.4% [5]
- Homes built before 1900: 36.4% (London 20.8%) [2]
- Households living in a flat: 75.2% (London 54.0%) [3]
- Households in social rented homes: 33.6% (London 23.1%) [4]
- Households who own their home: 33.0% (London 45.2%) [4]
- Conservation areas: 62, covering about 30% of the borough [8]
Frequently asked questions
References
- British History Online, Survey of London volume 26: General introduction. Lambeth: Southern Area, published 1956.
- Valuation Office Agency, Council Tax: stock of properties 2026. Tables CTSOP4.1 and CTSOP1.1, properties by build period and by Council Tax band at 31 March 2026.
- ONS, Census 2021 table TS044: Accommodation type. Households by type of home, Lambeth and London.
- ONS, Census 2021 table TS054: Tenure. Households by tenure, Lambeth and London.
- ONS, Housing prices in Lambeth. UK House Price Index for August 2026 and Price Index of Private Rents for September 2026, published 21 October 2026.
- HM Land Registry, UK House Price Index. Average prices for Lambeth, London and England, August 2006 to August 2026.
- GOV.UK, How Council Tax works: working out your Council Tax. Changes that can move a property into a different band.
- Lambeth Council, Conservation area profiles. Number and coverage of Lambeth's conservation areas. Accessed 29 October 2026.
- Lambeth Council, Article 4 Directions. Conservation areas with Article 4 Directions and the 2024 small HMO direction. Accessed 29 October 2026.
- GOV.UK, Determining a planning application. Planning practice guidance on statutory time limits, paragraph 001.
Thinking of improving rather than moving?
Tell us about your Lambeth home and what you want to change. We'll give you a free estimate, then up to three vetted builders quote against the same specification.