
Hammersmith housing statistics 2026
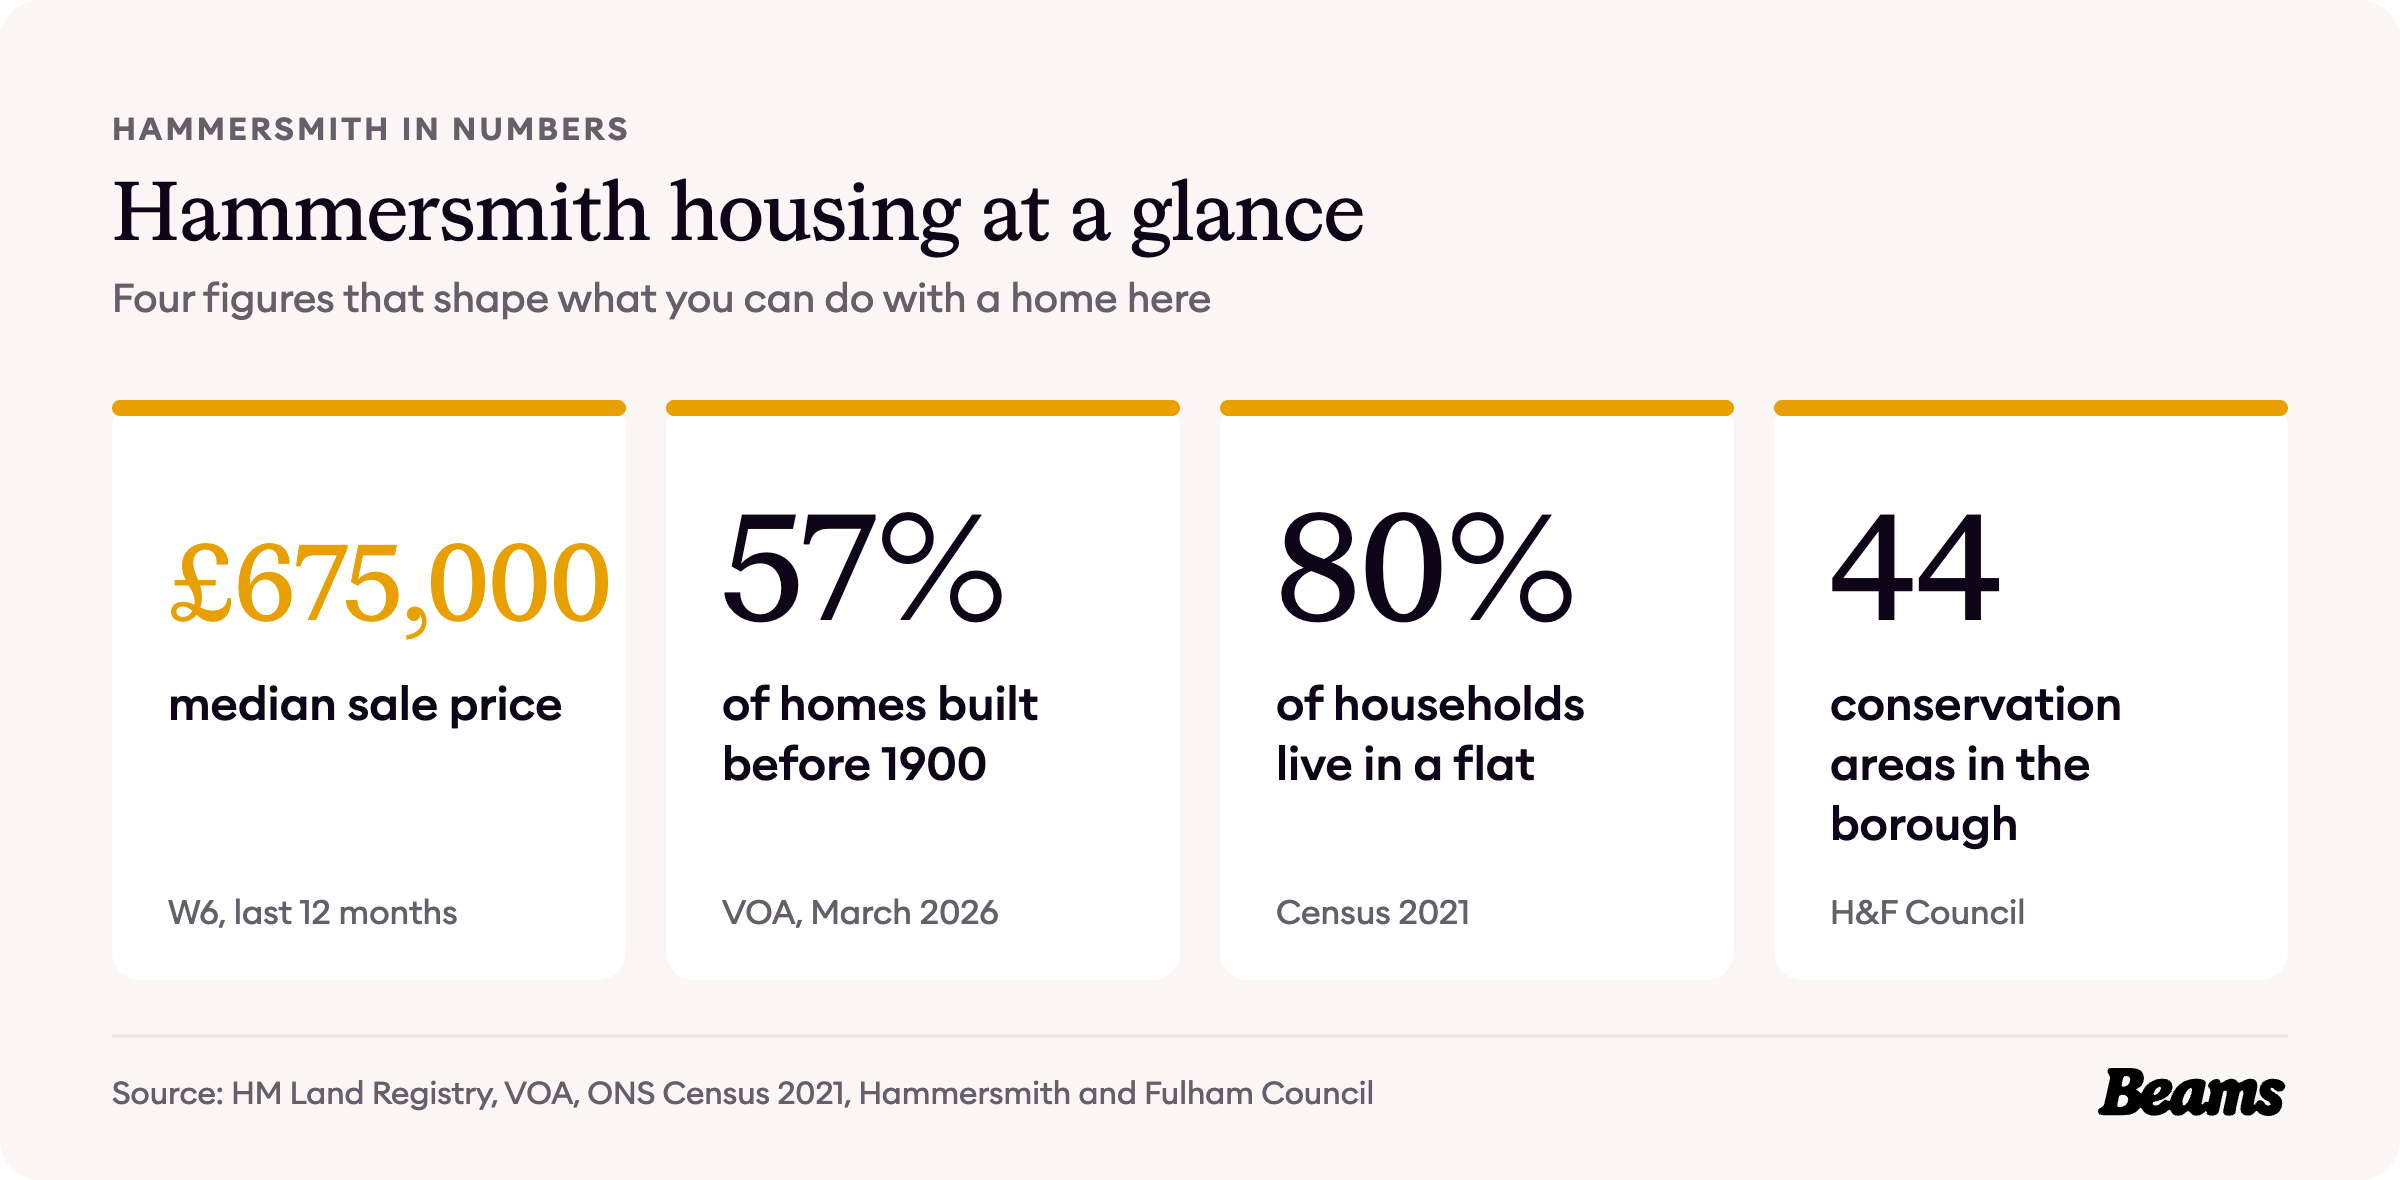
Hammersmith grew along King Street and filled its fields with houses once the railway arrived. More than half of its homes went up before 1900, four in five households now live in a flat, and the typical W6 home sold for £675,000 in the last year. These are the numbers behind that story.
Every figure comes from an official source and is dated, so you can see exactly what you are working with before you plan a home renovation in Hammersmith. The sources are numbered in brackets and listed in full at the end of the page.
How Hammersmith was built
Hammersmith started as a small but important settlement on the Great West Road, King Street, which ran from London to Bath. Much of the land to the north, around what is now Ravenscourt Park, was pasture, arable fields, orchards and nurseries [1].
The railway changed that. In 1869 the line from Waterloo to Richmond opened with a station at Shaftesbury Road, now Ravenscourt Park, and the fields and nurseries began to fill with houses in the styles of the time. The grounds of Ravenscourt House became a public park in 1888 [1].
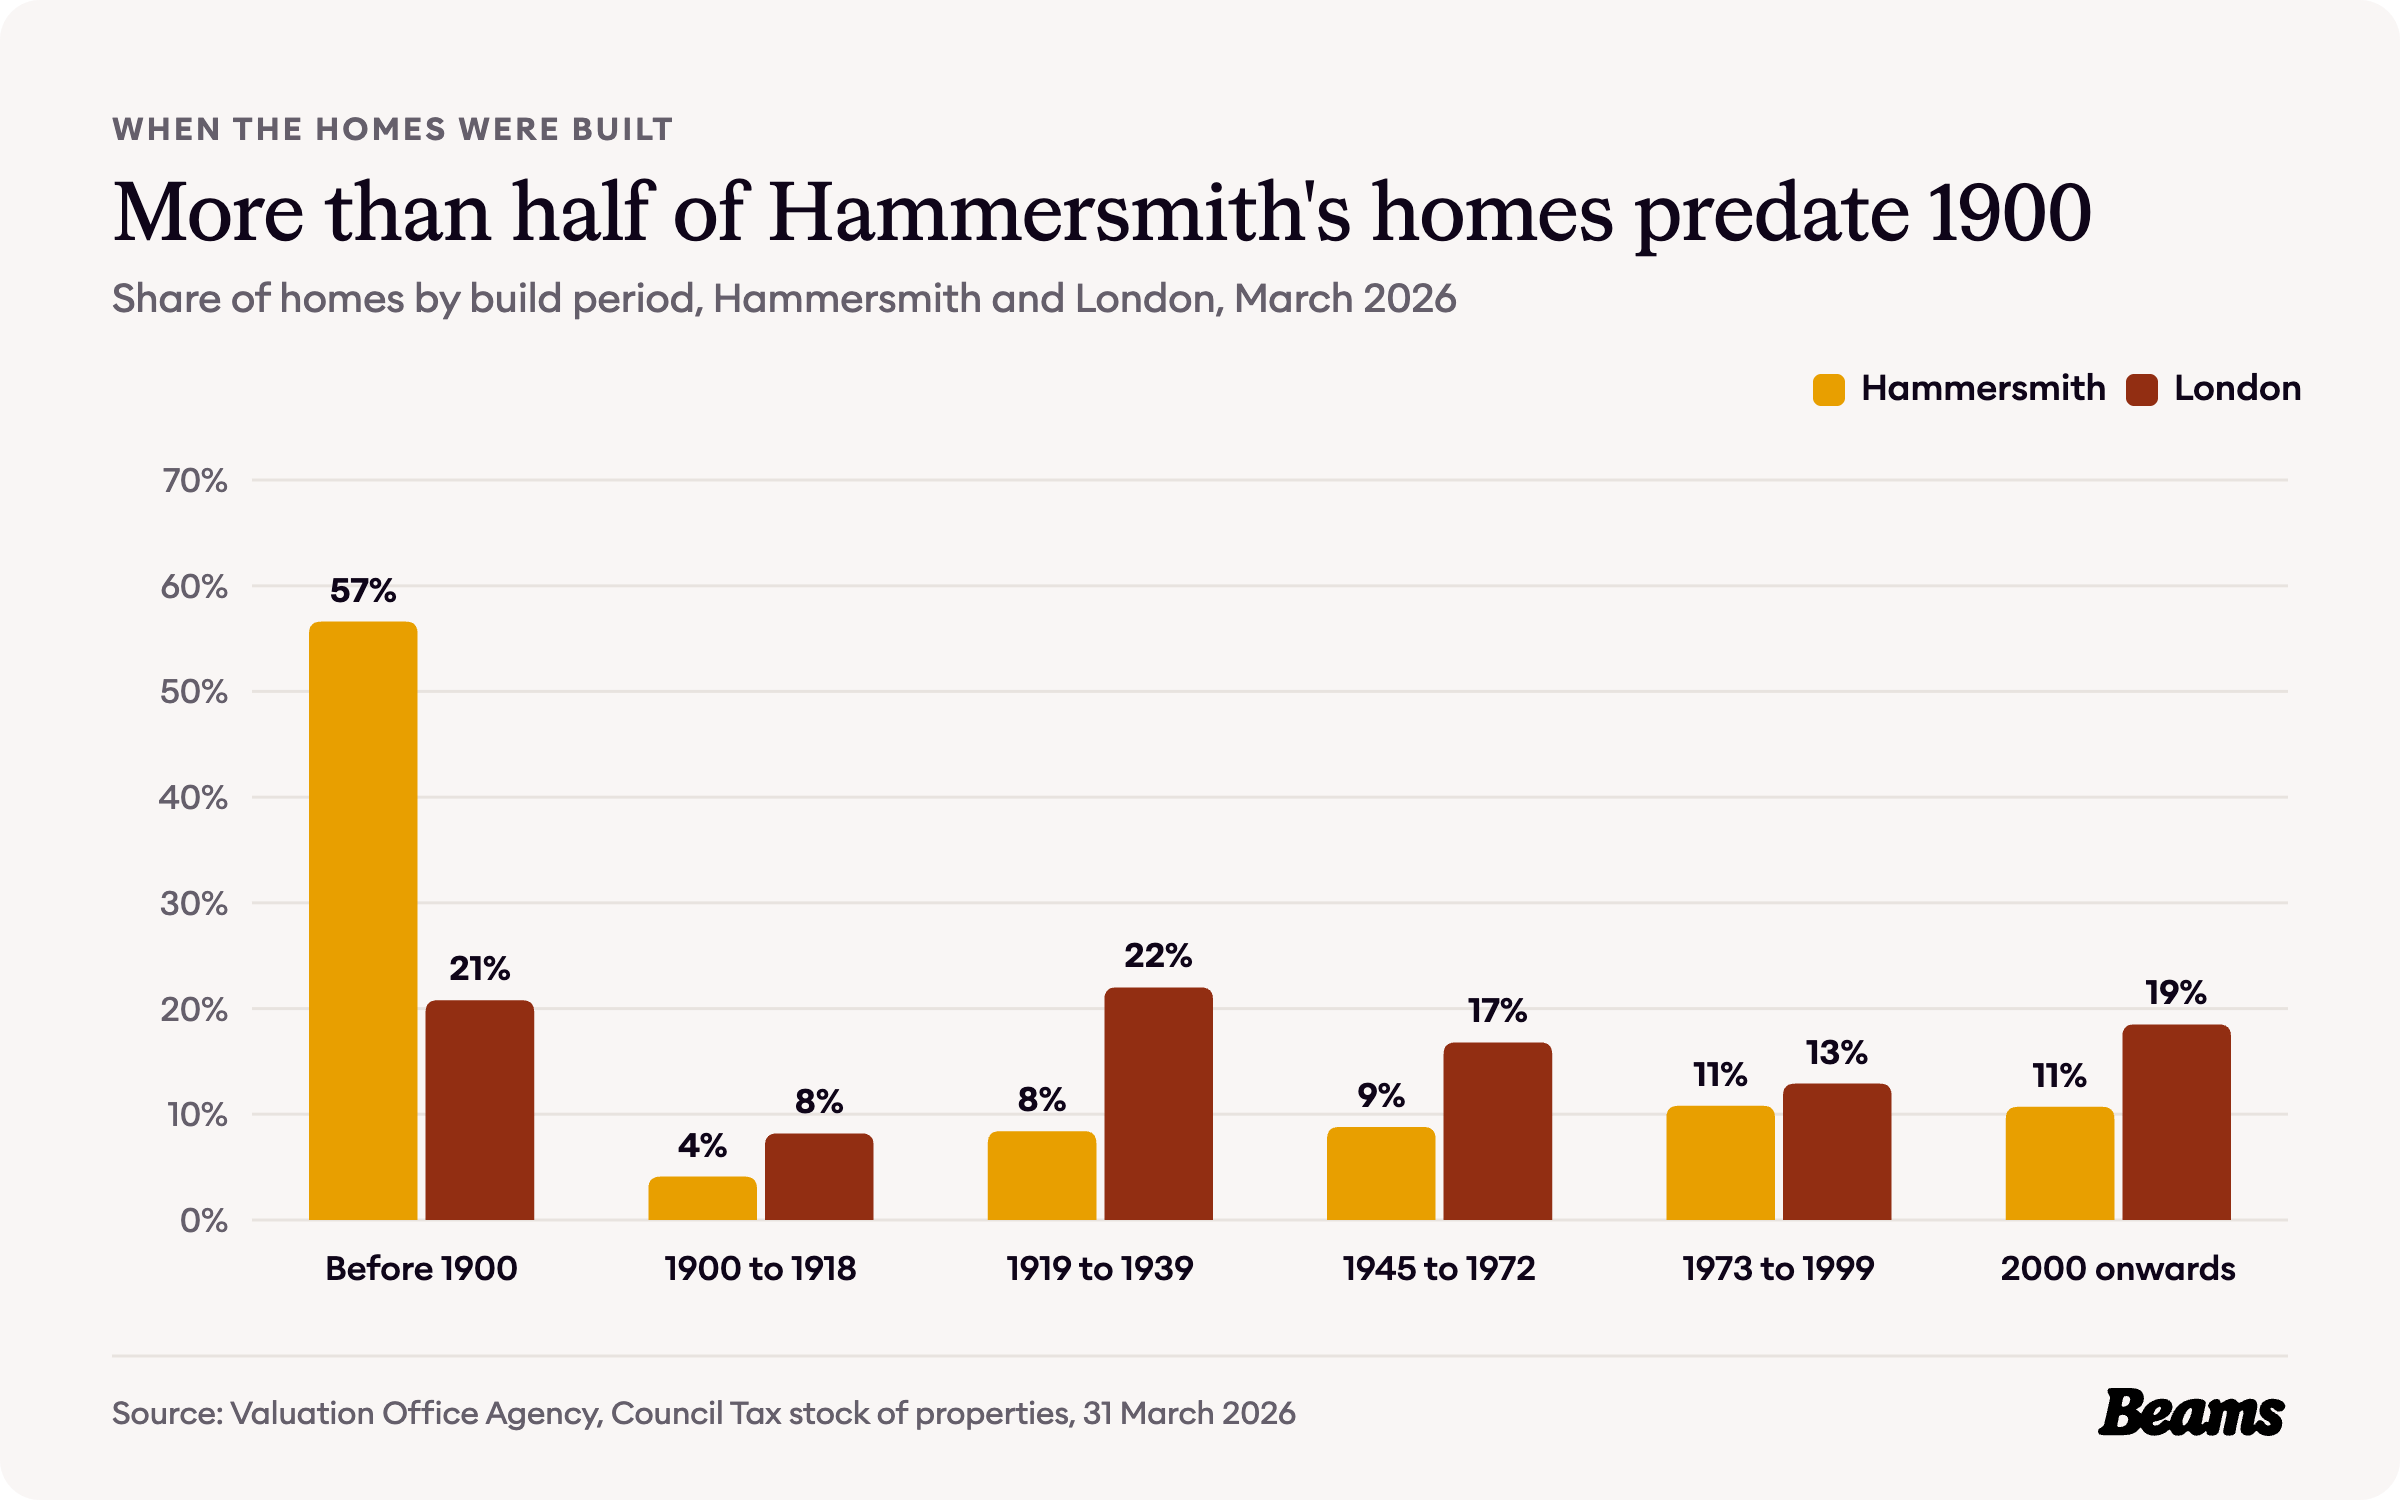
Most of those houses are still standing. The Valuation Office Agency counts 29,810 homes in the census areas that make up Hammersmith on this page, and 56.6% of them were built before 1900. That is nearly three times the London share of 20.8% [2].
Each later period added far less. Just 8.4% of Hammersmith's homes date from between the wars, against 22.0% across London, and 10.7% have been built since 2000, against 18.5% [2]. Streets of Victorian terraces with pitched roofs and unused roof space are why a loft conversion in Hammersmith is so often the first big project on a house here.
How Hammersmith households live
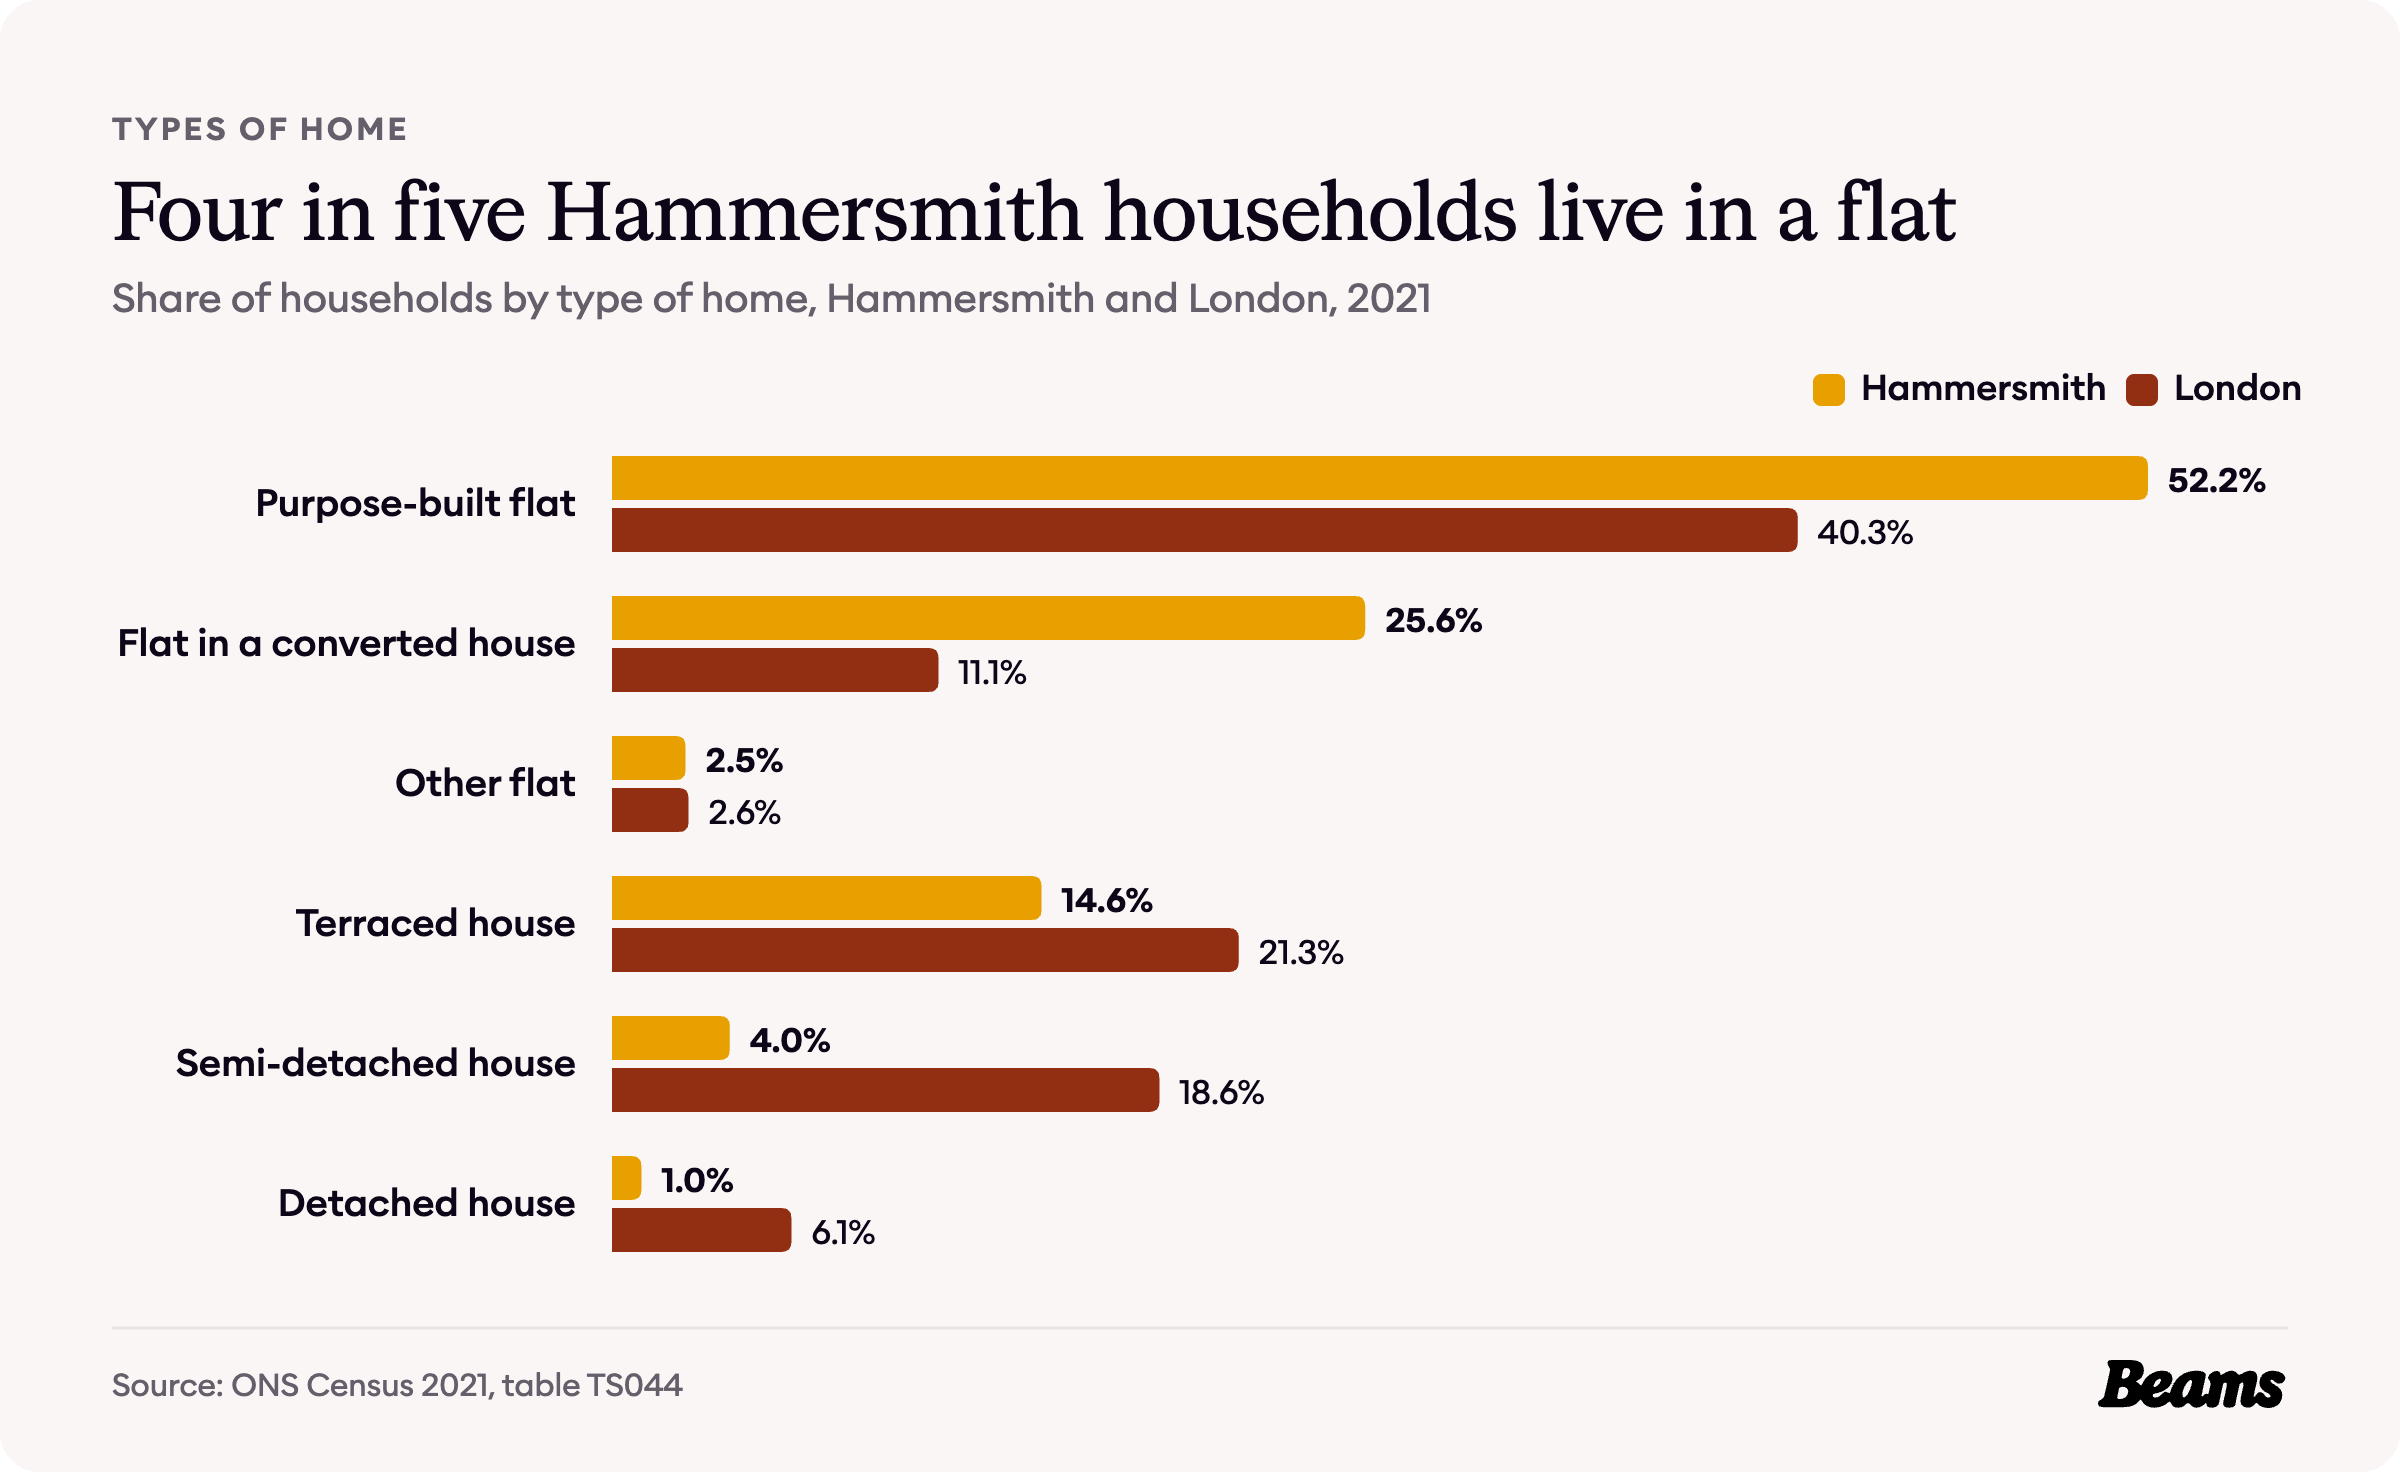
The 2021 Census counted 26,052 households in these areas. 52.2% live in a purpose-built flat and another 25.6% in a flat inside a converted house, more than twice the London share of 11.1% [3].
Add the 2.5% in other flats and 80.3% of Hammersmith households live in a flat, against 54.0% across London. Only 14.6% live in a terraced house and 5.0% in a semi-detached or detached one [3]. Those converted flats are houses that have been divided up, so a kitchen renovation in Hammersmith is usually about getting more out of the same footprint rather than building out.
Who owns Hammersmith's homes
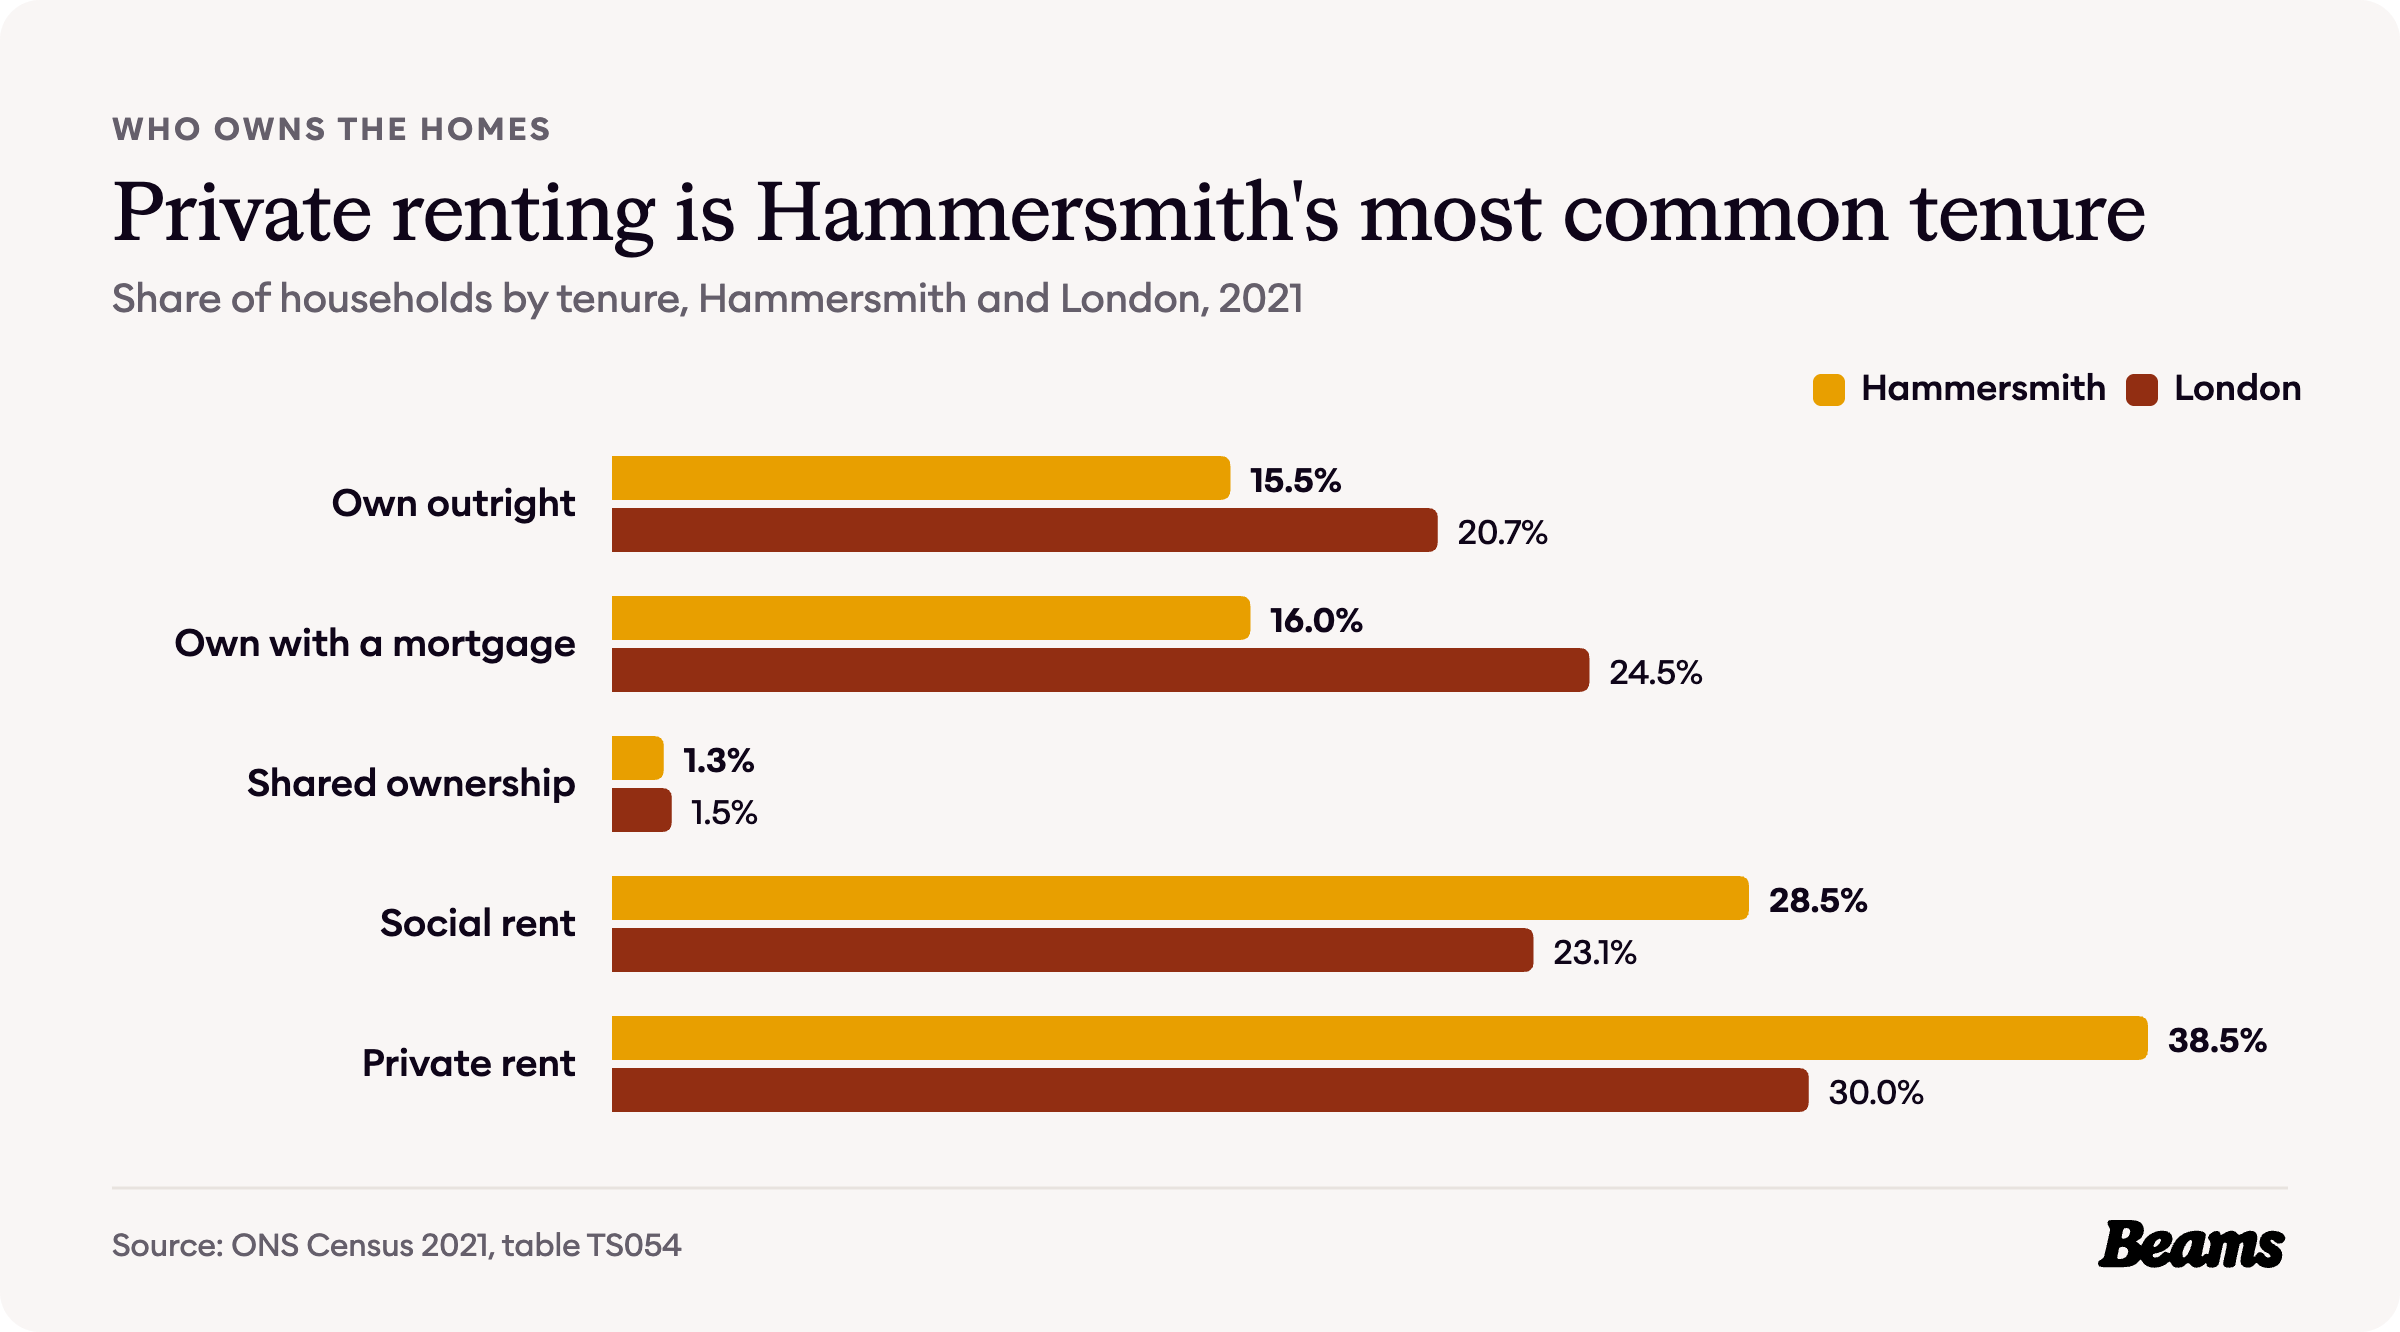
Fewer than a third of Hammersmith households own their home. 15.5% own outright and 16.0% with a mortgage, 31.5% in all, compared with 45.2% across London [4].
Private renting is the most common tenure, at 38.5% of households against 30.0% for London. Another 28.5% rent from the council or a housing association [4].
What a home costs in Hammersmith
The UK House Price Index and the rent figures below cover the whole borough of Hammersmith and Fulham. The census and VOA figures on this page cover the Ravenscourt Park North, Ravenscourt Park South, Brackenbury, Brook Green, Hammersmith Broadway, Barons Court, West Kensington and North End areas, and the local sale prices cover the W6 postcode district.
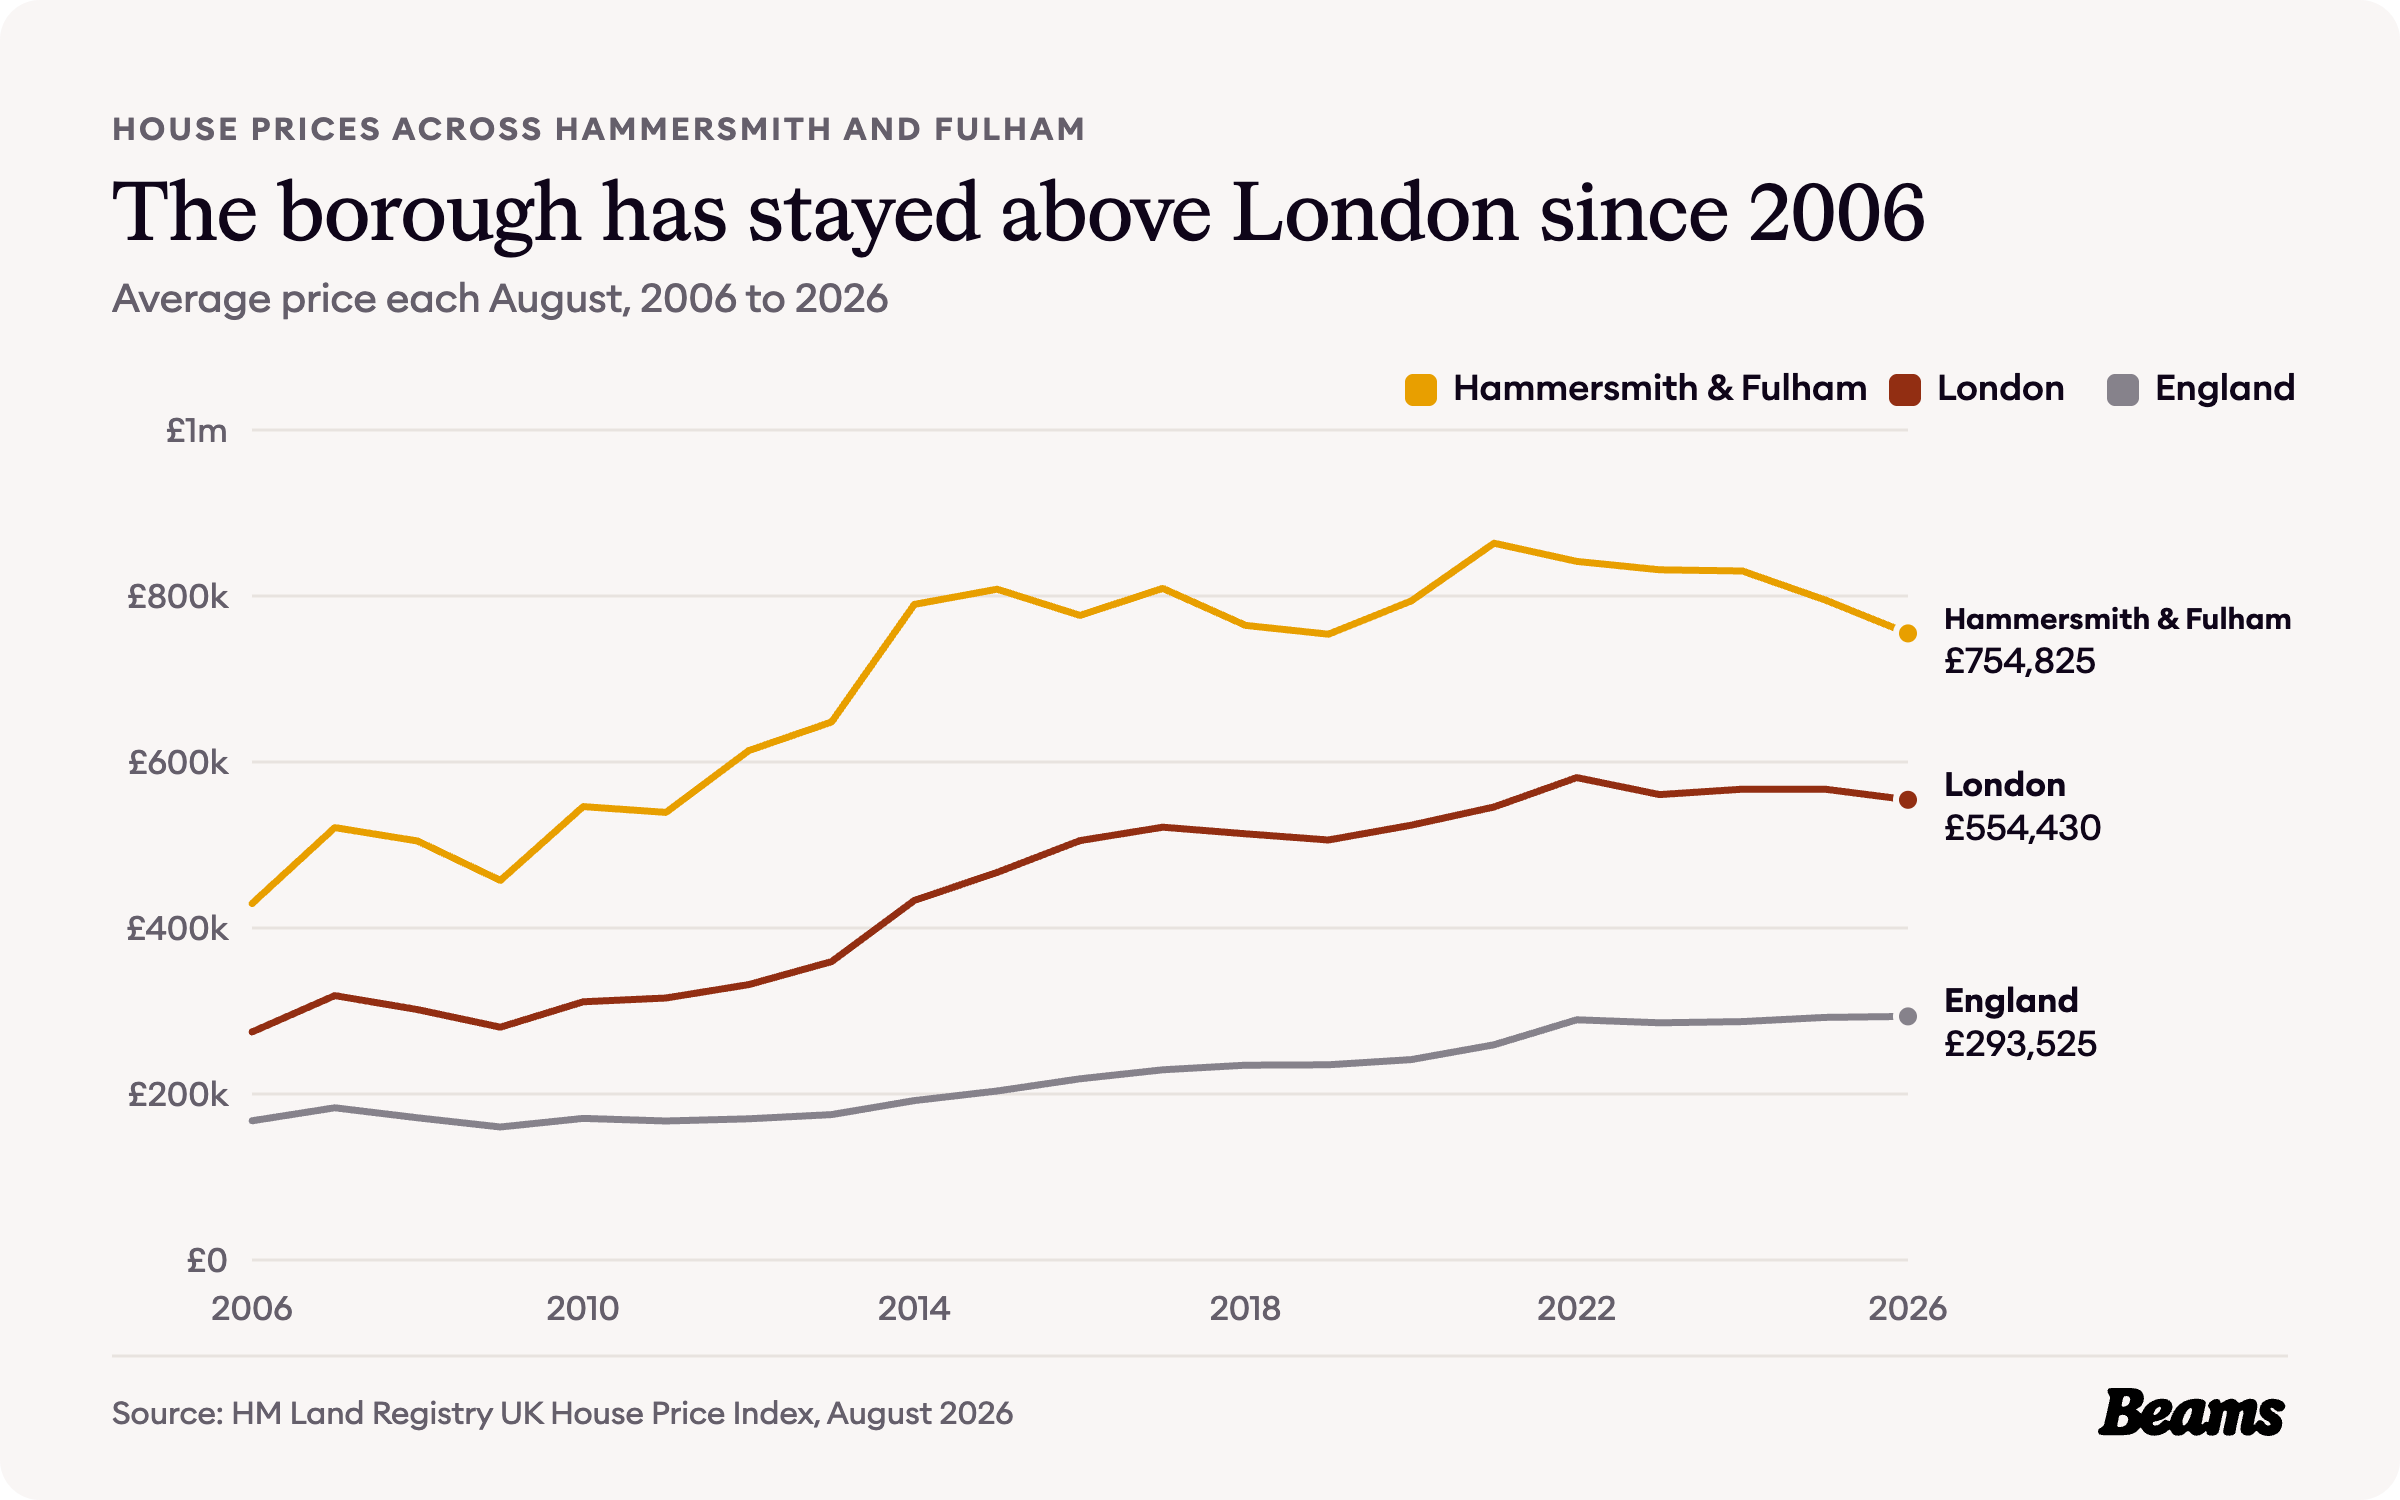
The average home in Hammersmith and Fulham cost £754,825 in August 2026, 5.1% less than a year earlier [5]. That fall is more than twice London's 2.2%, but the borough still sits about 36% above the London average of £554,430 and more than two and a half times the England average of £293,525 [6].
The borough has been above London every August for the last 20 years. In August 2006 its average home cost £429,297 against £274,815 for London. The biggest jump came between 2013 and 2014, from £648,285 to £789,866, and prices peaked at £863,699 in 2021 [6].
Flats, terraces and the gap between them
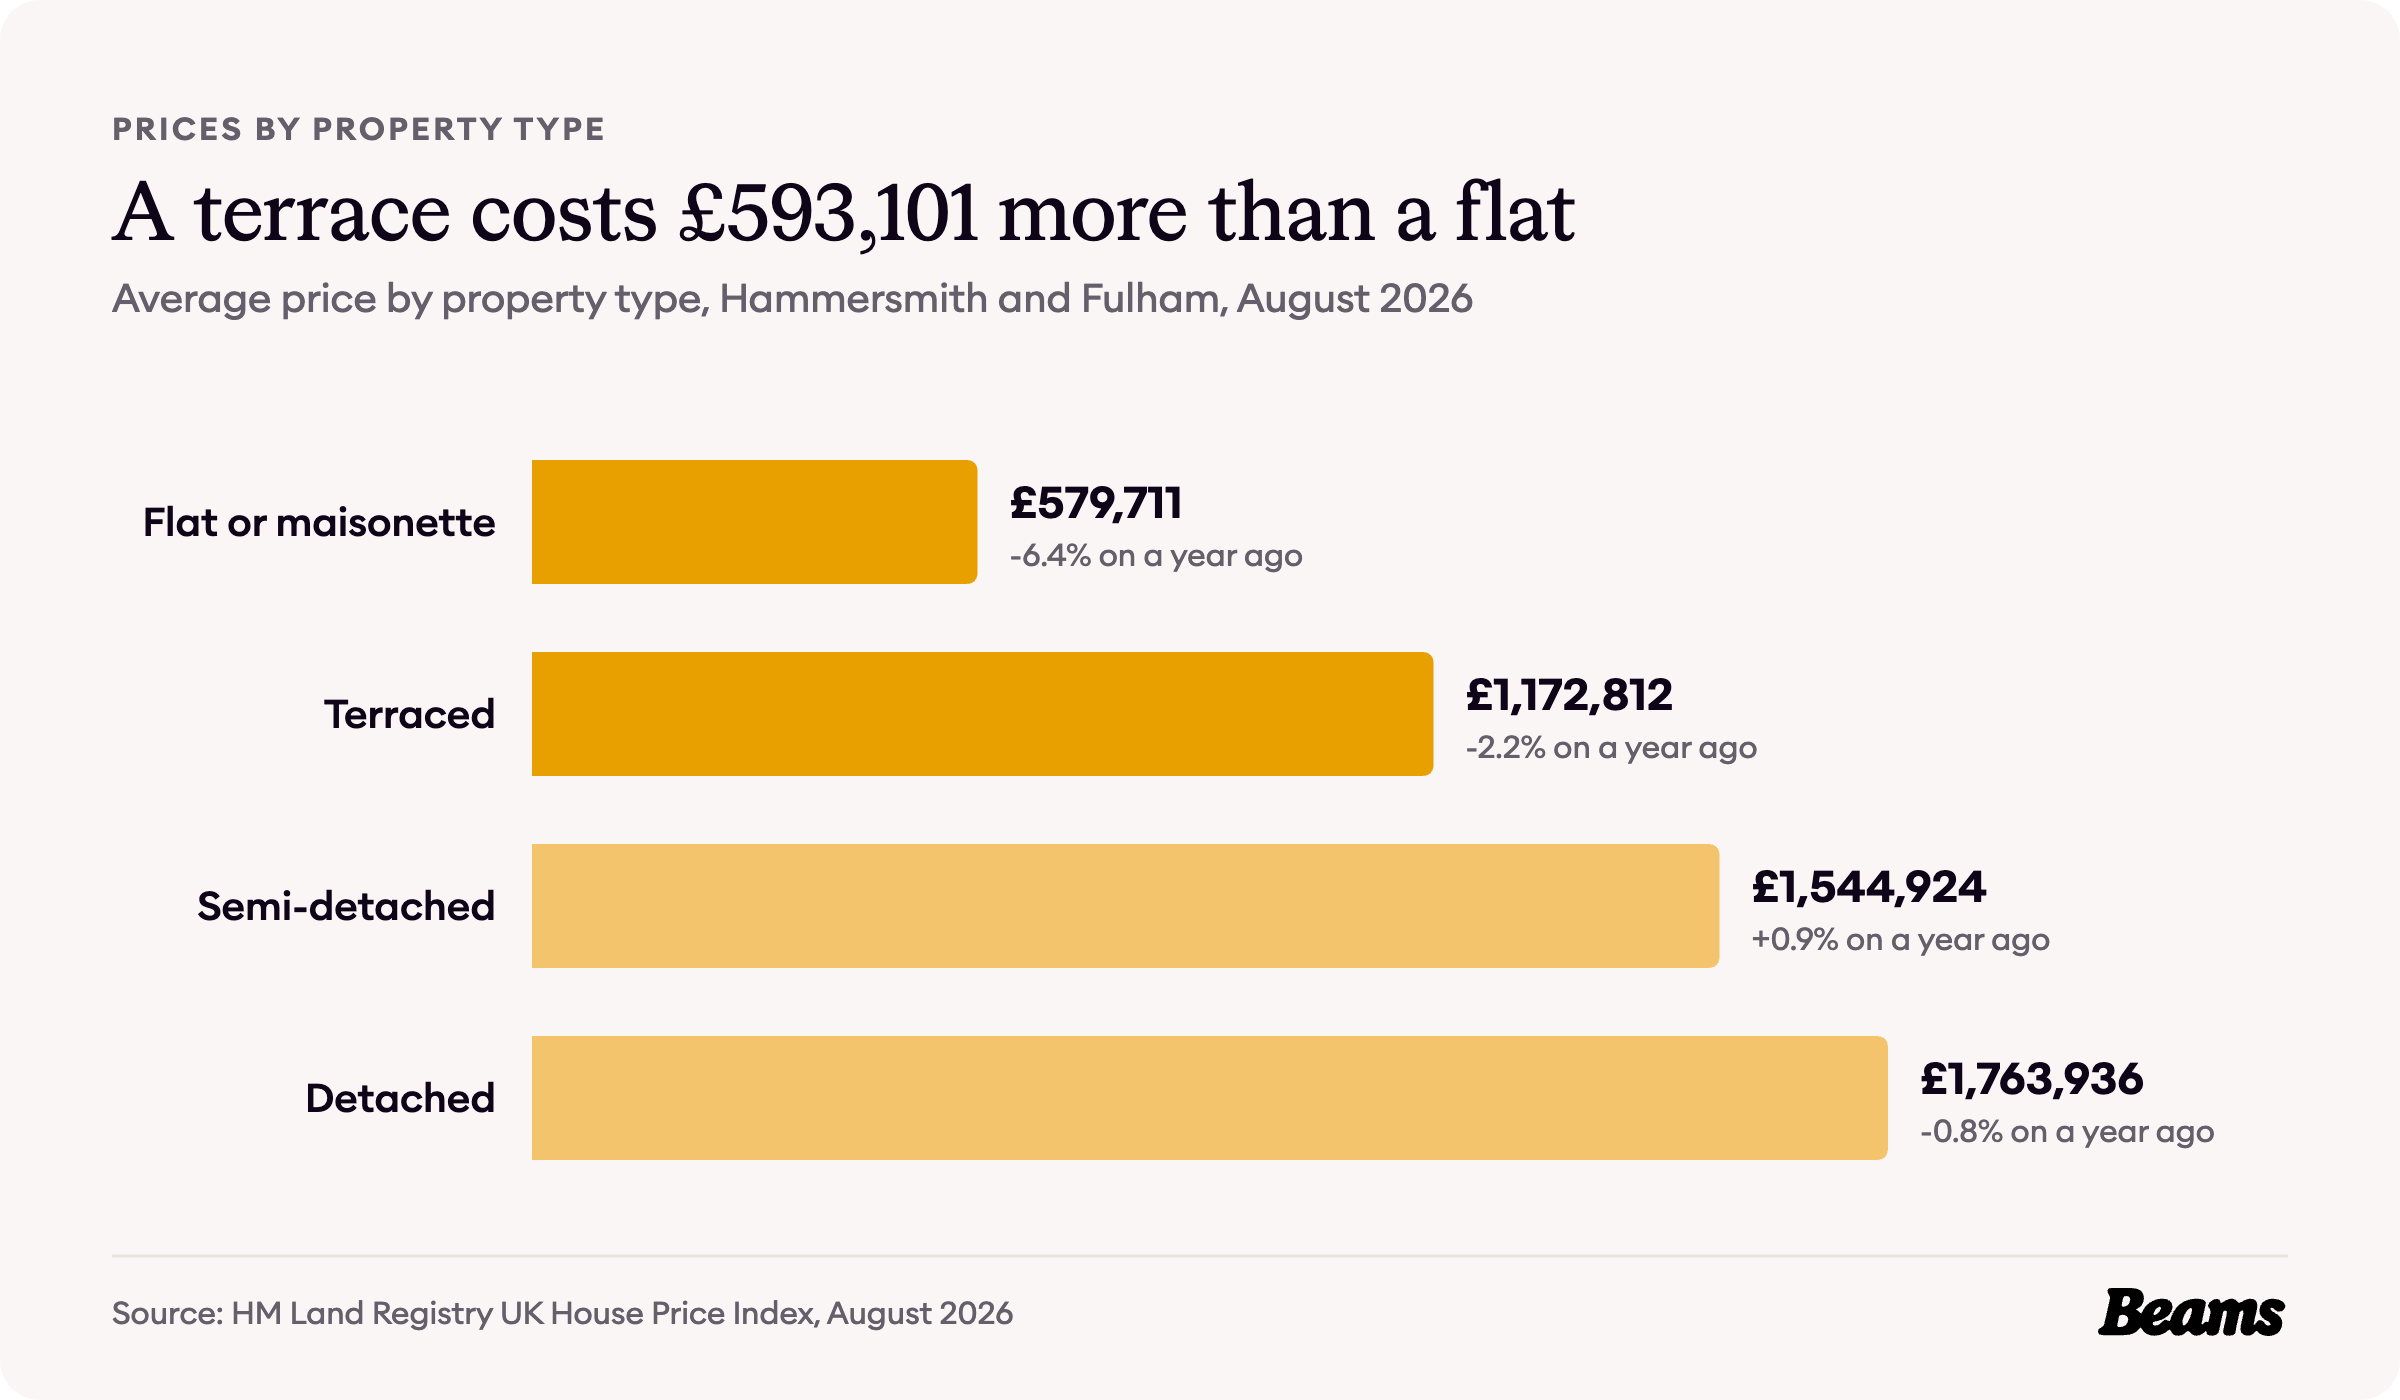
Across the borough, a flat or maisonette averaged £579,711 in August 2026, down 6.4% on a year earlier, and a terraced house £1,172,812, a gap of £593,101 [5]. Semi-detached homes averaged £1,544,924 and detached homes £1,763,936.
That gap is the number most owners weigh up before they move. For a family already in a terrace, a house extension in Hammersmith adds room without paying for the next rung of the ladder. First-time buyers paid an average of £643,534 in August 2026, while owners moving home paid £929,765 [5].
What homes sold for in W6
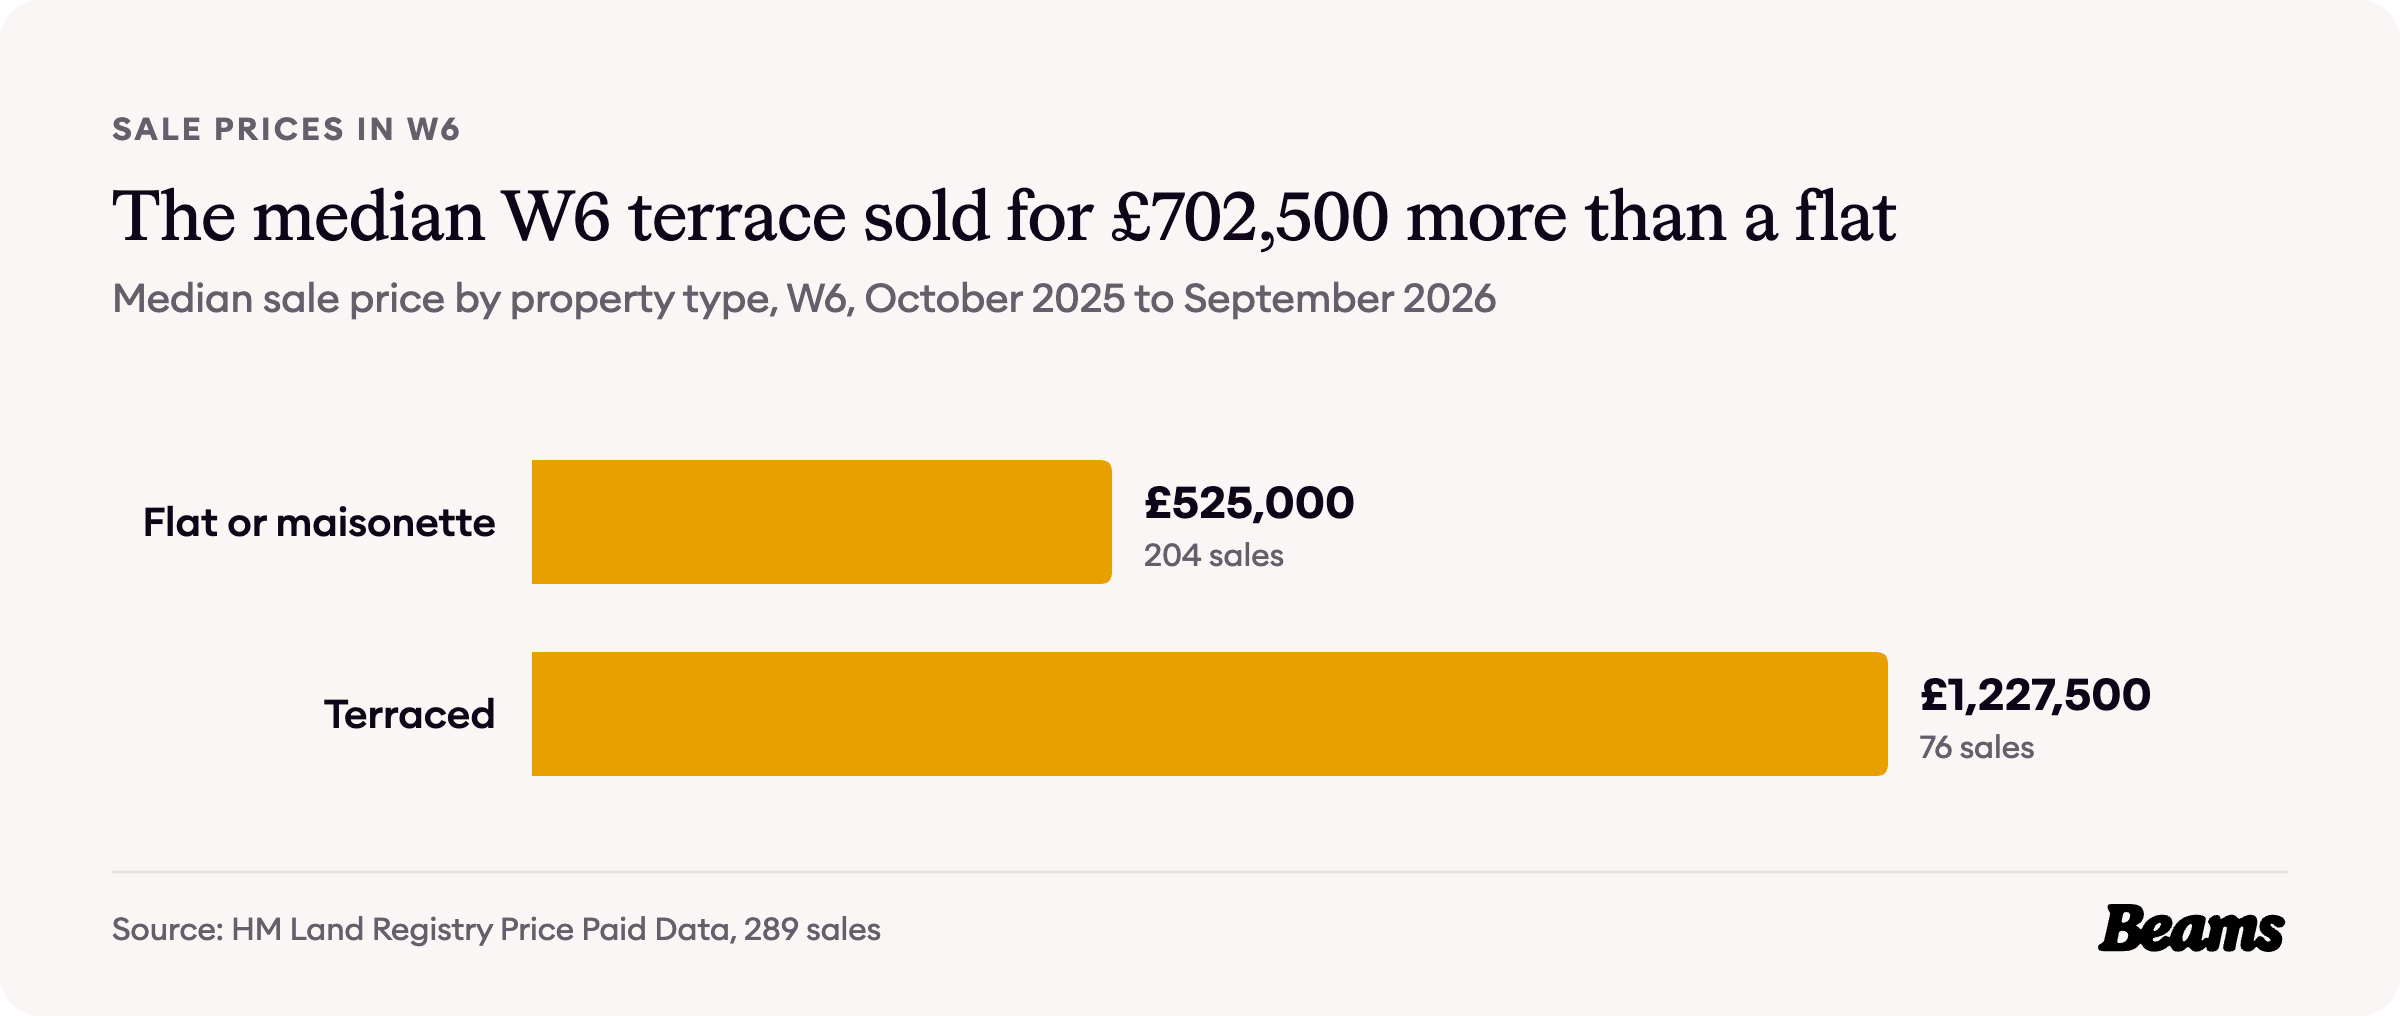
Land Registry recorded 289 sales in the W6 postcode district between October 2025 and September 2026, at a median price of £675,000 [7].
Flats made up 204 of those sales, at a median of £525,000. The 76 terraced houses sold for a median of £1,227,500, so the gap between a flat and a terrace in W6 is £702,500 [7].
What it costs to rent
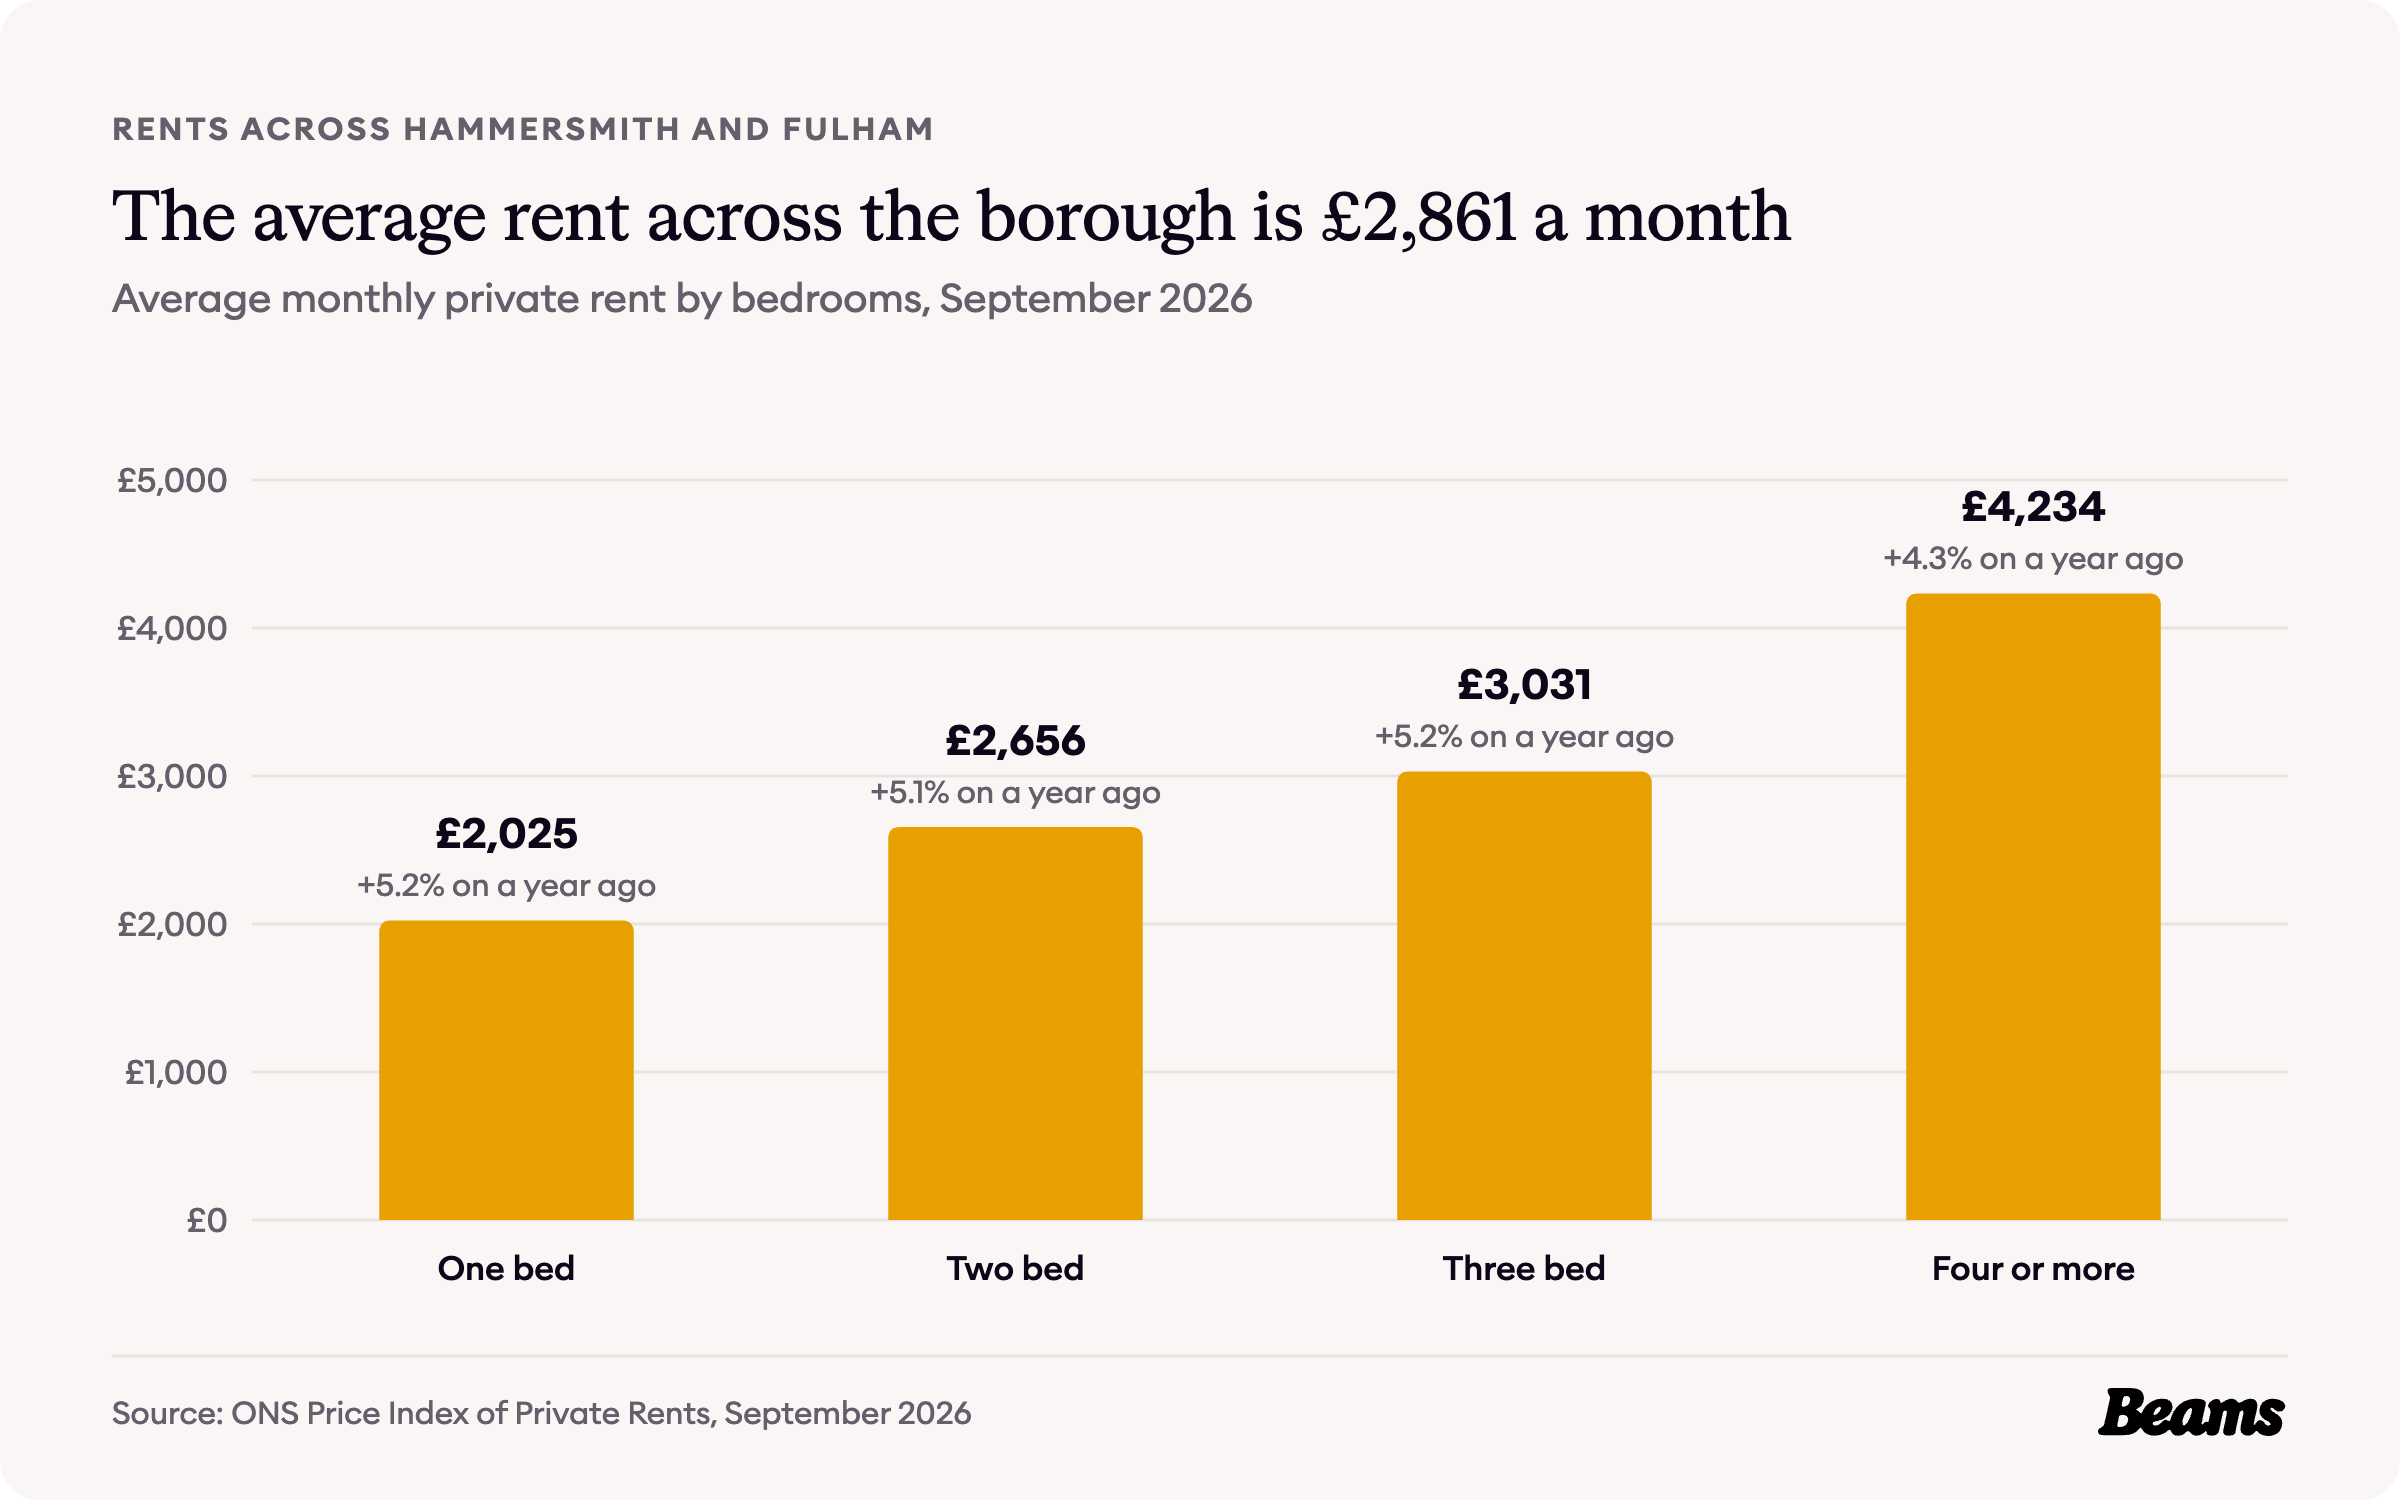
The average private rent in Hammersmith and Fulham was £2,861 a month in September 2026, up 4.9% on a year earlier [5]. A one-bedroom home averaged £2,025 a month, a two-bedroom home £2,656 and a home with four or more bedrooms £4,234.
With 38.5% of Hammersmith households renting privately and rents at these levels, landlords have every reason to keep homes in good order, and a tired bathroom is often the first thing a bathroom renovation in Hammersmith puts right before the next let.
Council Tax bands
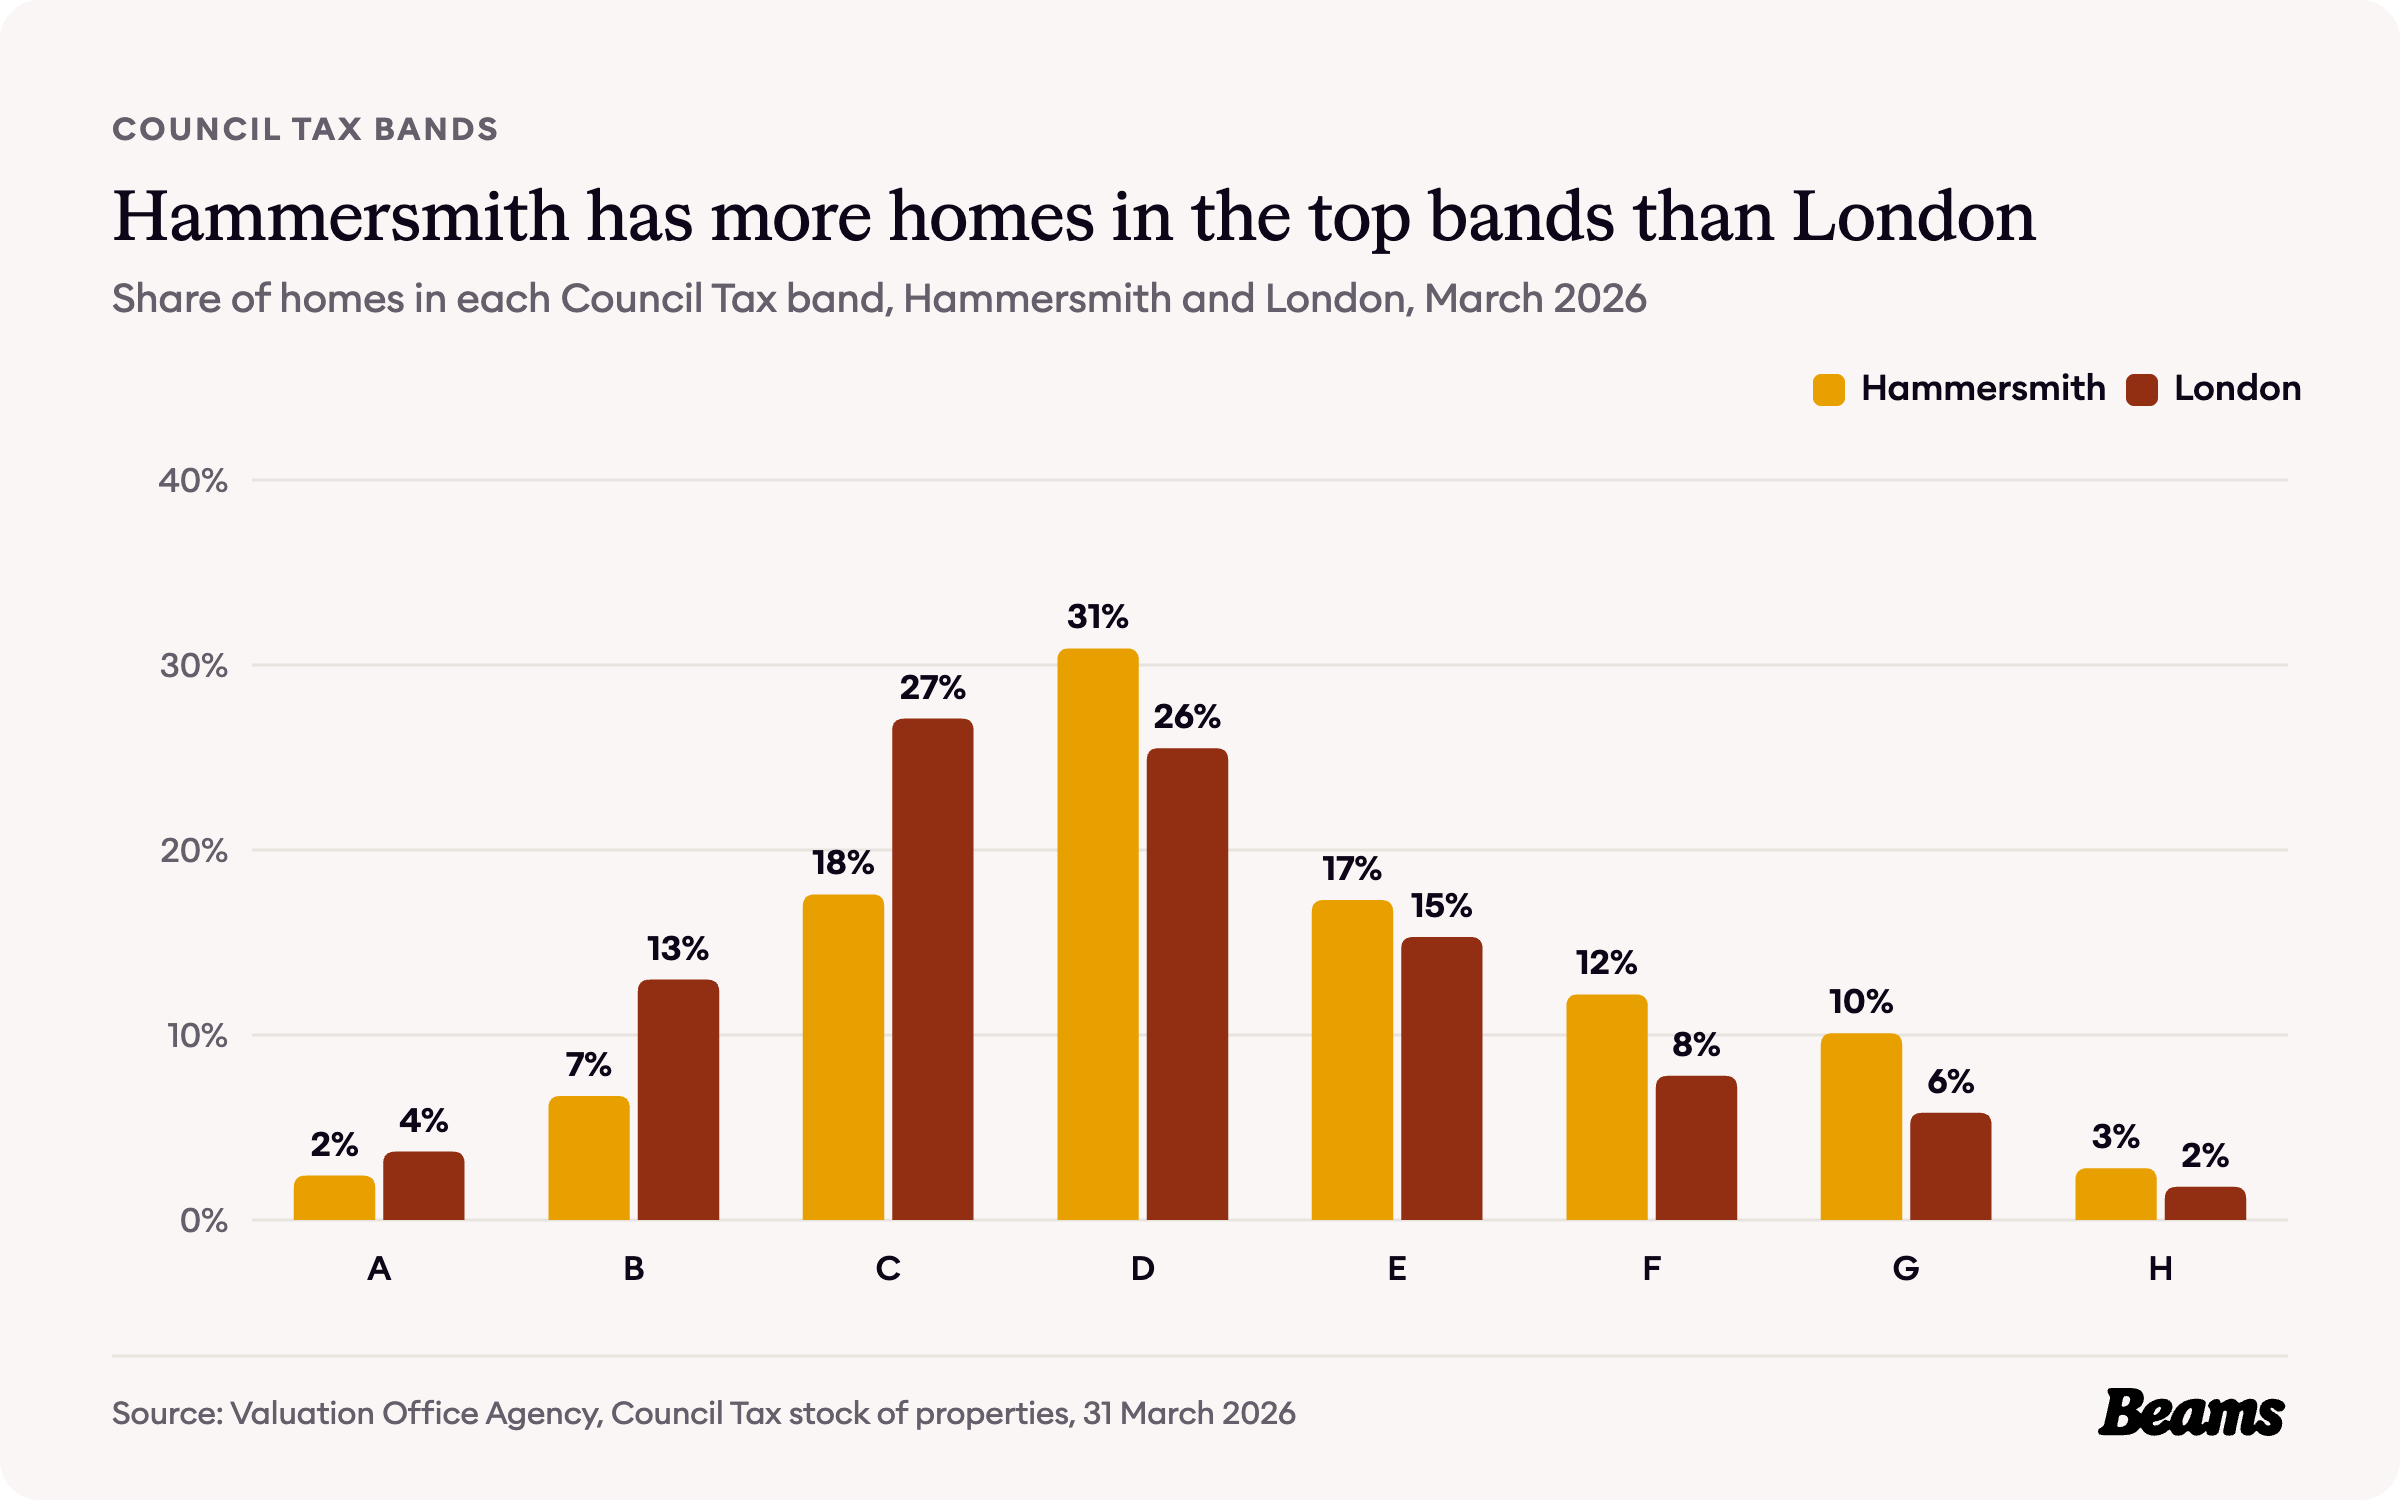
Band D is the most common Council Tax band in Hammersmith, covering 30.9% of homes against 25.5% across London [2].
The spread leans towards the top. 42.4% of homes sit in bands E to H, compared with 30.7% for London, while just 9.1% are in bands A and B, against 16.7% [2].
The rules on your street
Hammersmith and Fulham has 44 conservation areas, covering about half of the borough [8]. The council's list includes Brook Green, Barons Court, Hammersmith Broadway, Hammersmith Grove, Hammersmith Town Hall and Ravenscourt and Starch Green, which was designated on 20 February 1974 [8] [1].
Inside a conservation area some permitted development rights are restricted, so work that would not normally need planning permission may need it, and significant demolition needs planning permission too [8]. Since April 2018 an Article 4 Direction across the whole borough has also removed the permitted development right to dig a basement, so planning permission is needed for any basement excavation [9]. Any basement conversion in Hammersmith that digs down starts with a planning application.
The council says householder applications usually take six to eight weeks to decide once they are validated, if there are no complications [10]. With more than half of Hammersmith built before 1900, it pays to check your street before anyone starts drawing. Our builders in Hammersmith and planners check what applies to your address before any work begins.
Hammersmith housing statistics at a glance
- Average house price, Hammersmith and Fulham, August 2026: £754,825 (London £554,430) [5] [6]
- Change on a year earlier: -5.1% (London -2.2%) [5] [6]
- Median sale price, W6, October 2025 to September 2026: £675,000 [7]
- Average flat or maisonette: £579,711 (London £427,310) [5] [6]
- Average terraced house: £1,172,812 (London £648,650) [5] [6]
- Average private rent, September 2026: £2,861 a month [5]
- Homes built before 1900: 56.6% (London 20.8%) [2]
- Households living in a flat: 80.3% (London 54.0%) [3]
- Households who own their home: 31.5% (London 45.2%) [4]
- Conservation areas in the borough: 44 [8]
Frequently asked questions
References
- Hammersmith and Fulham Council, Ravenscourt and Starch Green Conservation Area character profile. History of the area and the date of designation, published December 1999.
- Valuation Office Agency, Council Tax: stock of properties 2026. Properties by build period and by Council Tax band at 31 March 2026, Hammersmith census areas and London.
- ONS, Census 2021 table TS044: Accommodation type. Households by type of home, Hammersmith census areas and London.
- ONS, Census 2021 table TS054: Tenure. Households by tenure, Hammersmith census areas and London.
- ONS, Housing prices in Hammersmith and Fulham. UK House Price Index for August 2026 and Price Index of Private Rents for September 2026, published 21 October 2026.
- HM Land Registry, UK House Price Index. Average prices for Hammersmith and Fulham, London and England, August 2006 to August 2026.
- HM Land Registry, Price Paid Data. Sales in the W6 postcode district, October 2025 to September 2026.
- Hammersmith and Fulham Council, Conservation areas. Number of conservation areas, list of areas and conservation area controls. Accessed 29 October 2026.
- Hammersmith and Fulham Council, Urban design and conservation. Article 4 Directions in place across the borough since April 2018. Accessed 29 October 2026.
- Hammersmith and Fulham Council, After a decision is made. How long householder applications take to decide. Accessed 29 October 2026.
Thinking of improving rather than moving?
Tell us about your Hammersmith home and what you want to change. We'll give you a free estimate, then up to three vetted builders quote against the same specification.