
Fulham housing statistics 2026
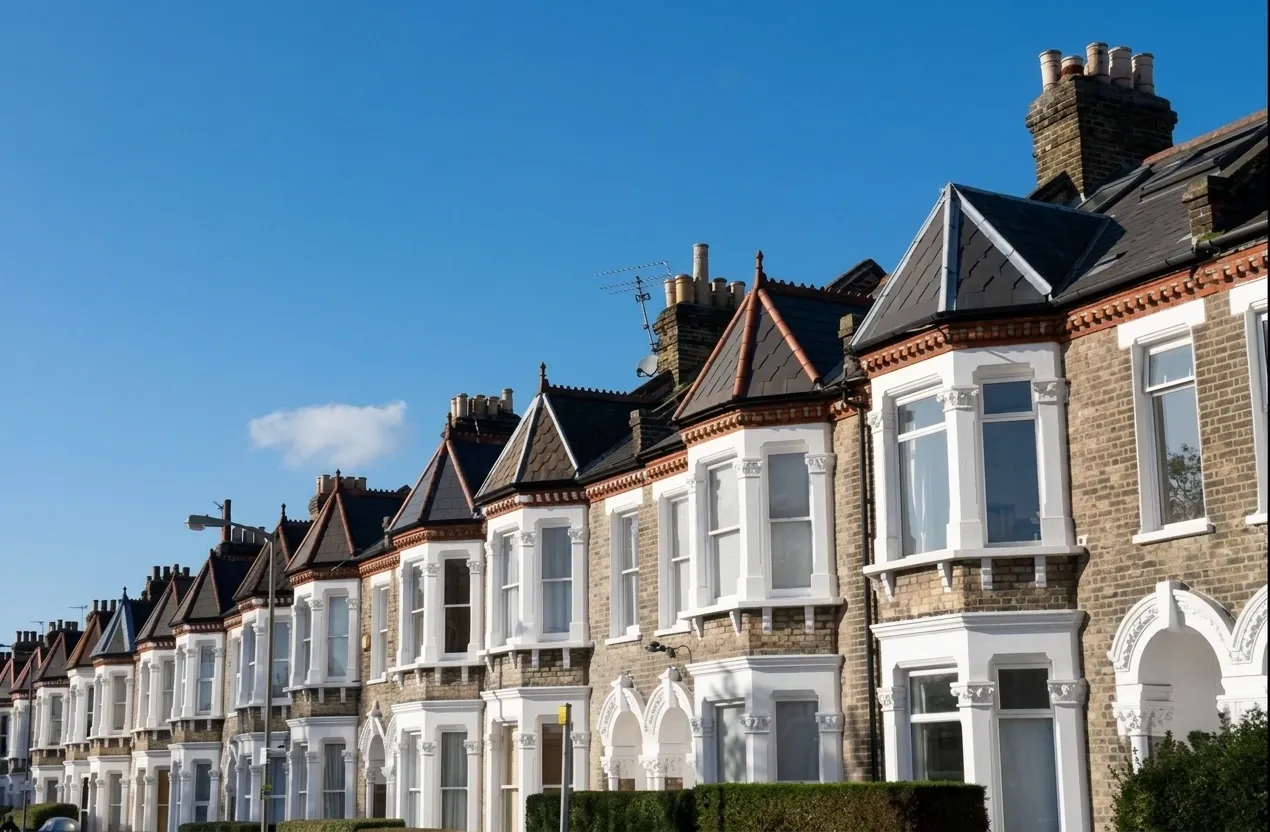
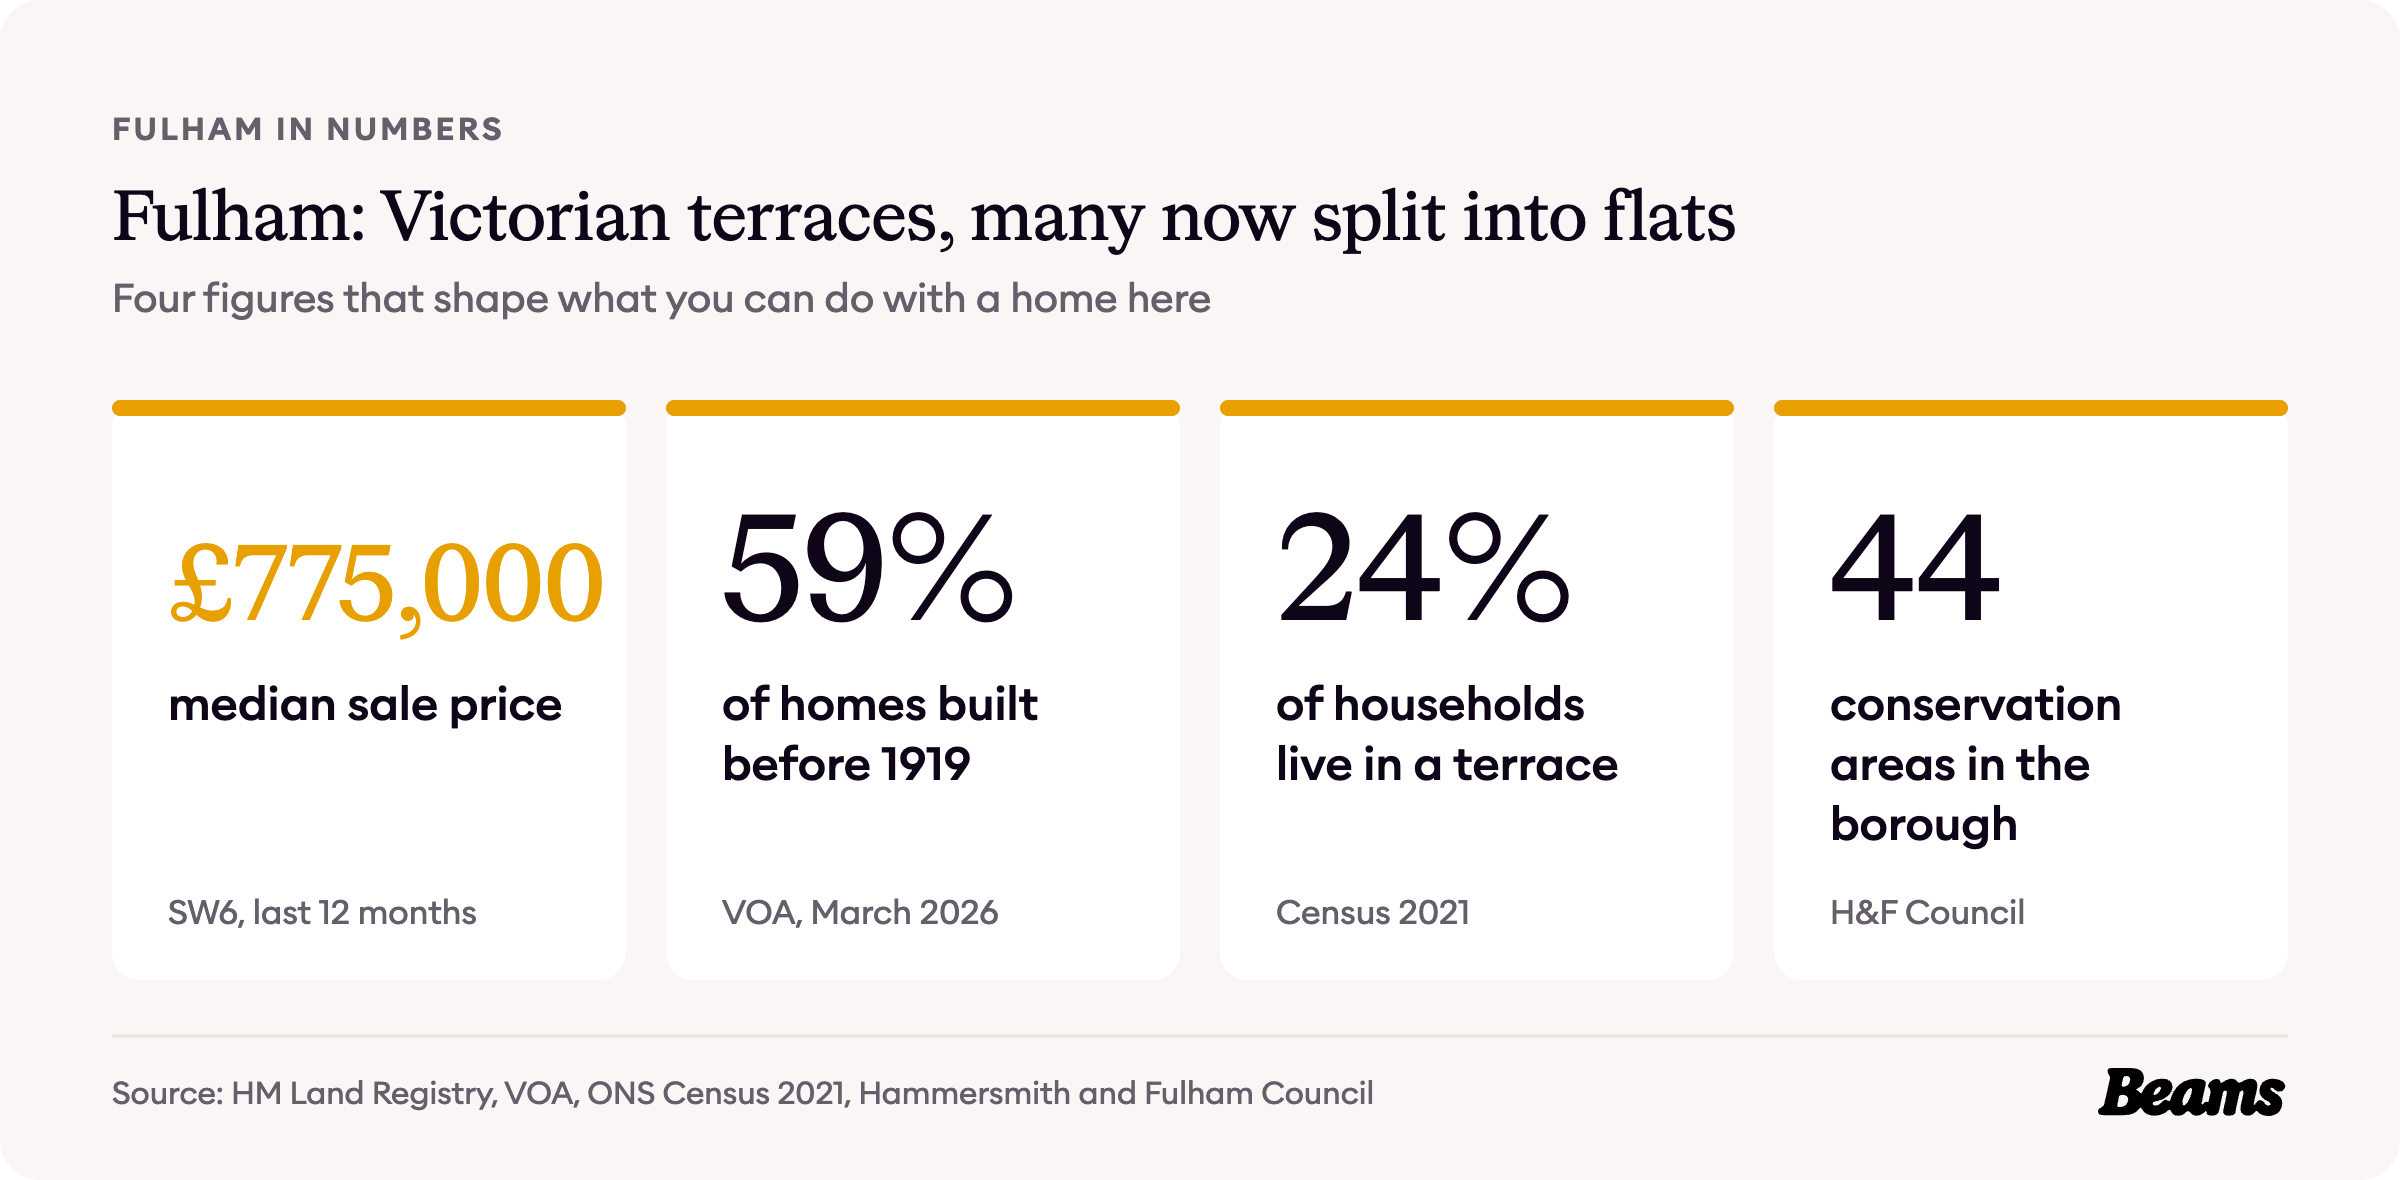
In 1813 Fulham was described as the great kitchen garden north of the Thames. Within a century its fields had become streets of terraces, and those terraces, many now split into flats, still shape how Fulham lives. These are the numbers behind that story, from the first estate at Moore Park to the £775,000 median sale price in SW6 today.
Each figure below comes from an official source and carries its date, so you know what you are working with before you plan a home renovation in Fulham. The sources are numbered in brackets and listed in full at the end of the page.
How Fulham was built
For centuries this was farmland. In 1813 Thomas Faulkner, in the first general history of Fulham, described it as the great kitchen garden north of the Thames for supplying London, and maps from 1745 and 1853 show fields, market gardens and pasture behind the building plots on what is now Fulham Road [1].
The building came in the second half of the 19th century. Moore Park, laid out in the 1850s and completed in the following decade, was the earliest estate development in Fulham [2]. Around Barclay Road the fields had become a brickfield on the map of 1869 to 1874, and by 1896 the terraces were complete [1].
The Peterborough estate followed. The grounds of Peterborough House were sold in 1888 and 1890 and the house demolished, and the Irish builder James Nichols put up terraces of "better than average style" on wide streets with larger than average front gardens. Street after street went up between 1888 and 1904, from Peterborough Road and Coniger Road to Quarrendon Street and Chipstead Street [3].
Most of those houses have since grown. The council's profile of the area says most of its two and three storey terraces have been substantially extended with mansard attic floors and basement rooms, changes that have doubled the size of the original houses [3].
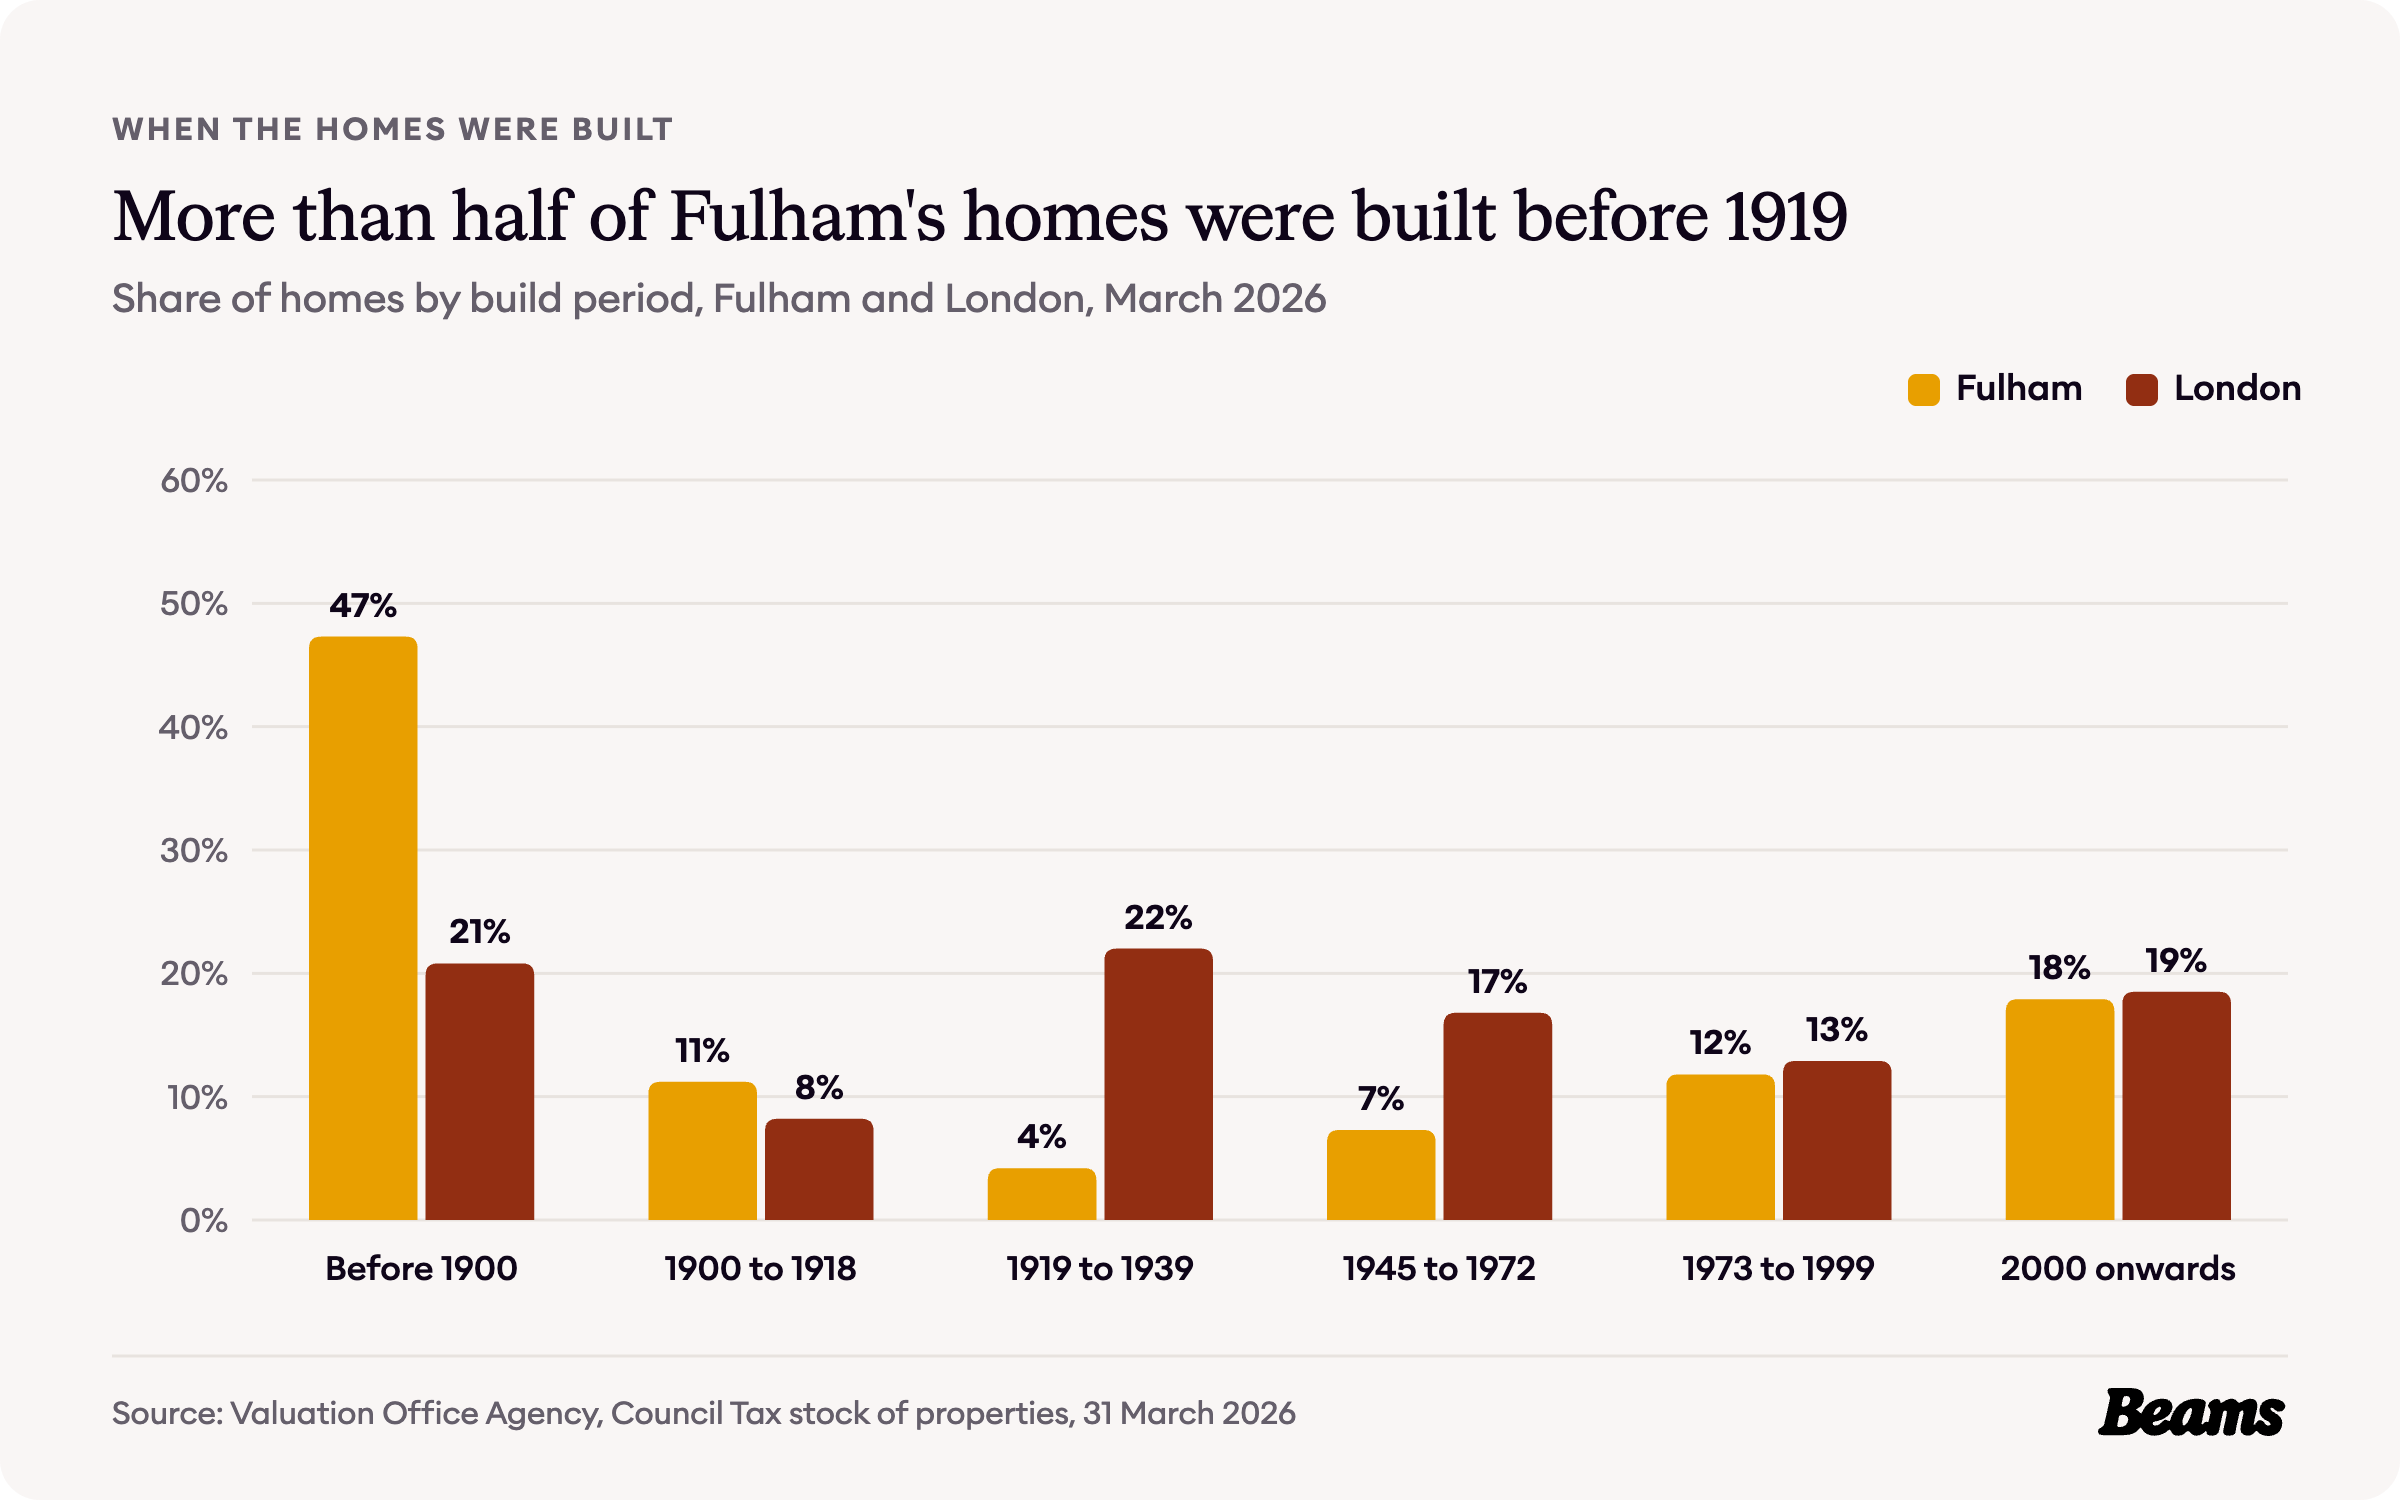
The Valuation Office Agency counts 47.3% of the 38,410 homes in Fulham's ten census areas as built before 1900 and another 11.2% between 1900 and 1918, against 20.8% and 8.2% across London. Hardly anything was added between the wars, 4.2% against London's 22.0%, but 17.9% of homes have been built since 2000, close to London's 18.5% [4].
With more than half of Fulham's homes built before 1919, and mansard attics already added to most terraces on the Peterborough estate, a loft conversion in Fulham is the natural way to add a bedroom here.
How Fulham households live
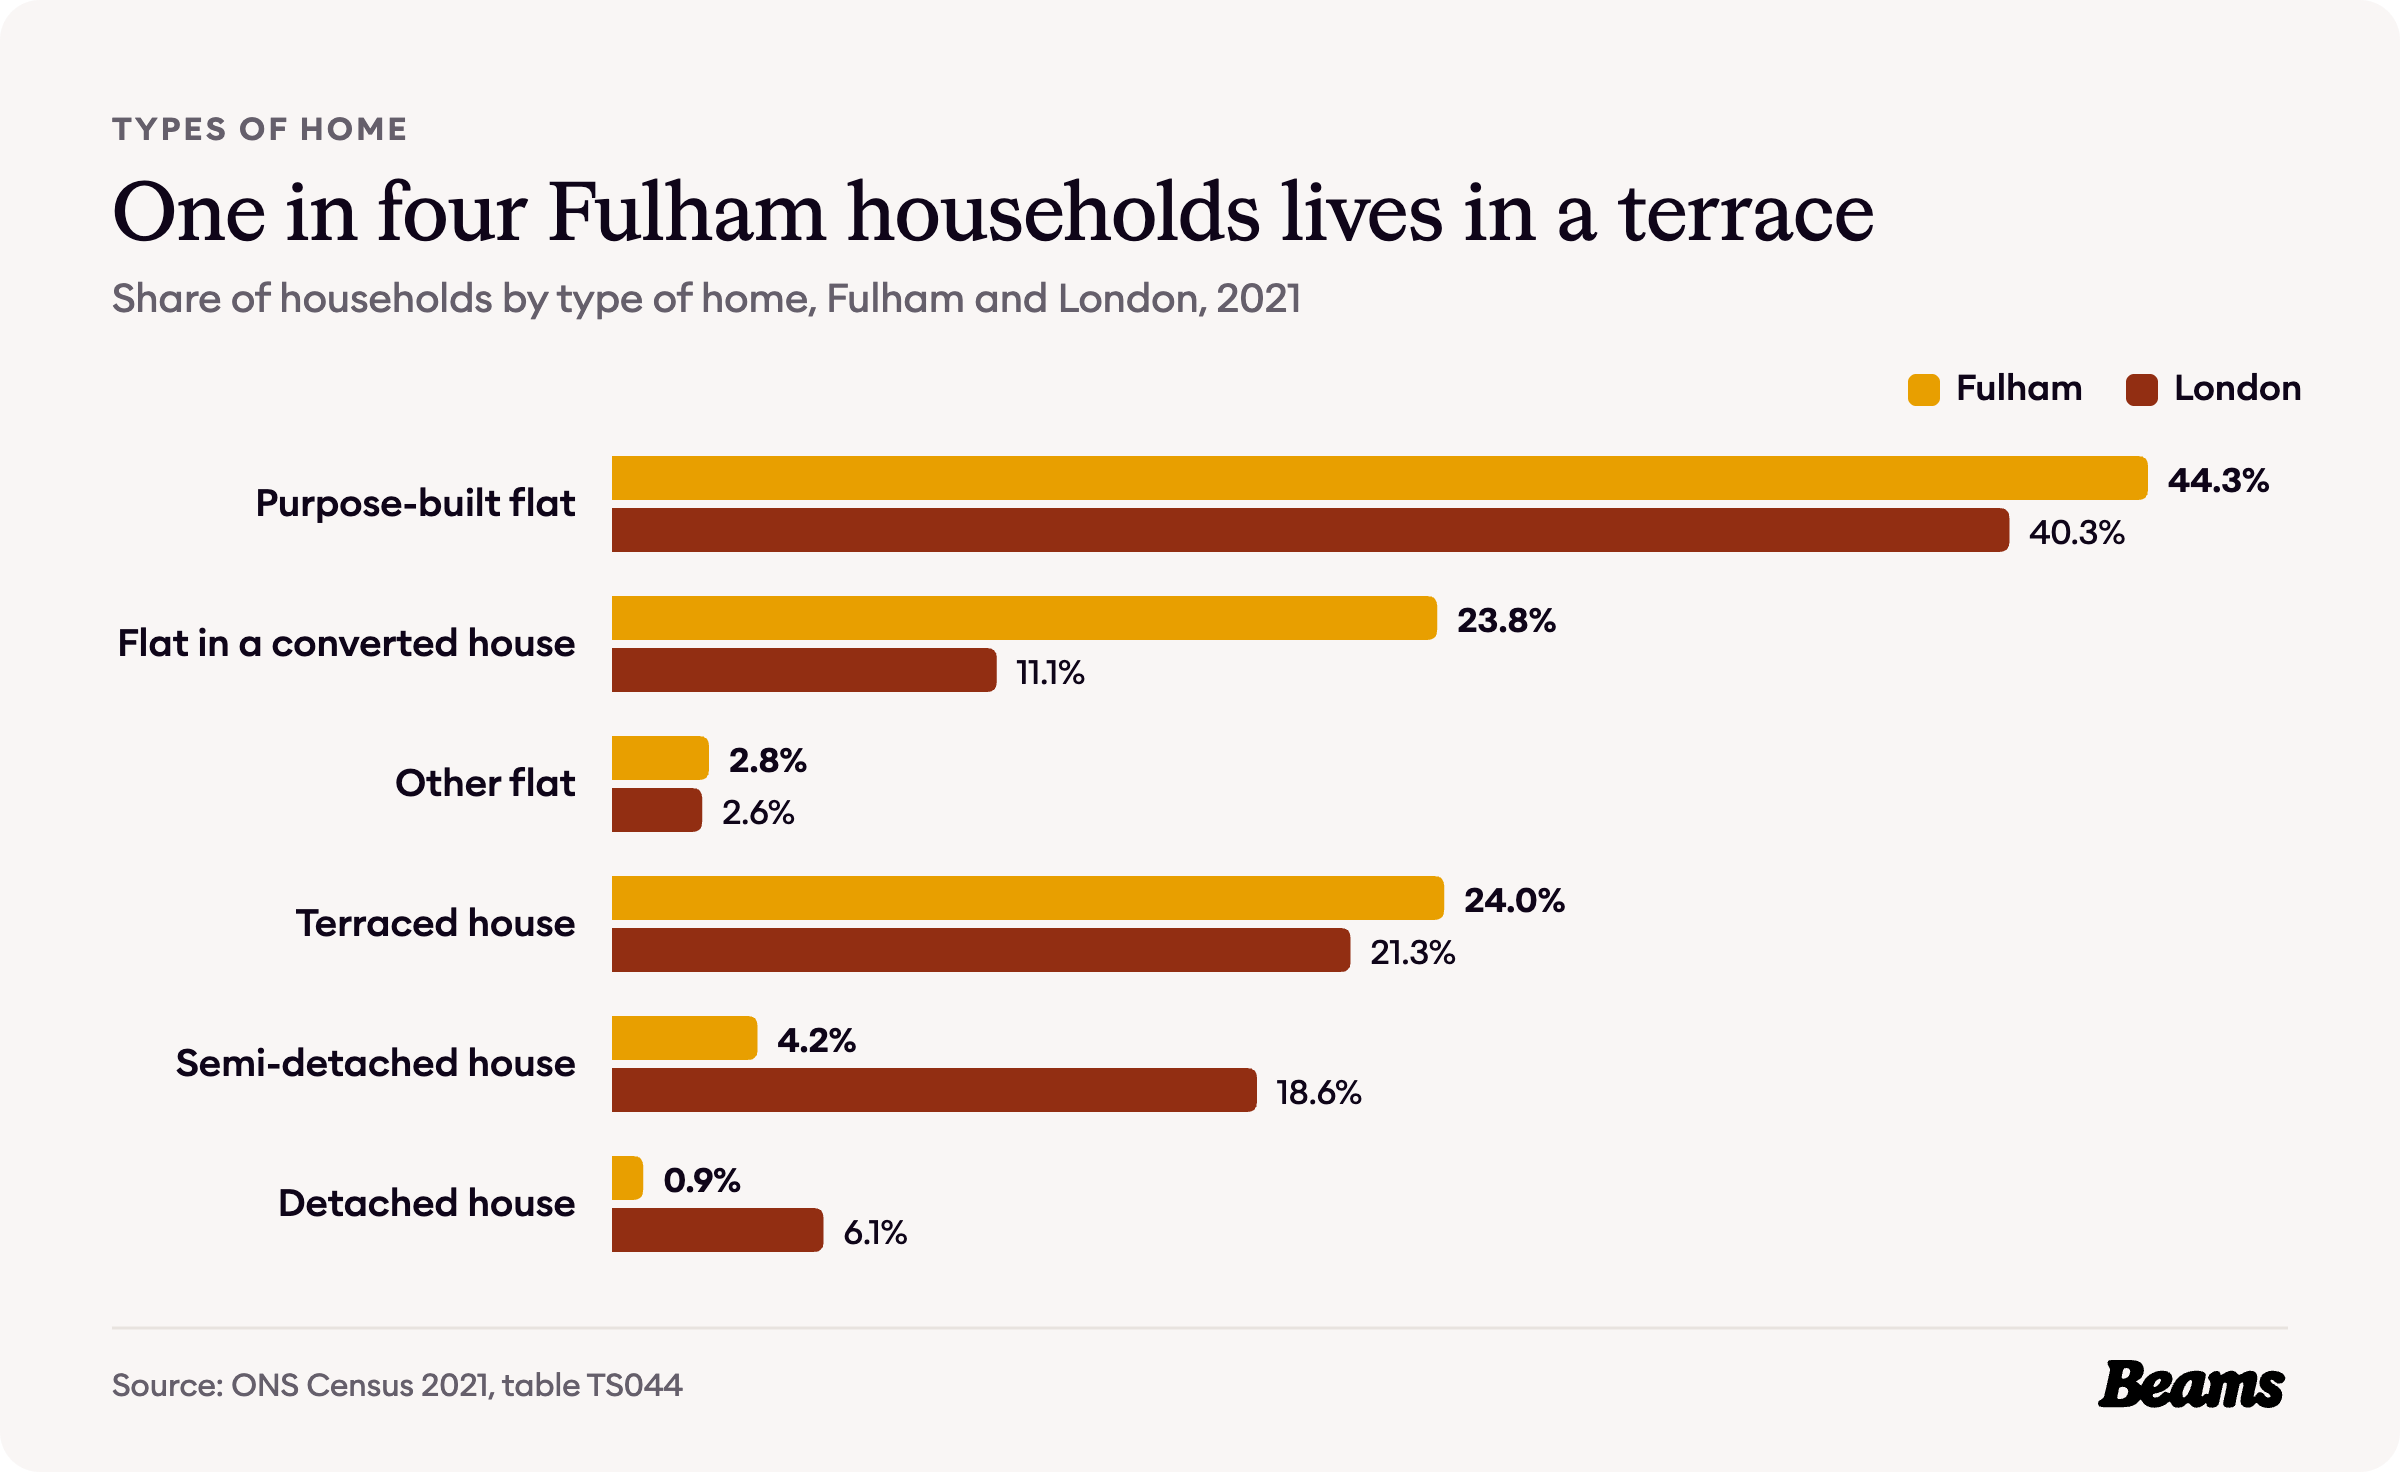
The 2021 Census counted 32,777 households in the ten Fulham areas. 44.3% live in a purpose-built flat and 23.8% in a flat inside a converted house, more than twice London's 11.1% [5].
Terraced houses are home to 24.0% of households, a little above London's 21.3%, while semi-detached and detached houses together account for only 5.1%, against 24.7% for London. In total 70.9% of Fulham households live in a flat, against 54.0% across London [5].
So Fulham is a place of terraces, many of them now divided into flats. A flat on one floor of a Victorian terrace has a narrow footprint, so a kitchen renovation in Fulham is often about layout as much as fittings.
Who owns Fulham's homes
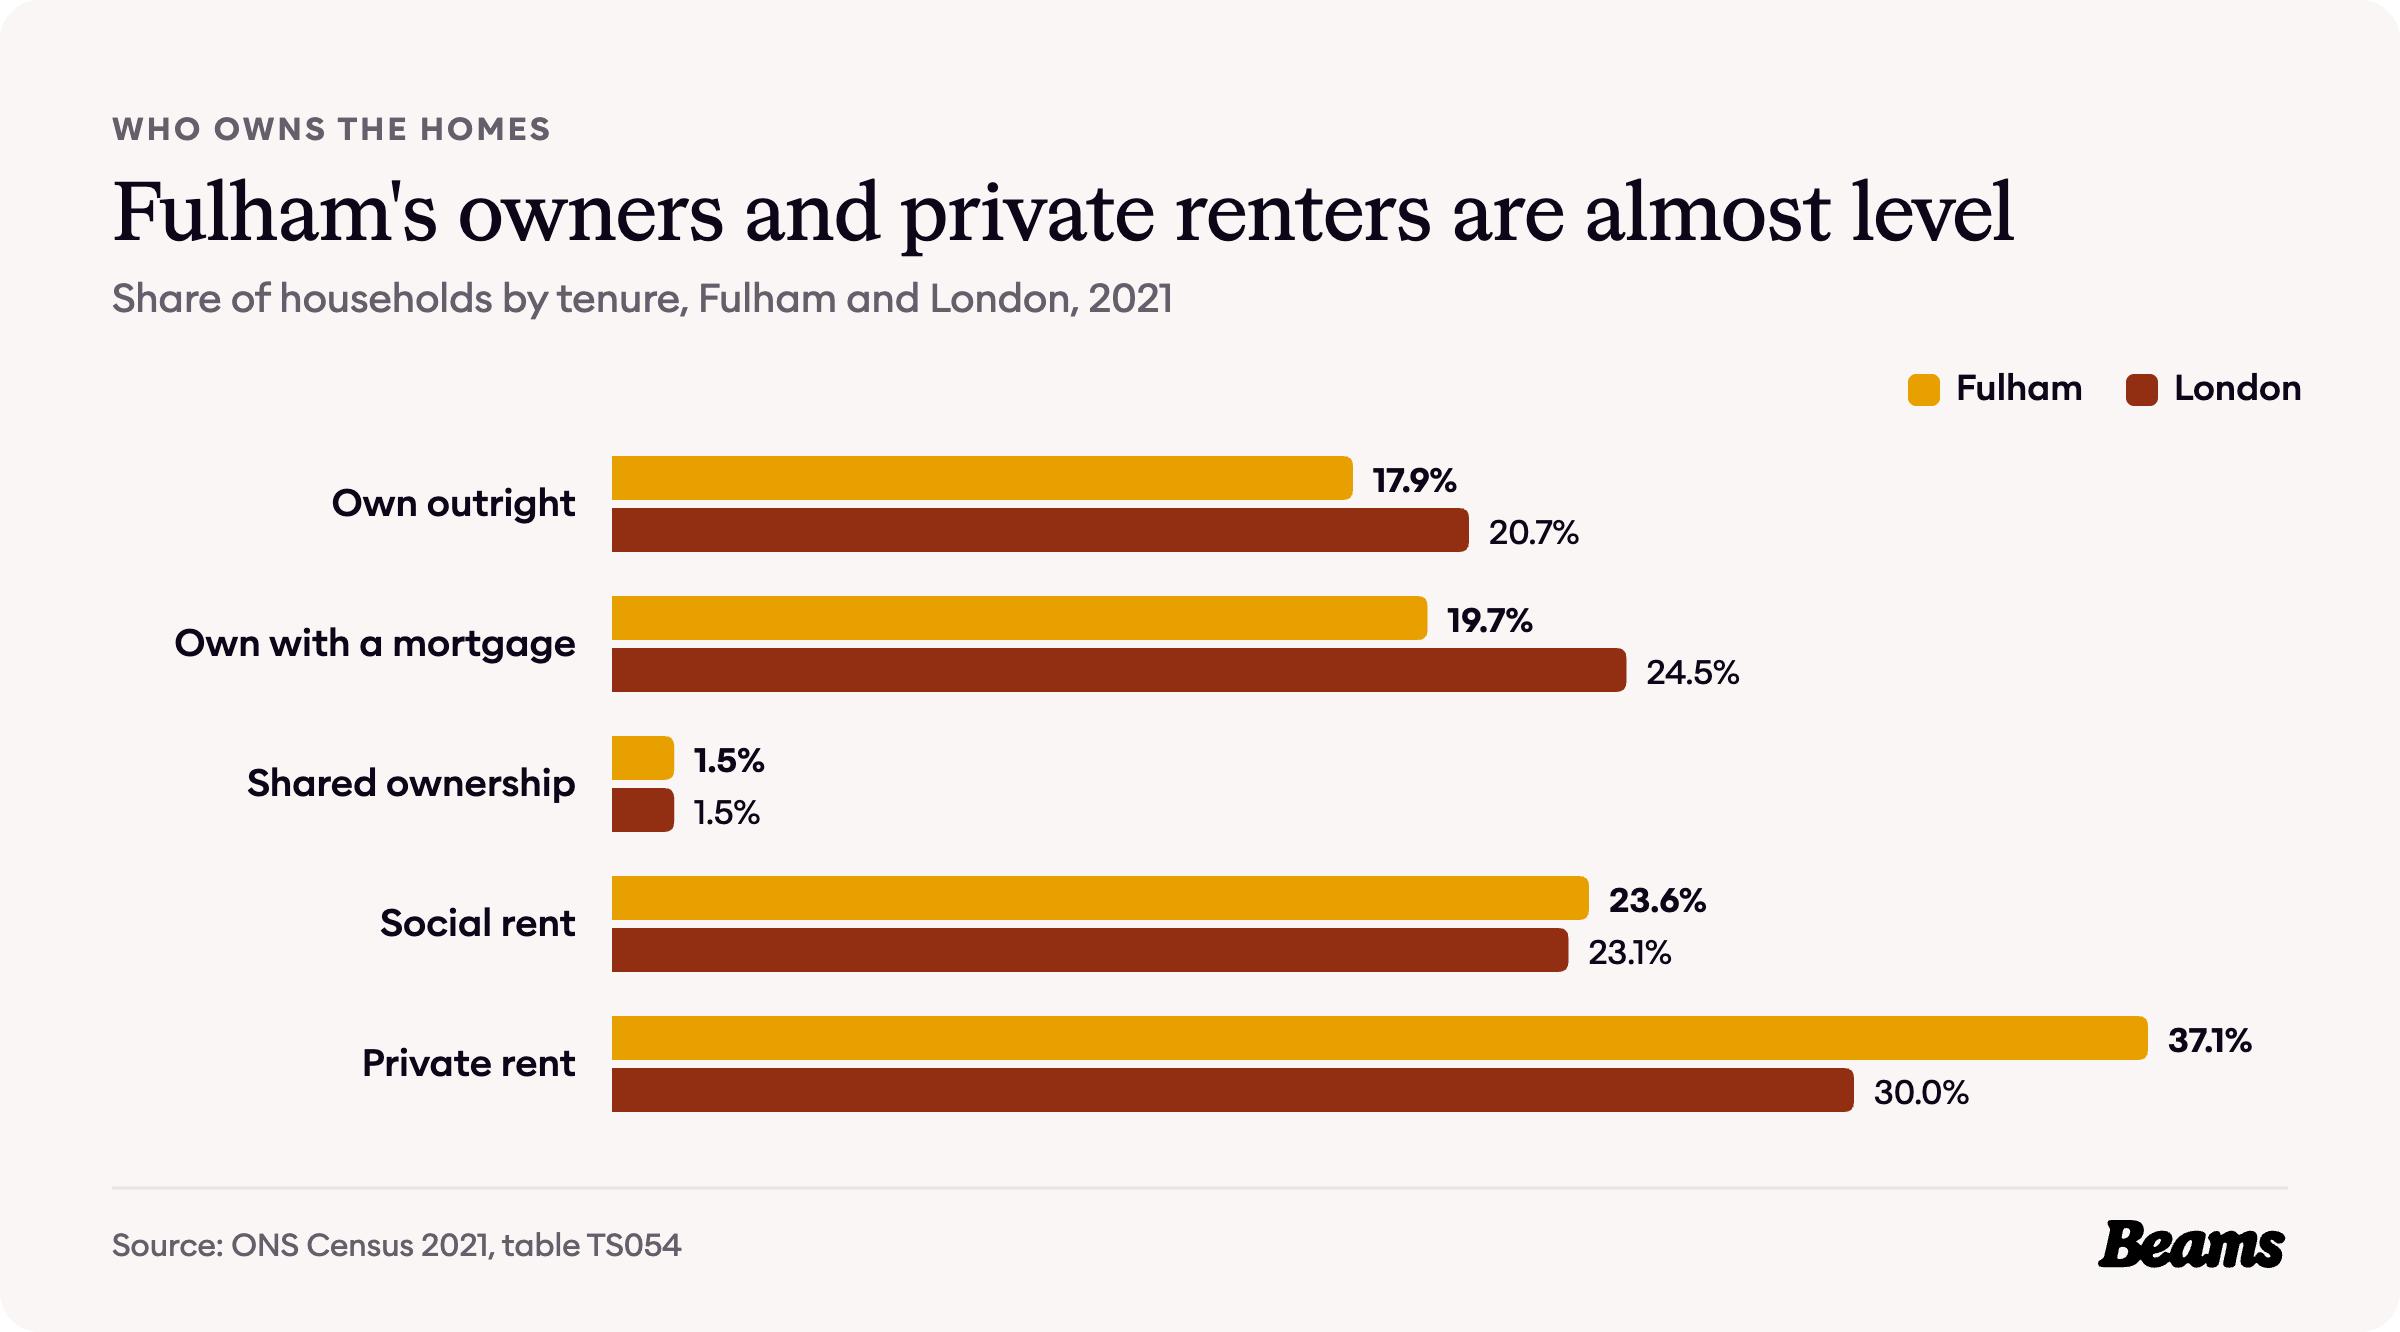
37.6% of Fulham households own their home, 17.9% outright and 19.7% with a mortgage, against 45.2% across London [6].
Private renting is the largest single tenure at 37.1%, against 30.0% for London, and social renting, at 23.6%, is almost exactly the London figure of 23.1%. Shared ownership covers 1.5%, the same as London [6].
What a Fulham home costs
The figures on this page cover three different areas, so it helps to know which is which. The UK House Price Index and the rent figures cover the whole London Borough of Hammersmith and Fulham. The census and Valuation Office figures cover the Lillie Road and Greyhound Road, Fulham Broadway, Fulham Reach, Fulham Aintree, Parsons Green East and Eel Brook Common, Parsons Green West, Munster, Sands End and Chelsea Harbour, Fulham Palace and Hurlingham Park, and South Park areas, and the sale prices cover the SW6 postcode district.
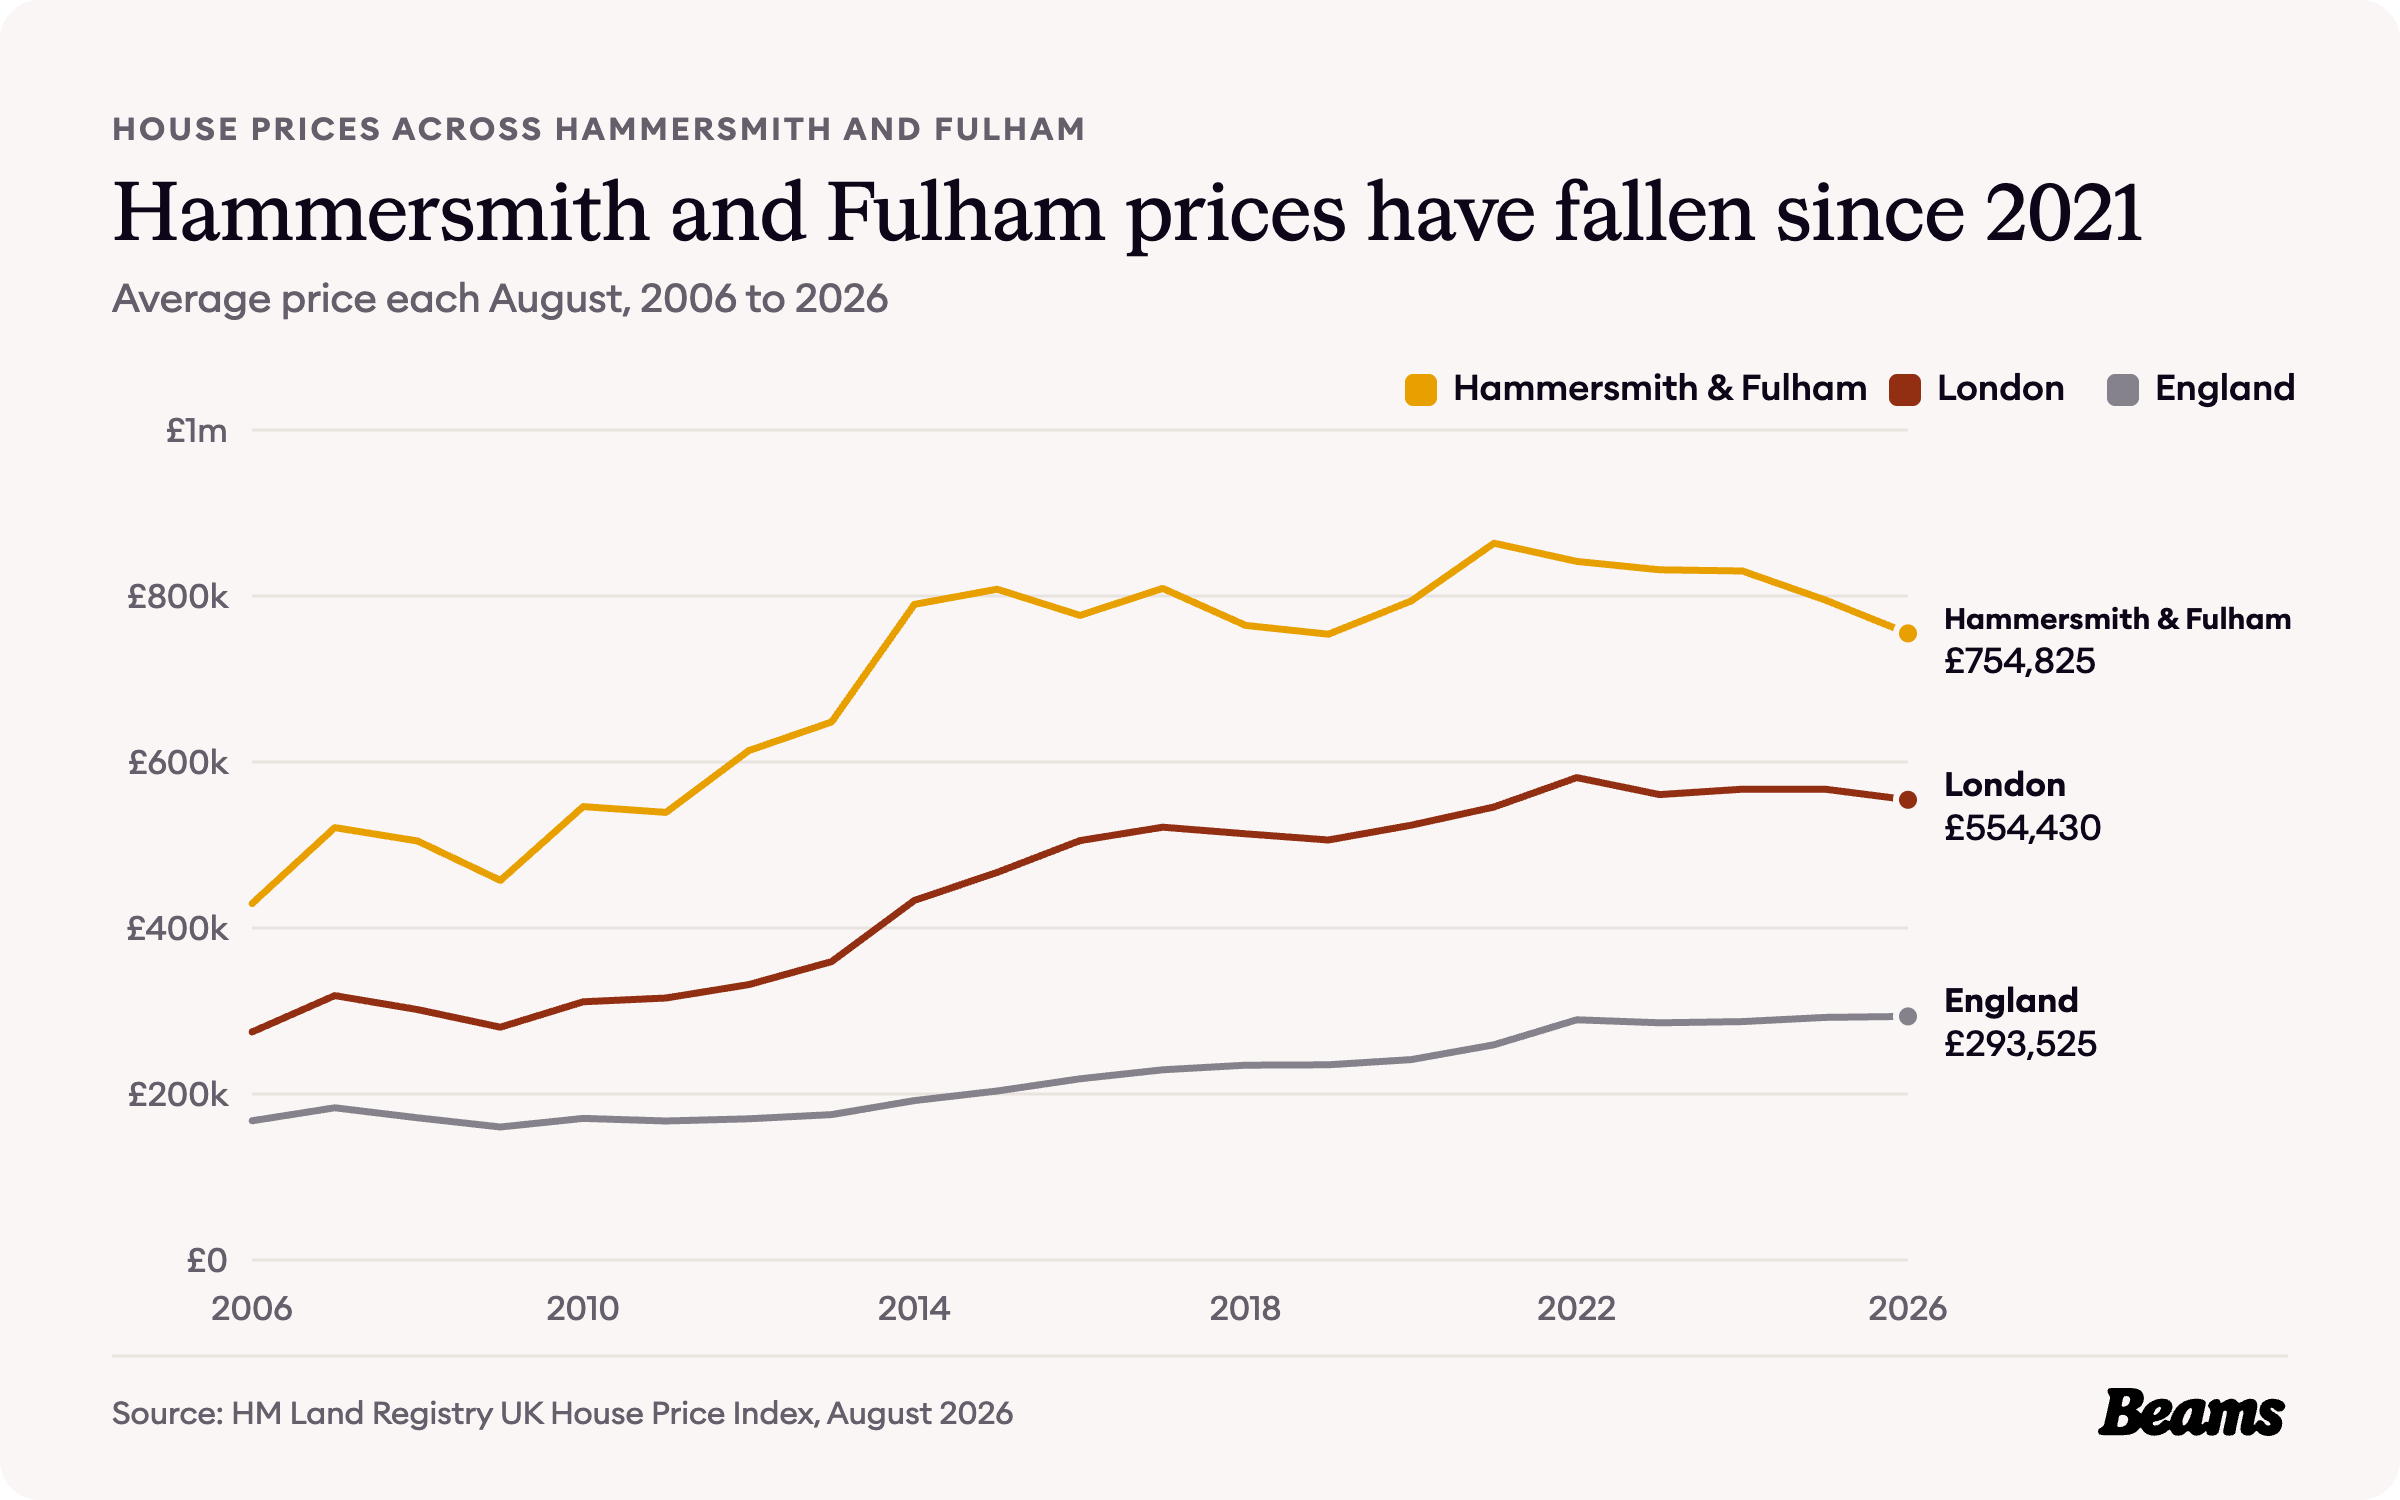
The average home in Hammersmith and Fulham cost £754,825 in August 2026, 5.1% less than a year earlier [7]. That is 36% above the London average of £554,430 and 2.6 times the England average of £293,525 [8].
In August 2006 the borough average was £429,297, against £274,815 for London. It peaked at £863,699 in August 2021 and has fallen every August since. This year's figure is the lowest since 2019, though still 1.8 times the 2006 level [8].
What it costs to move from a flat to a terrace
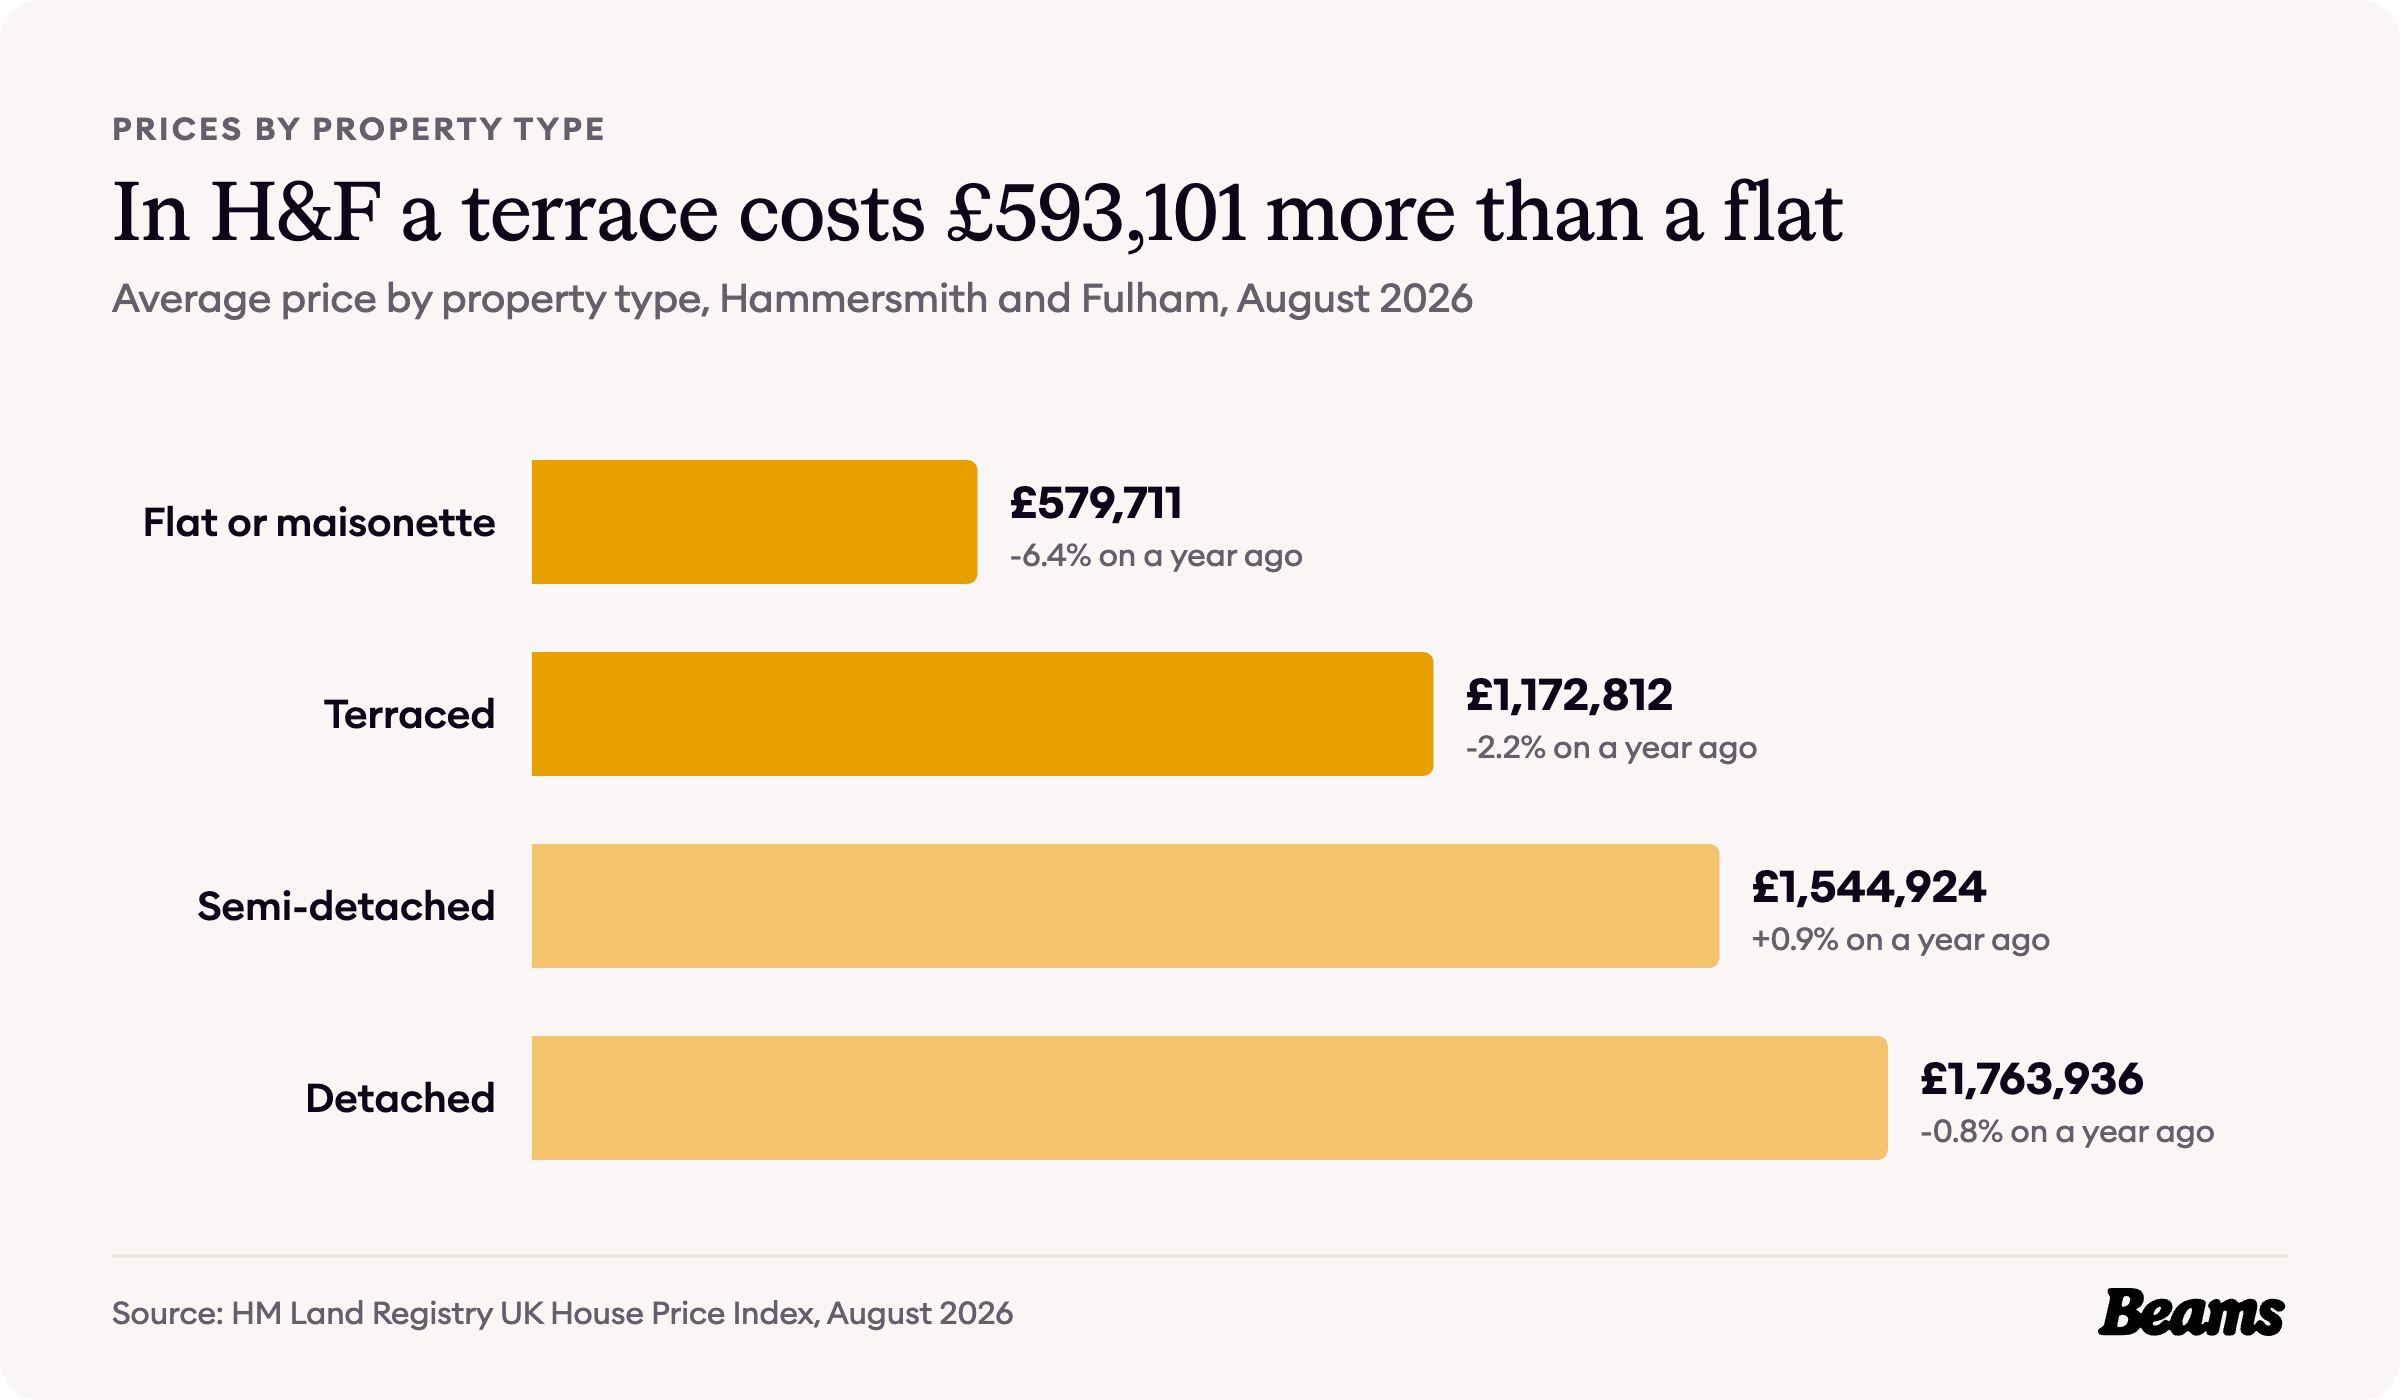
Across the borough a flat or maisonette averaged £579,711 in August 2026 and a terraced house £1,172,812, a gap of £593,101 [7]. Semi-detached homes averaged £1,544,924, up 0.9% on a year earlier, and detached homes £1,763,936. First-time buyers paid an average of £643,534 and owners moving home £929,765 [7].
That gap is the price of the step from a flat to a house. For a family already in a Fulham terrace, a house extension in Fulham, at the back or into the side return, adds room without paying for the next rung of the ladder.
What homes sell for in SW6
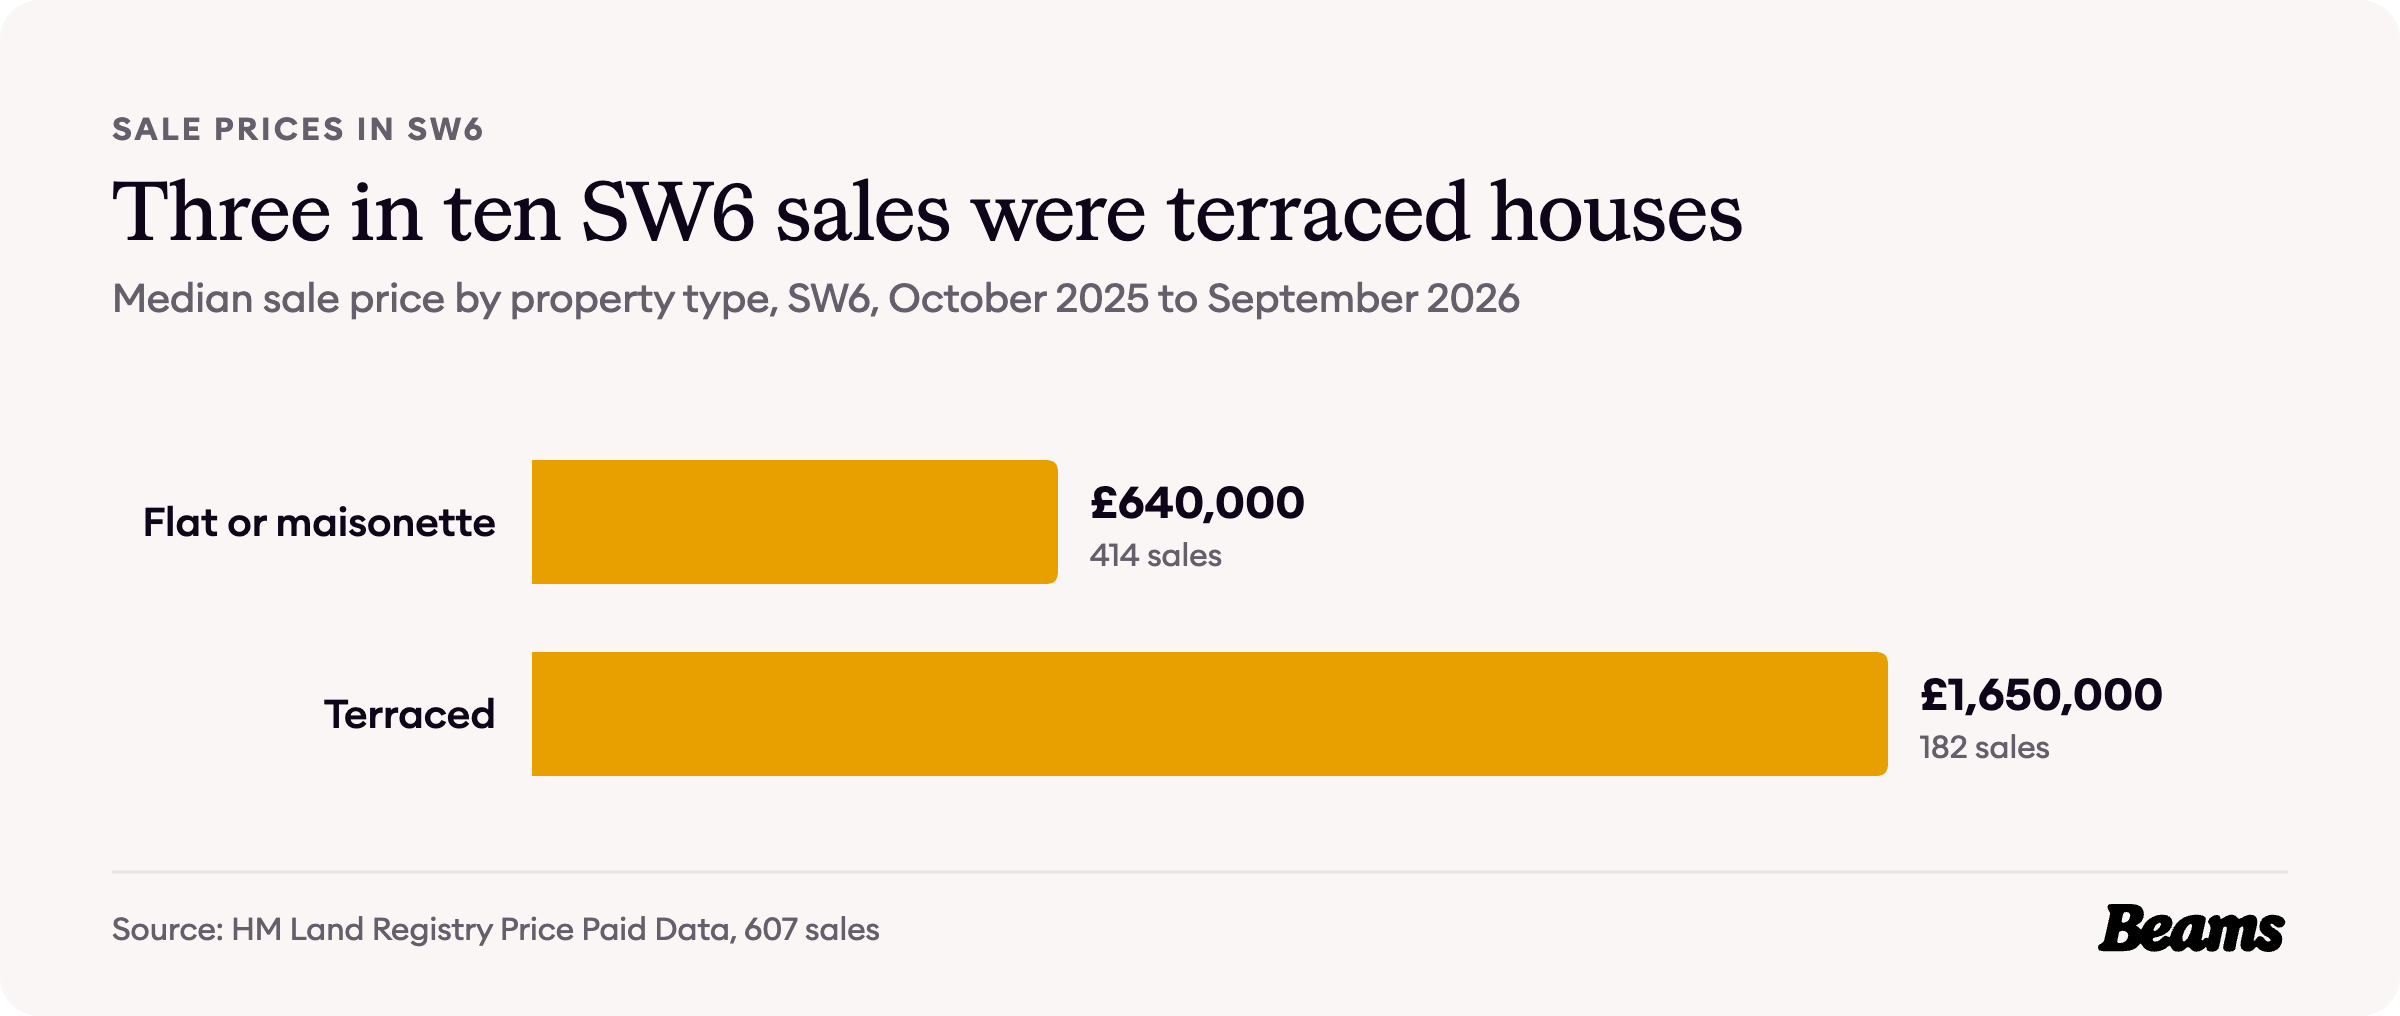
HM Land Registry records 607 sales in the SW6 postcode district between October 2025 and September 2026, at a median of £775,000 [9]. Flats made up 414 of them, at a median of £640,000, and terraced houses 182, three in ten, at a median of £1,650,000 [9].
A median is the middle sale in each group, so it is not directly comparable with the borough averages above. In SW6 the median terrace sold for 2.6 times the median flat, while across the borough the average terrace costs 2.0 times the average flat.
Renting in Fulham
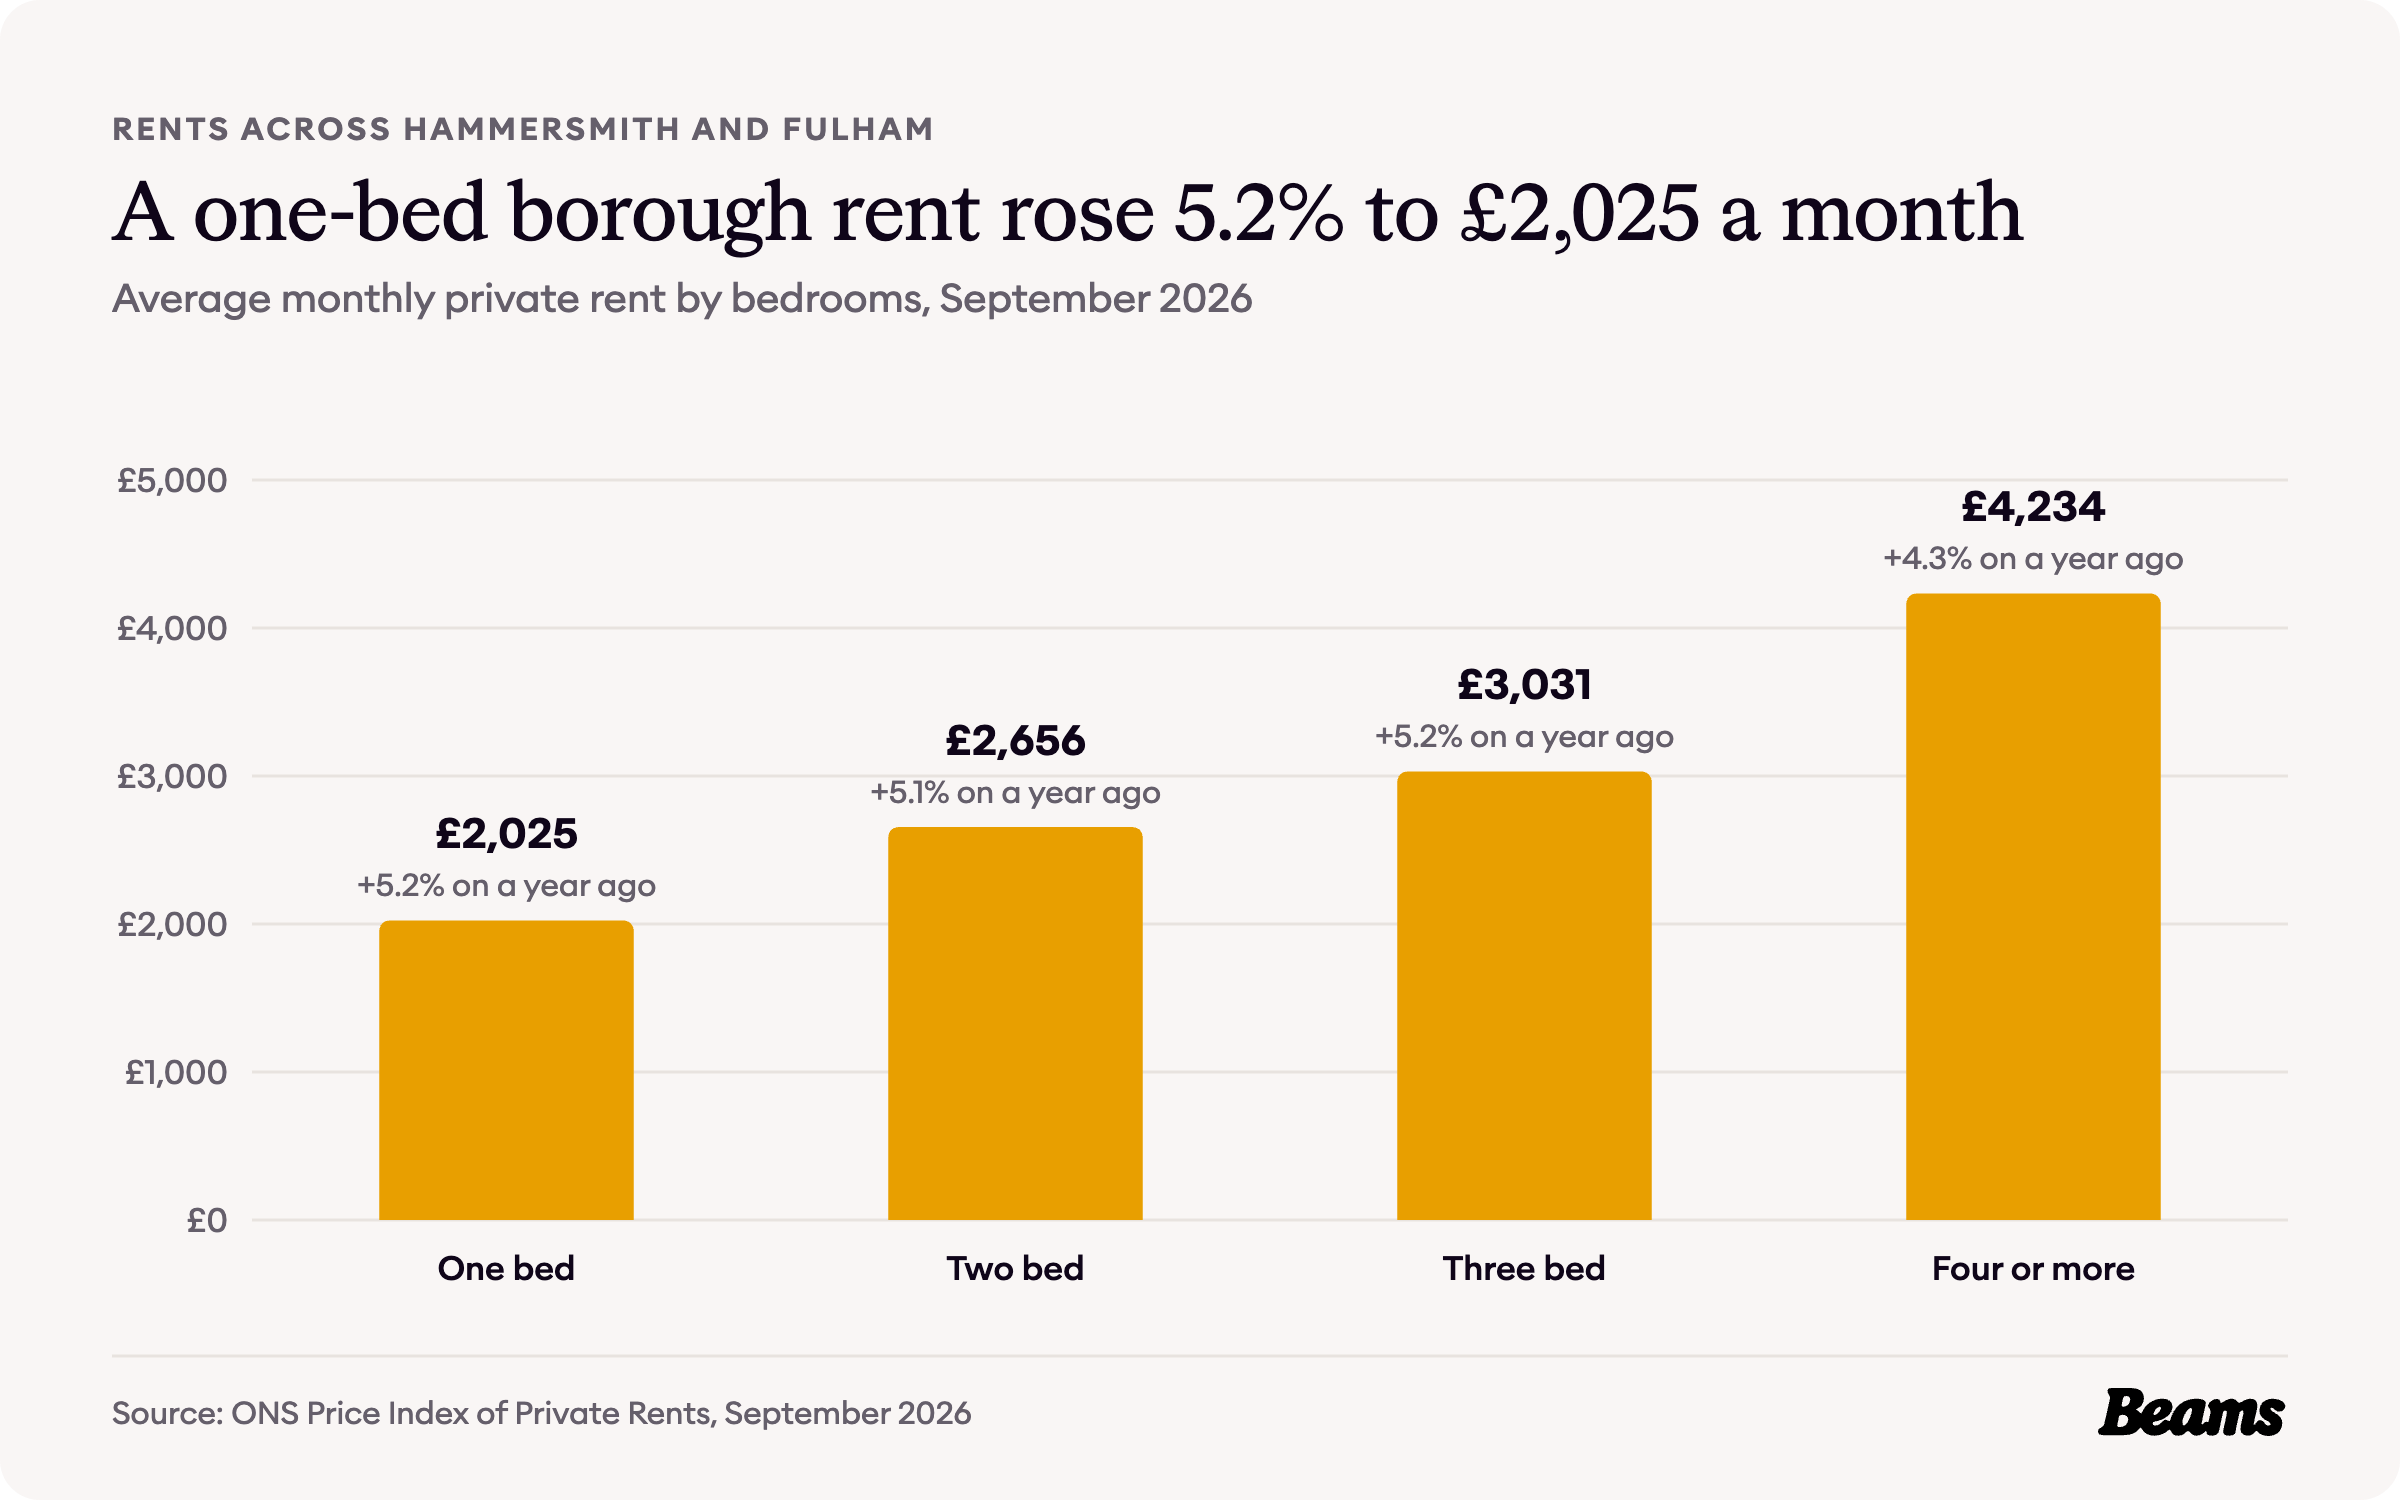
Rents are published for Hammersmith and Fulham as a whole. The average private rent was £2,861 a month in September 2026, up 4.9% on a year earlier, even as average prices fell [7]. A one-bedroom home averaged £2,025 a month, up 5.2%, a three-bedroom home £3,031 and a home with four or more bedrooms £4,234 [7].
With 37.1% of Fulham households renting privately [6], landlords have every reason to keep their flats in good order, and a tired bathroom is the kind of thing a bathroom renovation in Fulham can put right between tenancies.
Council Tax bands in Fulham
Council Tax bands in England still rest on what a home would have sold for on the open market on 1 April 1991 [10], so they give a rough picture of the size and value of the housing.
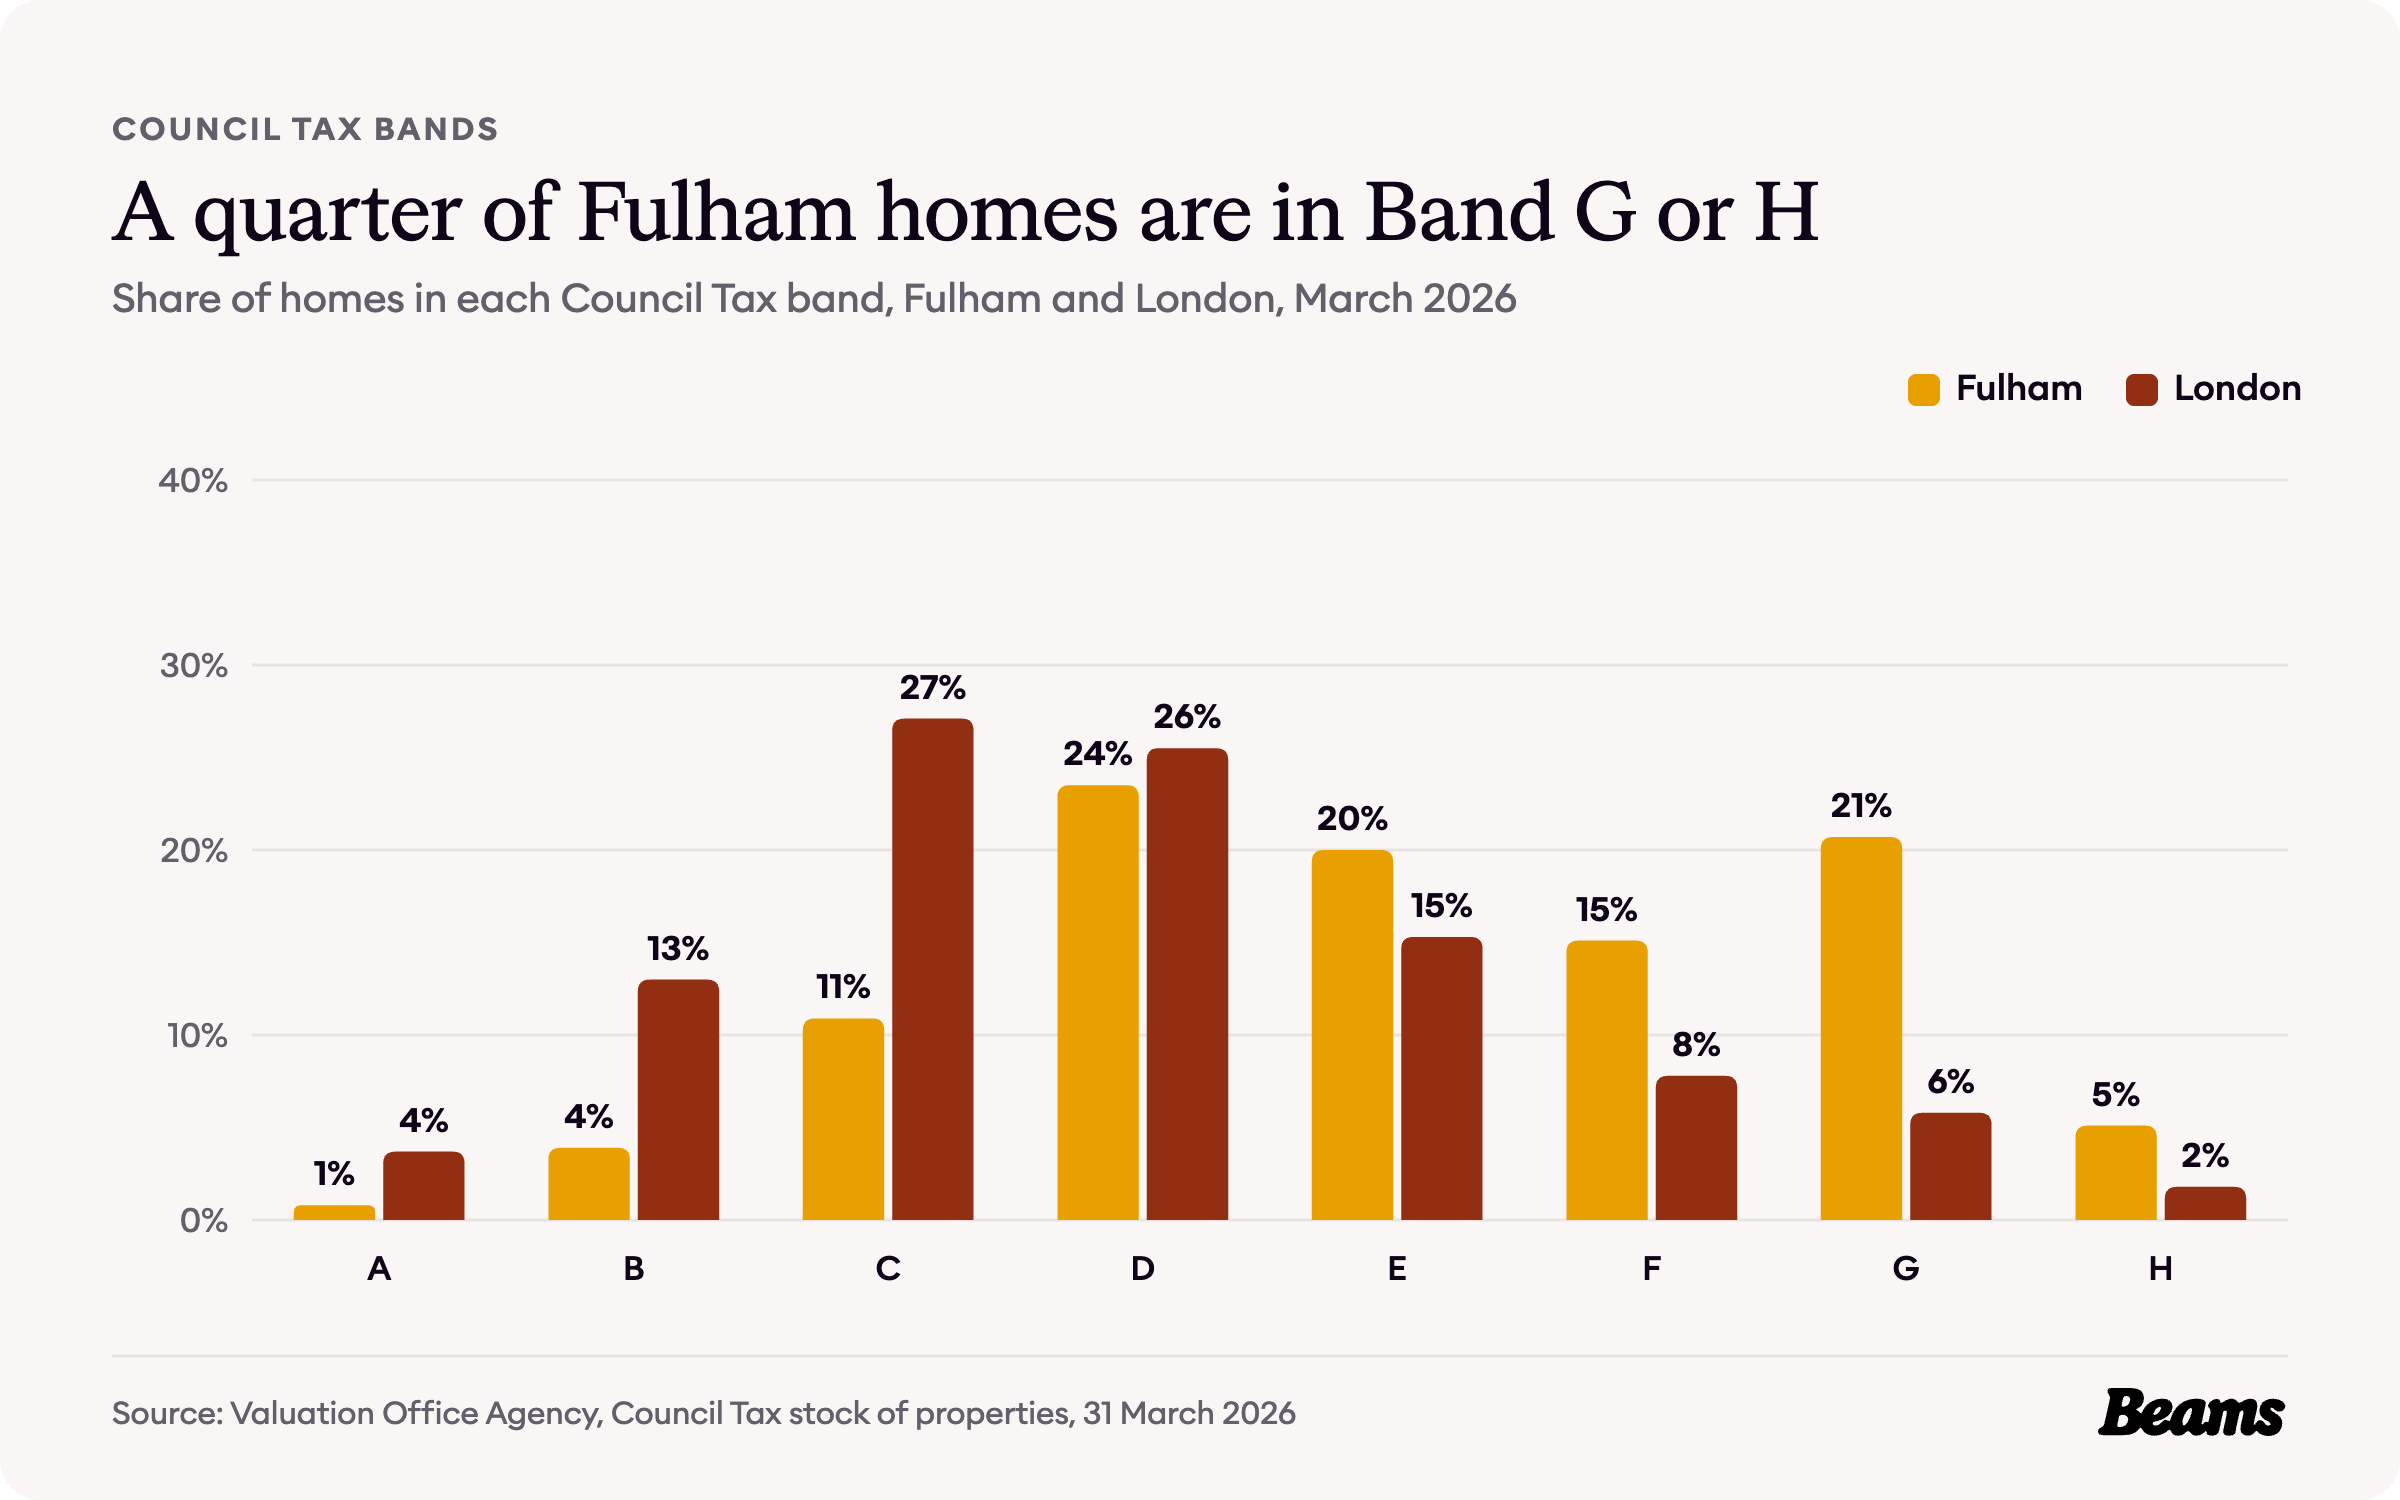
Band D is the most common band in Fulham, with 23.5% of homes, followed by Band G at 20.7% and Band E at 20.0%. A quarter of homes, 25.8%, are in Bands G and H, against 7.6% across London, and 15.6% are in Bands A to C, against 43.8% for London [4].
The rules on your street
Hammersmith and Fulham has 44 conservation areas, covering about half of the borough, plus two more in the north that are managed by the Old Oak and Park Royal Development Corporation [11]. Those in Fulham include Parsons Green, Studdridge Street, Moore Park, Walham Green, Hurlingham, Bishops Park, Fulham Park Gardens and Sands End. Inside them, additional controls apply to development, significant demolition, advertisements and work to trees, and some permitted development rights are restricted [11].
The council has also restricted permitted development rights at many individual properties with Article 4 directions, especially in conservation areas, and its list includes directions for Parsons Green, Studdridge Street, Walham Grove, Hurlingham and Central Fulham [12]. On top of those, a borough-wide Article 4 direction that came into force on 26 April 2018 removes permitted development rights for basement development across Hammersmith and Fulham, outside the Old Oak and Park Royal area [13]. So a basement conversion in Fulham, like the light-well basements already added under many Peterborough estate terraces, needs planning permission.
The council says householder applications usually take six to eight weeks to decide once they are validated, if there are no complications, and that major applications usually take longer [14]. Check the conservation area map and the Article 4 list for your address before you ask builders in Fulham for a fixed price.
Fulham housing statistics at a glance
- Median sale price, SW6, October 2025 to September 2026: £775,000 (607 sales) [9]
- Average house price, Hammersmith and Fulham, August 2026: £754,825 (London £554,430) [7] [8]
- Change on a year earlier, Hammersmith and Fulham: -5.1% (London -2.2%) [7] [8]
- Average terraced house, Hammersmith and Fulham: £1,172,812 (London £648,650) [7] [8]
- Average private rent, Hammersmith and Fulham, September 2026: £2,861 a month [7]
- Homes built before 1919: 58.5% (London 29.0%) [4]
- Households living in a terraced house: 24.0% (London 21.3%) [5]
- Households living in a converted flat: 23.8% (London 11.1%) [5]
- Households who own their home: 37.6% (London 45.2%) [6]
- Conservation areas in Hammersmith and Fulham: 44 [11]
Frequently asked questions
References
- Hammersmith and Fulham Council, Barclay Road Conservation Area Character Profile. Adopted July 2017, section 4, brief history.
- Hammersmith and Fulham Council, Moore Park Conservation Area Character Profile. Section 4, history.
- Hammersmith and Fulham Council, Studdridge Street Conservation Area Character Profile. Sections 4 and 5, history and character.
- Valuation Office Agency, Council Tax: stock of properties 2026. Table CTSOP4.1, properties by build period and Council Tax band at 31 March 2026, the ten Fulham areas and London.
- ONS, Census 2021 table TS044: Accommodation type. Households by type of home, the ten Fulham areas and London.
- ONS, Census 2021 table TS054: Tenure. Households by tenure, the ten Fulham areas and London.
- ONS, Housing prices in Hammersmith and Fulham. UK House Price Index for August 2026 and Price Index of Private Rents for September 2026, updated 21 October 2026.
- HM Land Registry, UK House Price Index. Average prices for Hammersmith and Fulham, London and England, August 2006 to August 2026.
- HM Land Registry, Price Paid Data. Sales in the SW6 postcode district, October 2025 to September 2026.
- GOV.UK, How domestic properties are assessed for Council Tax bands. Accessed 29 October 2026.
- Hammersmith and Fulham Council, Conservation areas. Accessed 29 October 2026.
- Hammersmith and Fulham Council, Properties affected by Article 4 Directions. Accessed 29 October 2026.
- Hammersmith and Fulham Council, Article 4 Directions. Accessed 29 October 2026.
- Hammersmith and Fulham Council, After a decision is made. Accessed 29 October 2026.
Thinking of improving rather than moving?
Tell us about your Fulham home and what you want to change. We'll give you a free estimate, then up to three vetted builders quote against the same specification.