
East Dulwich housing statistics 2026
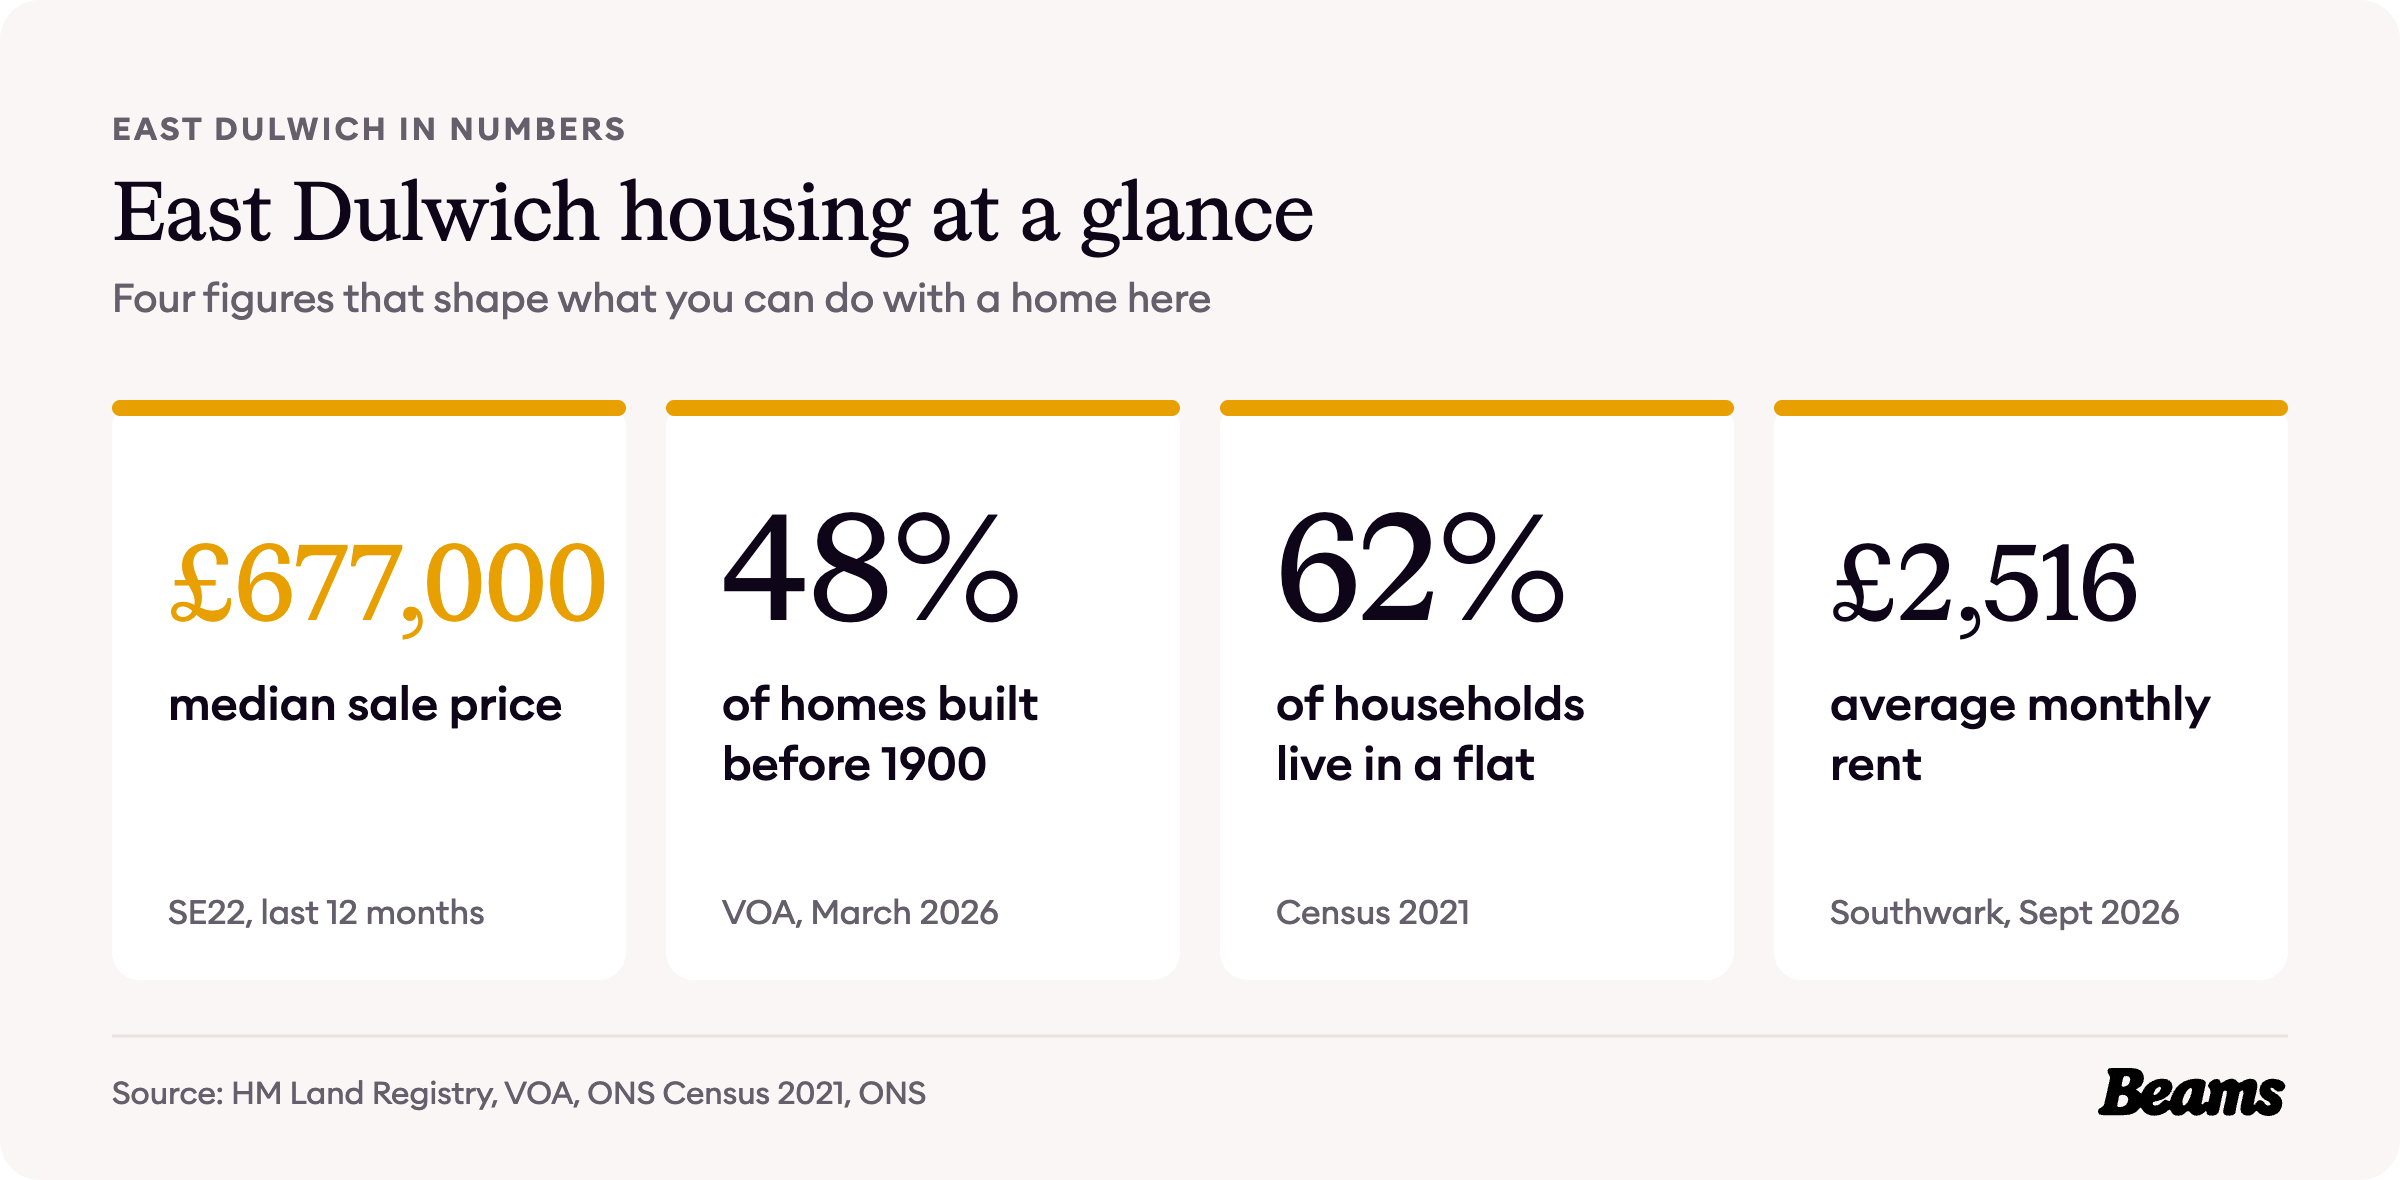
East Dulwich went from dairy farm and market gardens to a finished Victorian suburb in about twenty years, and most of those streets are still standing. These are the numbers behind that story, from the terraces built for London clerks to today's £677,000 typical sale in SE22.
Every figure comes from an official source and is dated, so you can see exactly what you are working with before you plan a home renovation in East Dulwich. The sources are numbered in brackets and listed in full at the end of the page.
A suburb built in twenty years
East Dulwich was turned from fields and market gardens into housing between 1865 and 1885, through the development of two estates. Friern Manor Farm, a large dairy farm between Wood Vale, Barry Road and Lordship Lane, was bought by the British Land Company and sold as 200 building plots. The land to the west, up to East Dulwich Road, was part of the Bower-Smith estate [1].
The railway reached East Dulwich and North Dulwich in 1868. The new houses were aimed at London clerks, and the people who moved in were largely young families [1].
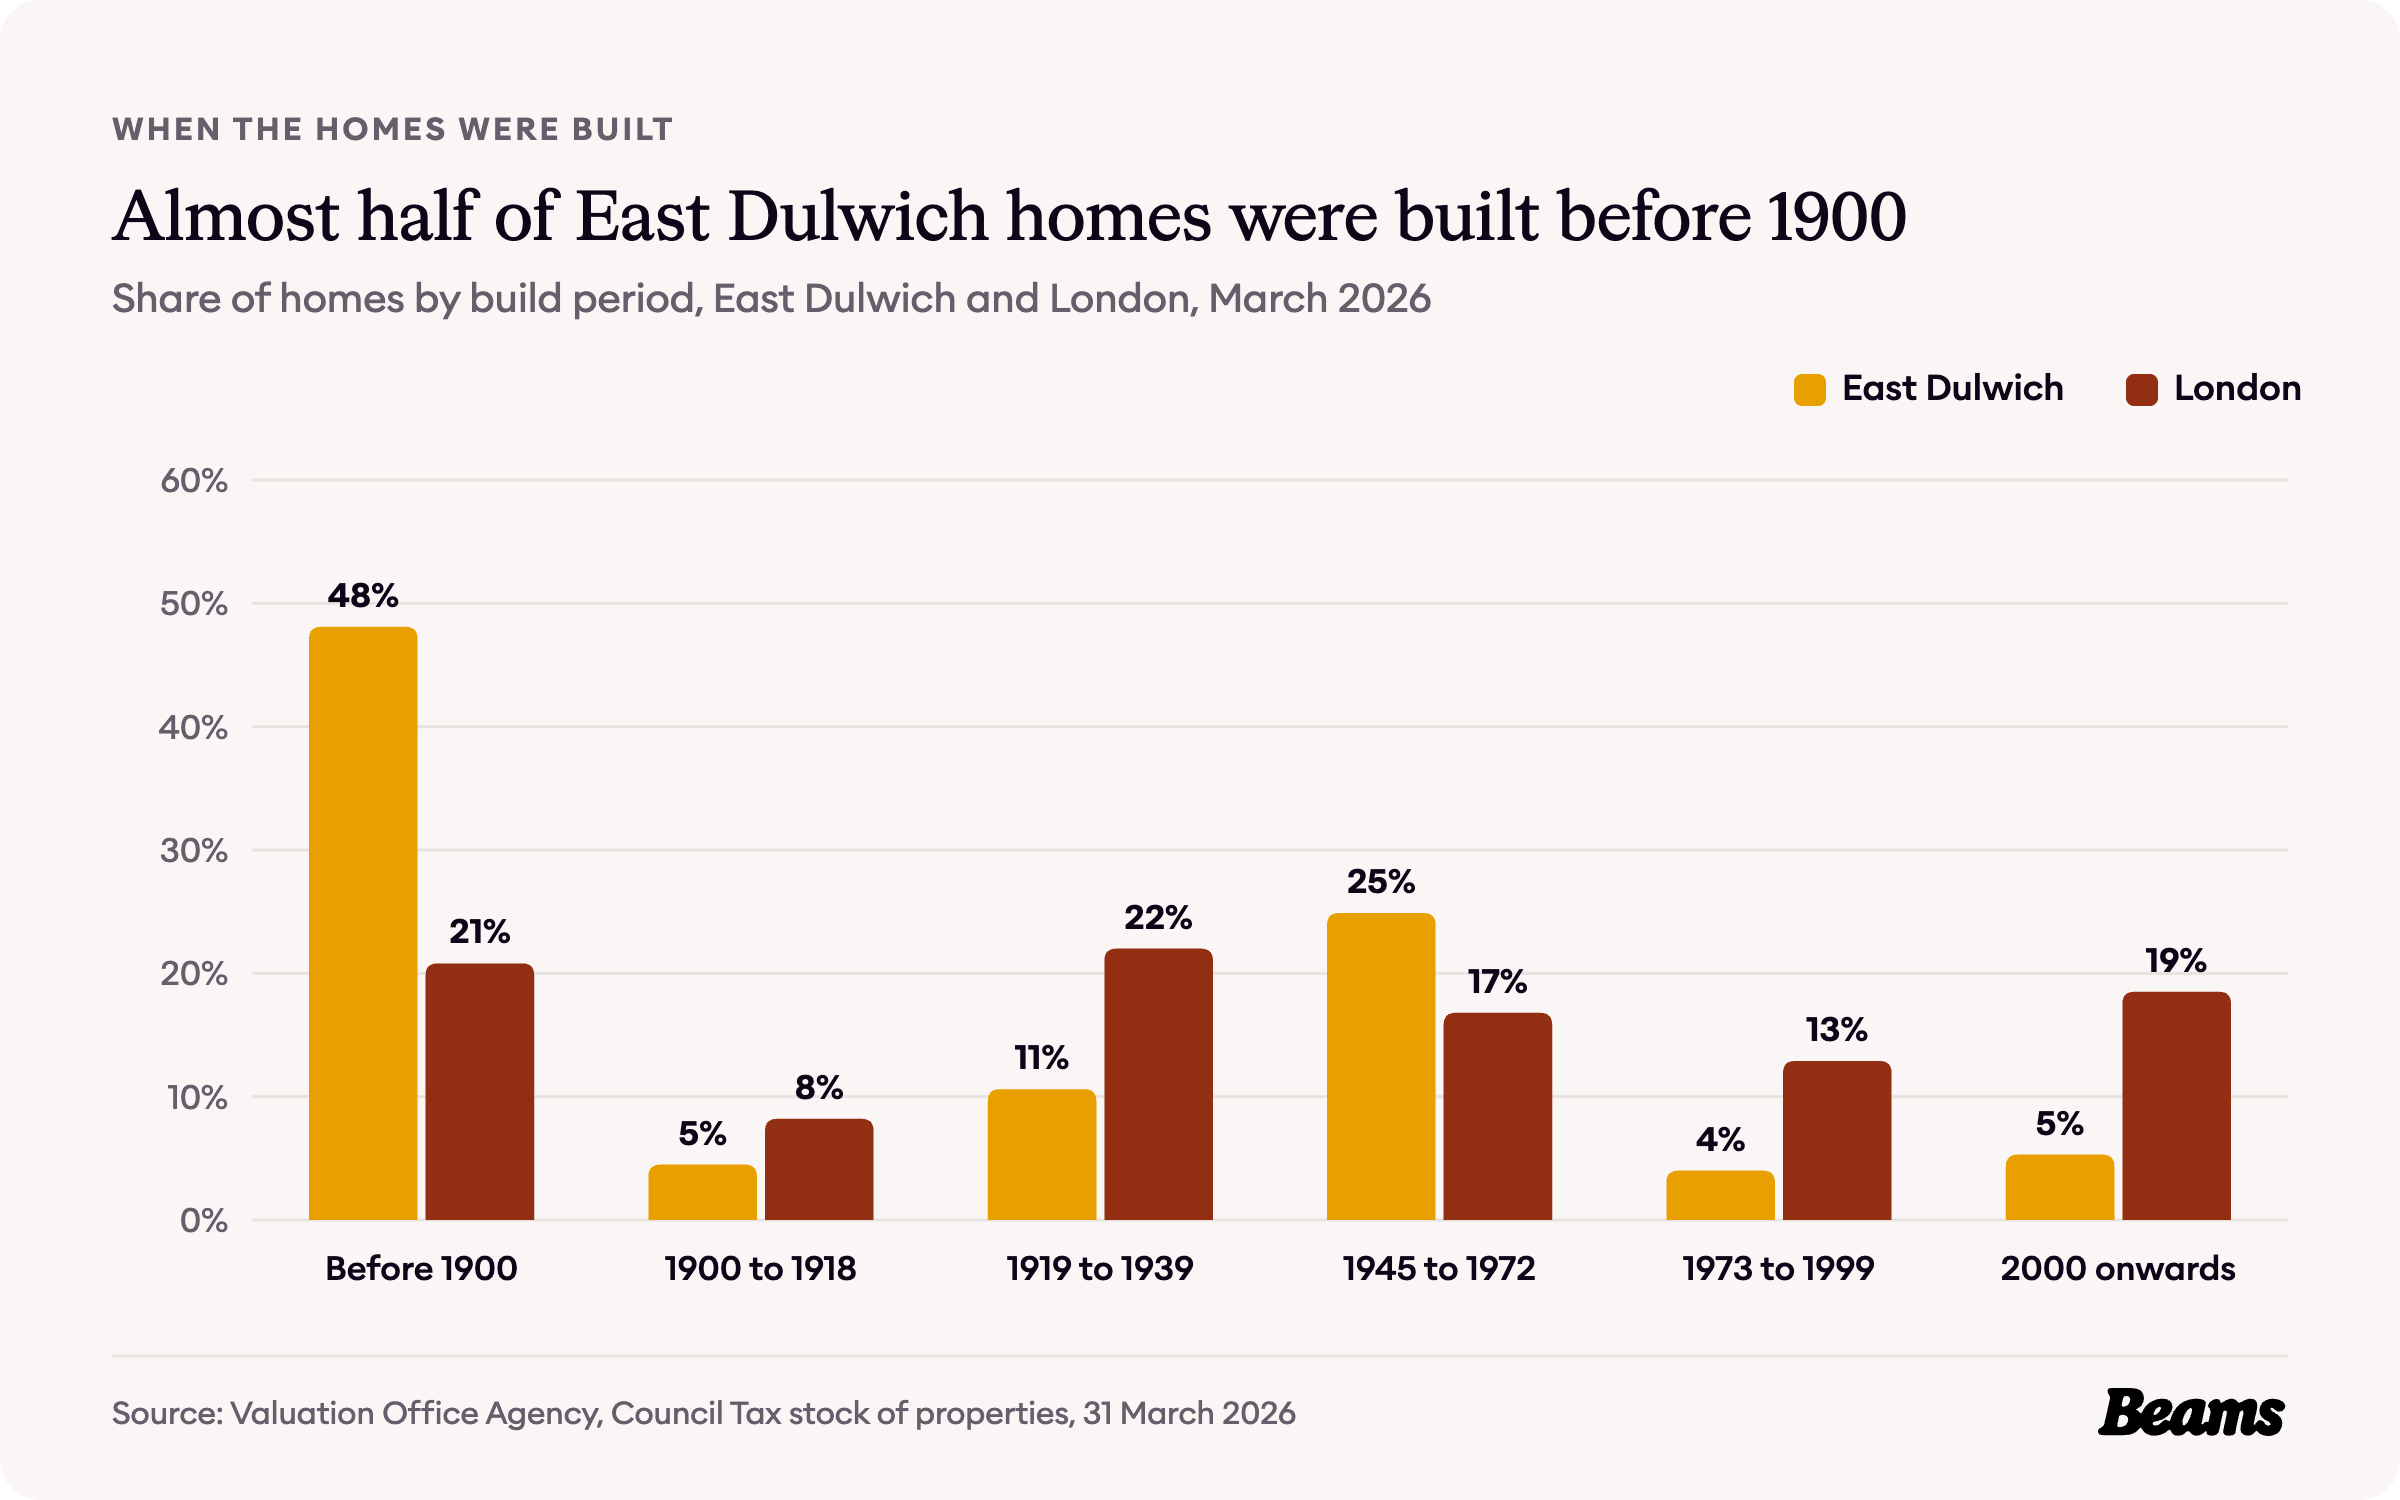
That burst of building still shapes the neighbourhood. The Valuation Office Agency counts 10,930 homes across the North Dulwich, East Dulwich and Dulwich Hill areas, and 48.1% of them were built before 1900, more than twice London's 20.8% [2].
Very little followed for decades. Just 4.5% of homes went up between 1900 and 1918 and 10.6% between the wars, against 22.0% for London. The next wave came after the war, when 24.9% were built between 1945 and 1972, and only 5.3% date from 2000 onwards, against 18.5% across London [2]. Those late Victorian terraces, with their pitched roofs and unused space above the top floor, are where a loft conversion in East Dulwich usually starts.
How East Dulwich households live
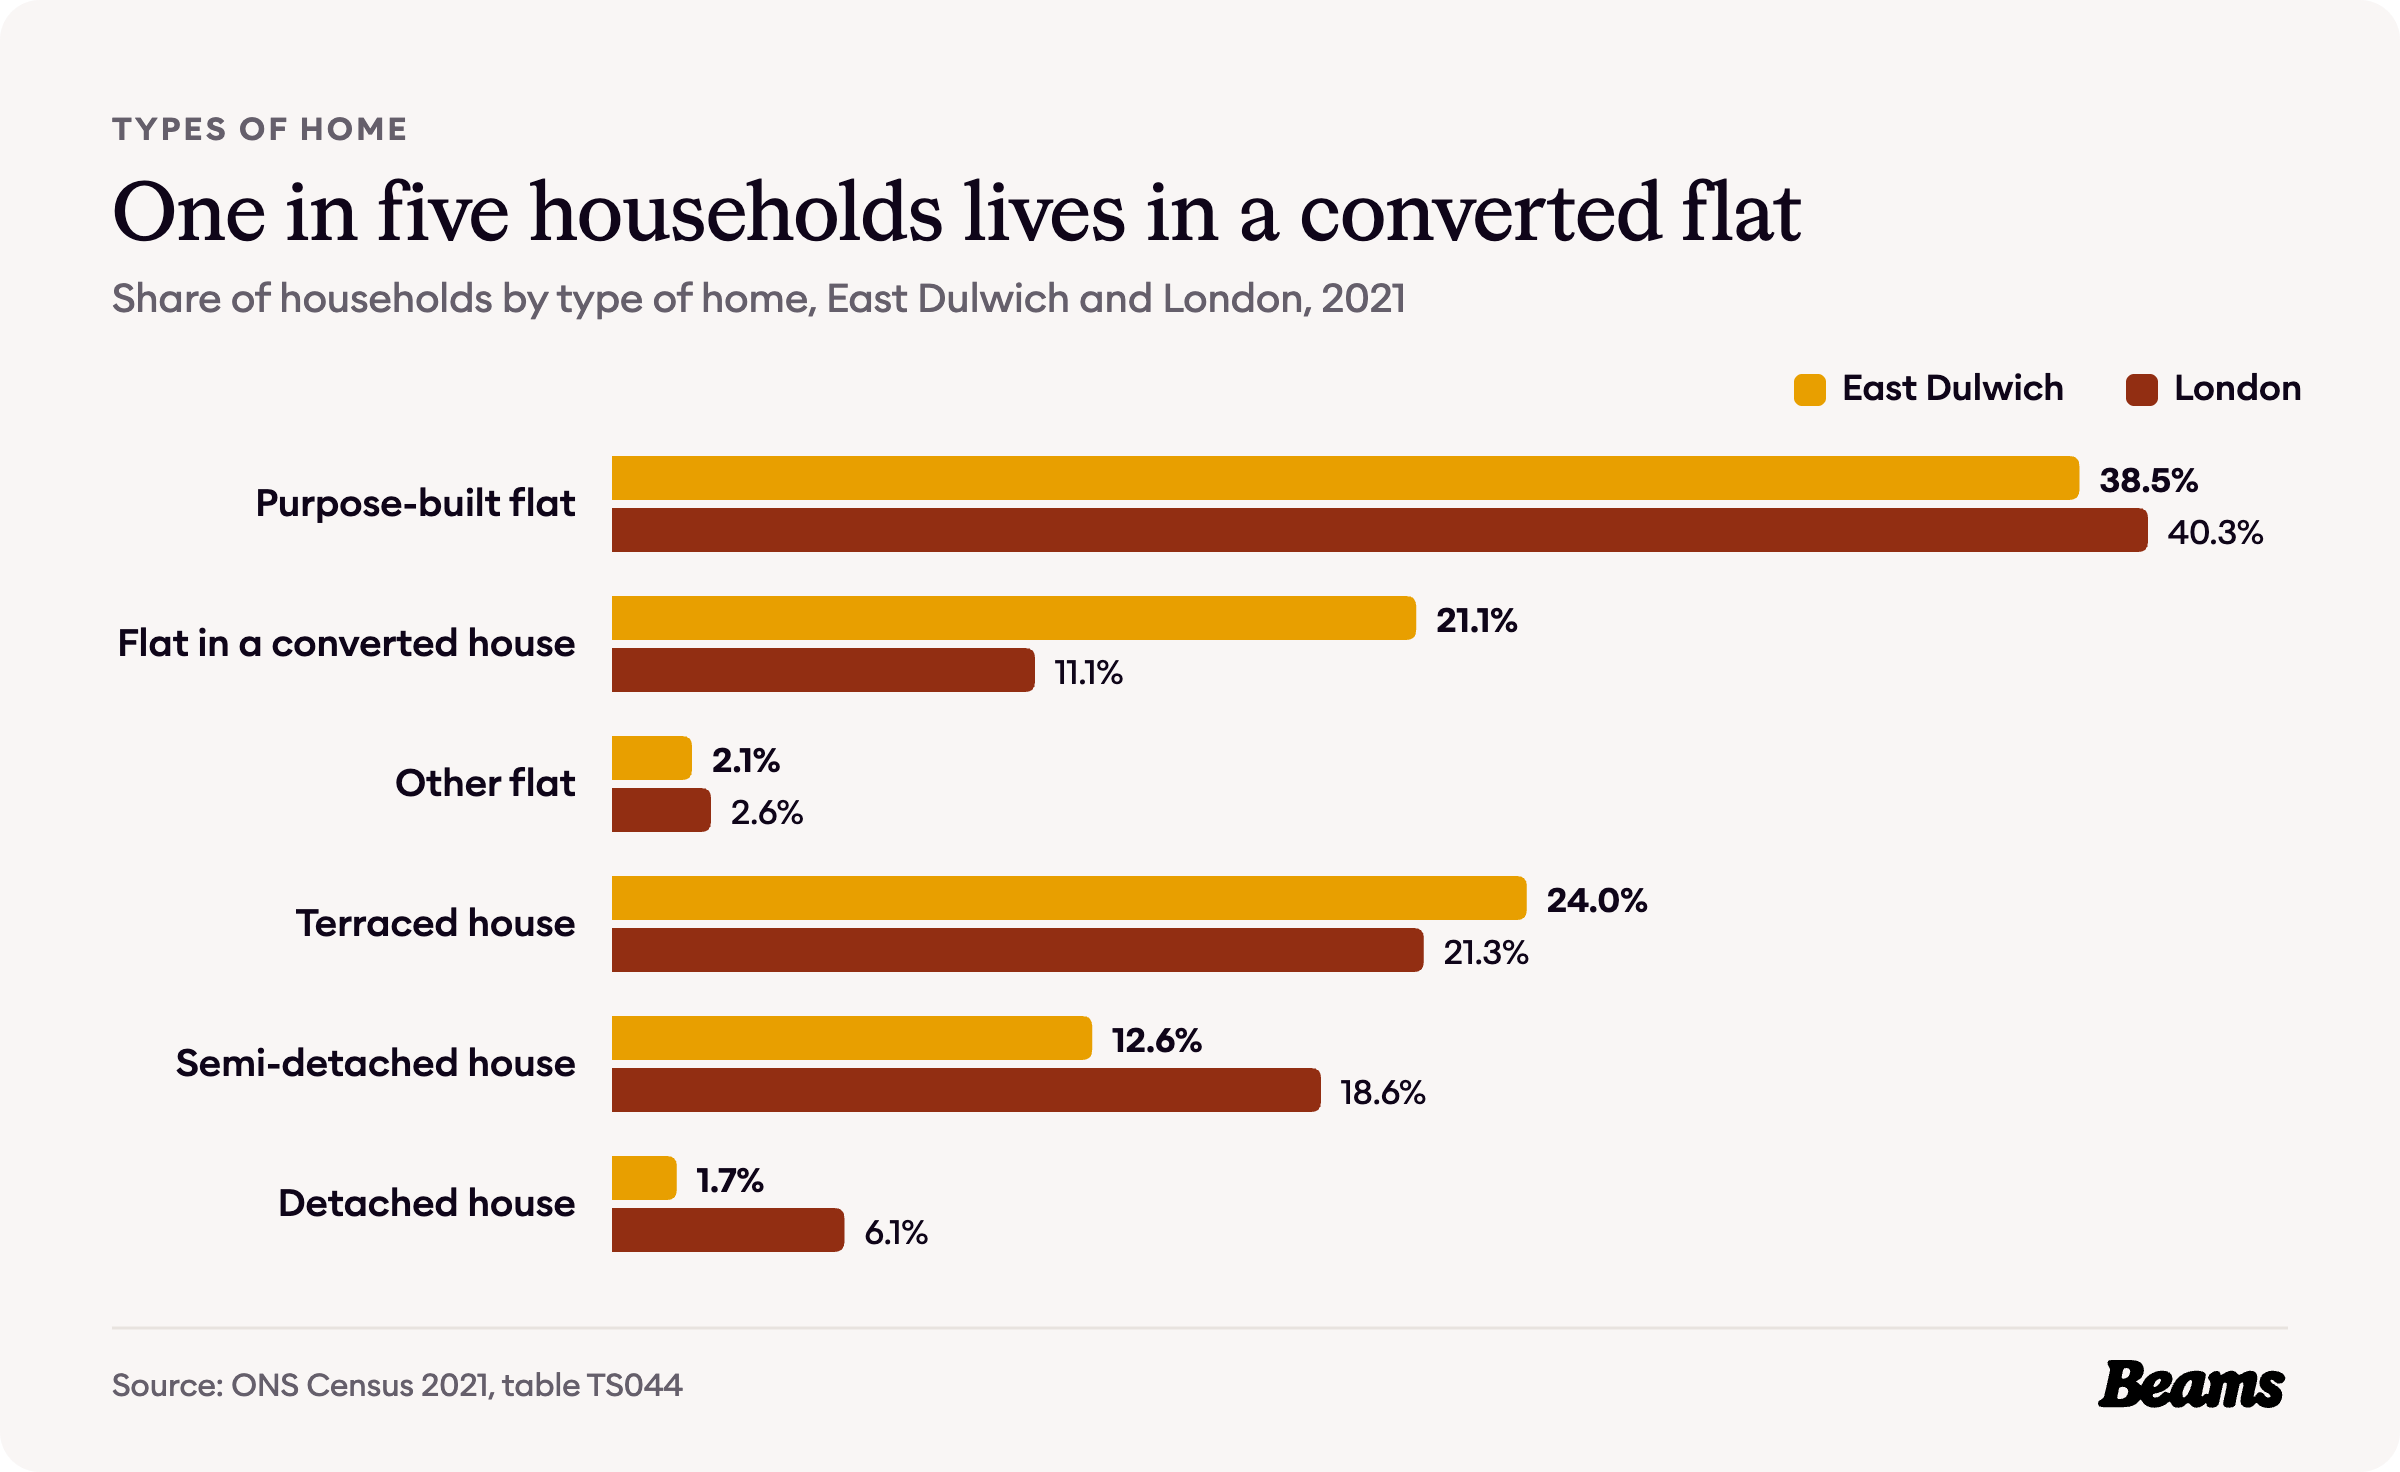
The 2021 Census counted 10,307 households in these areas. 38.5% live in a purpose-built flat and 21.1% in a flat inside a converted house, almost twice the London share of 11.1% [3].
Taking every kind of flat together, 61.7% of households live in one, against 54.0% across London. Most of the rest live in a terraced house, 24.0%, or a semi-detached one, 12.6% [3]. A converted flat is a house that has been divided up, often one flat to a floor, which is why a kitchen renovation in East Dulwich so often means fitting a modern kitchen into one storey of a Victorian house.
Who owns East Dulwich's homes
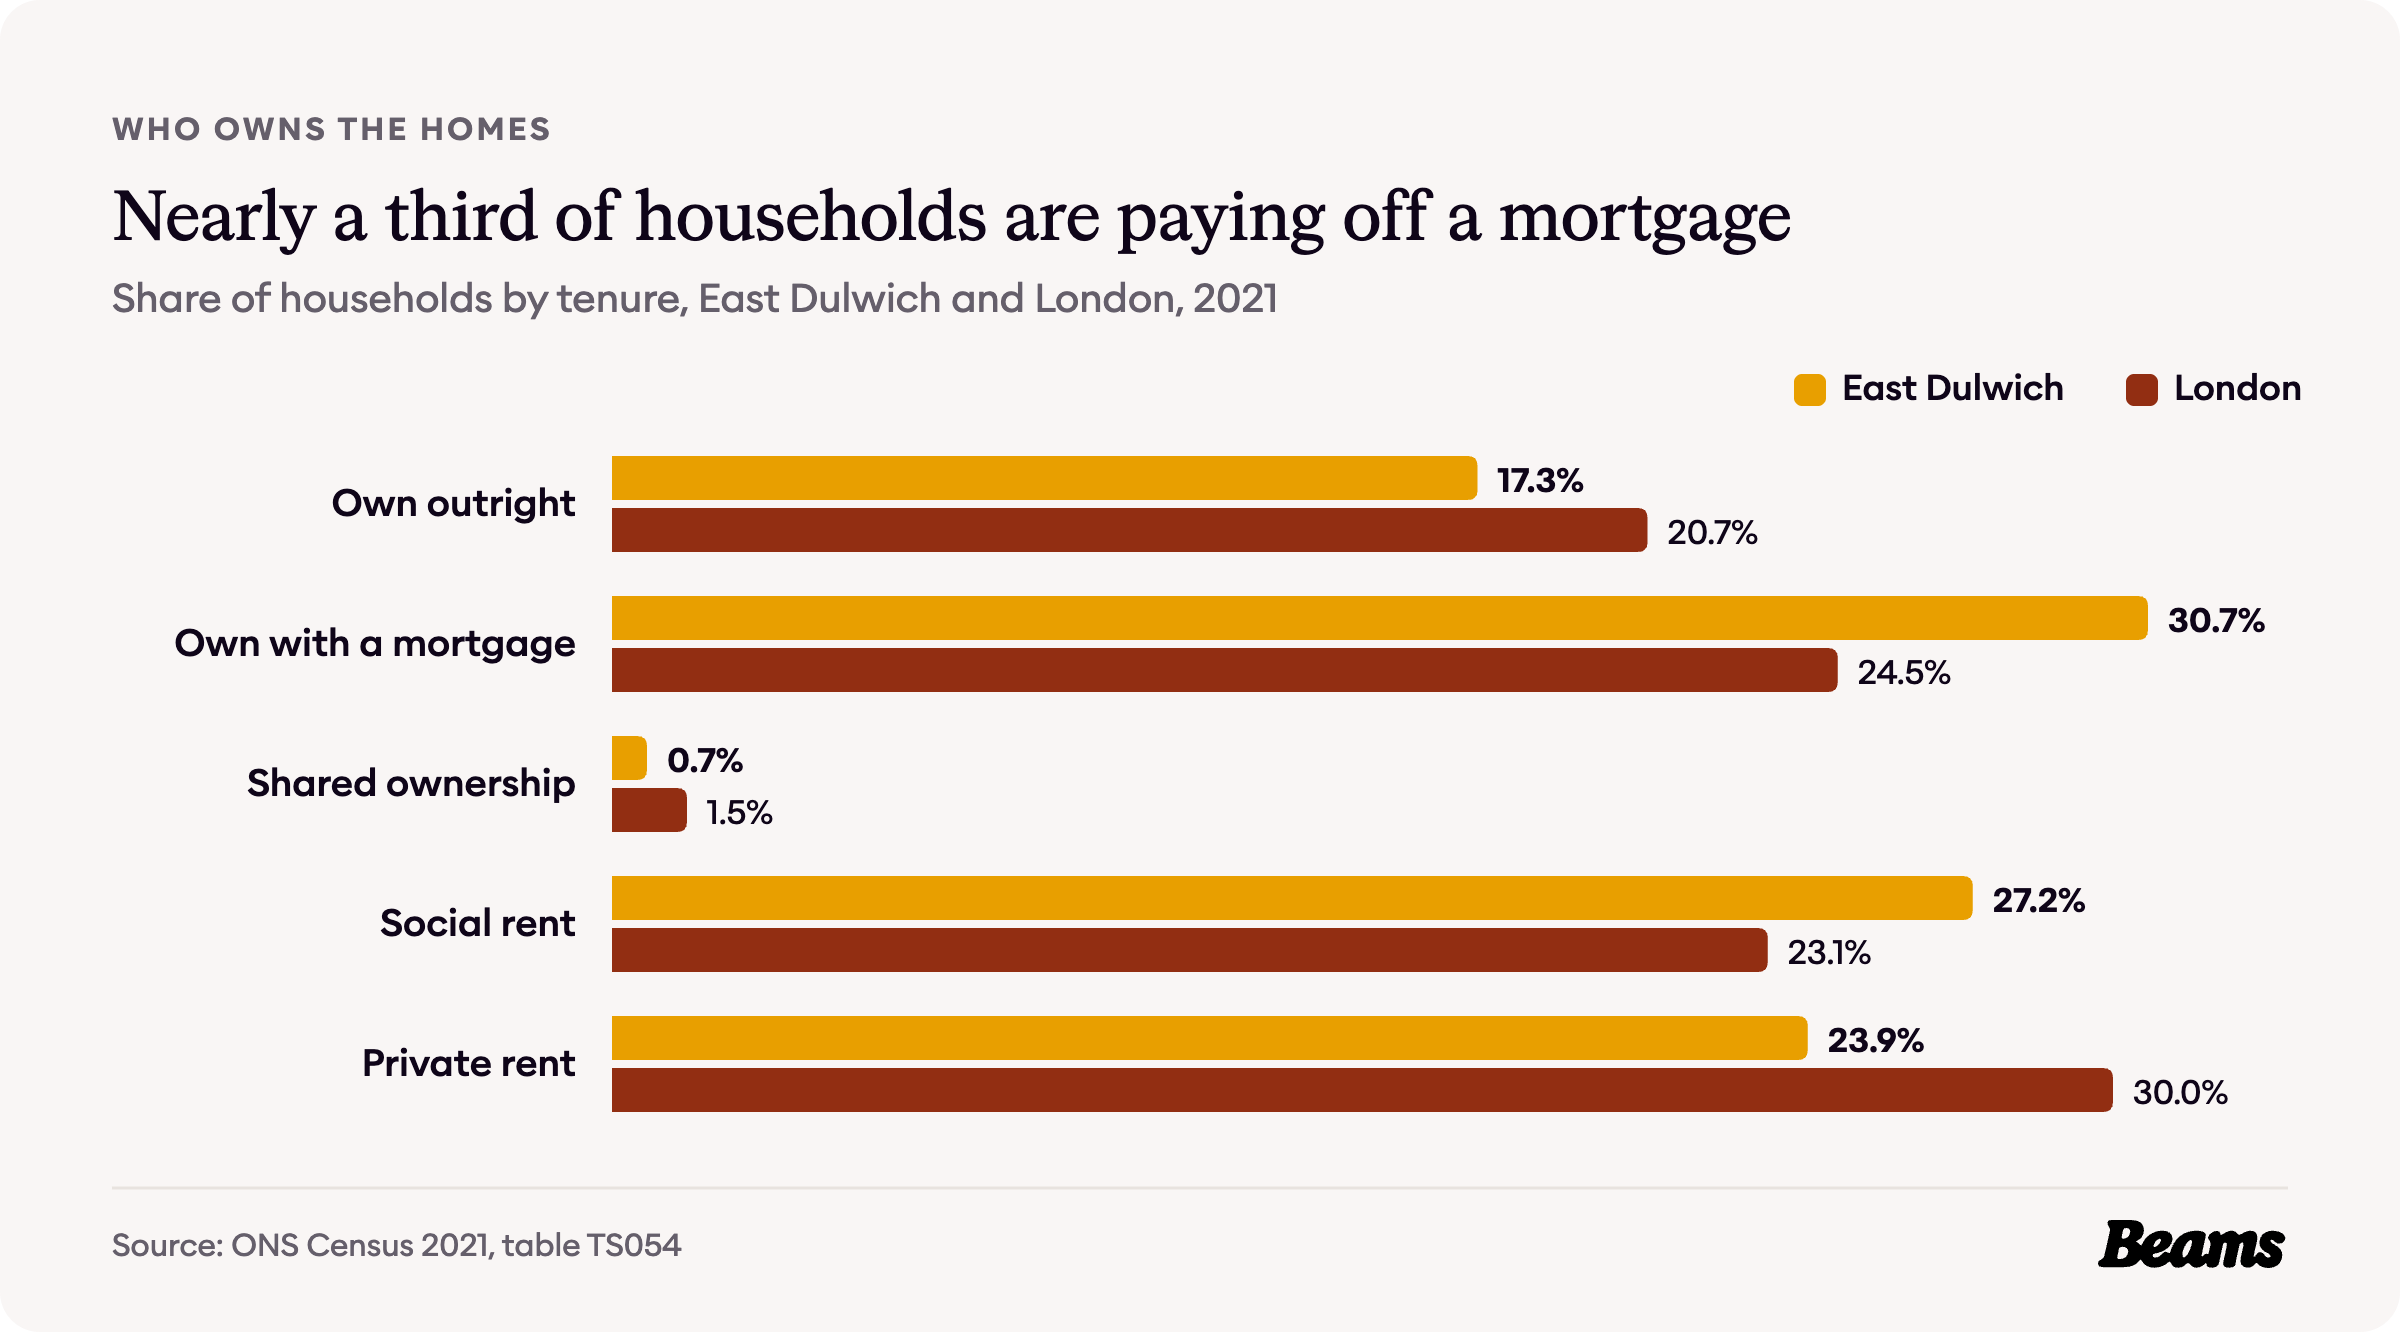
48.0% of households own their home, 17.3% outright and 30.7% with a mortgage. That is a little above London's 45.2%, and the share still paying off a mortgage is well above London's 24.5% [4].
Social renting accounts for 27.2% of households and private renting for 23.9%, against 23.1% and 30.0% across London [4].
What an East Dulwich home costs
House price and rent indexes are published for the borough as a whole, so the UK House Price Index and rent figures on this page cover all of Southwark. The census and VOA figures cover the North Dulwich, East Dulwich and Dulwich Hill areas, and the local sale prices cover the SE22 postcode district.
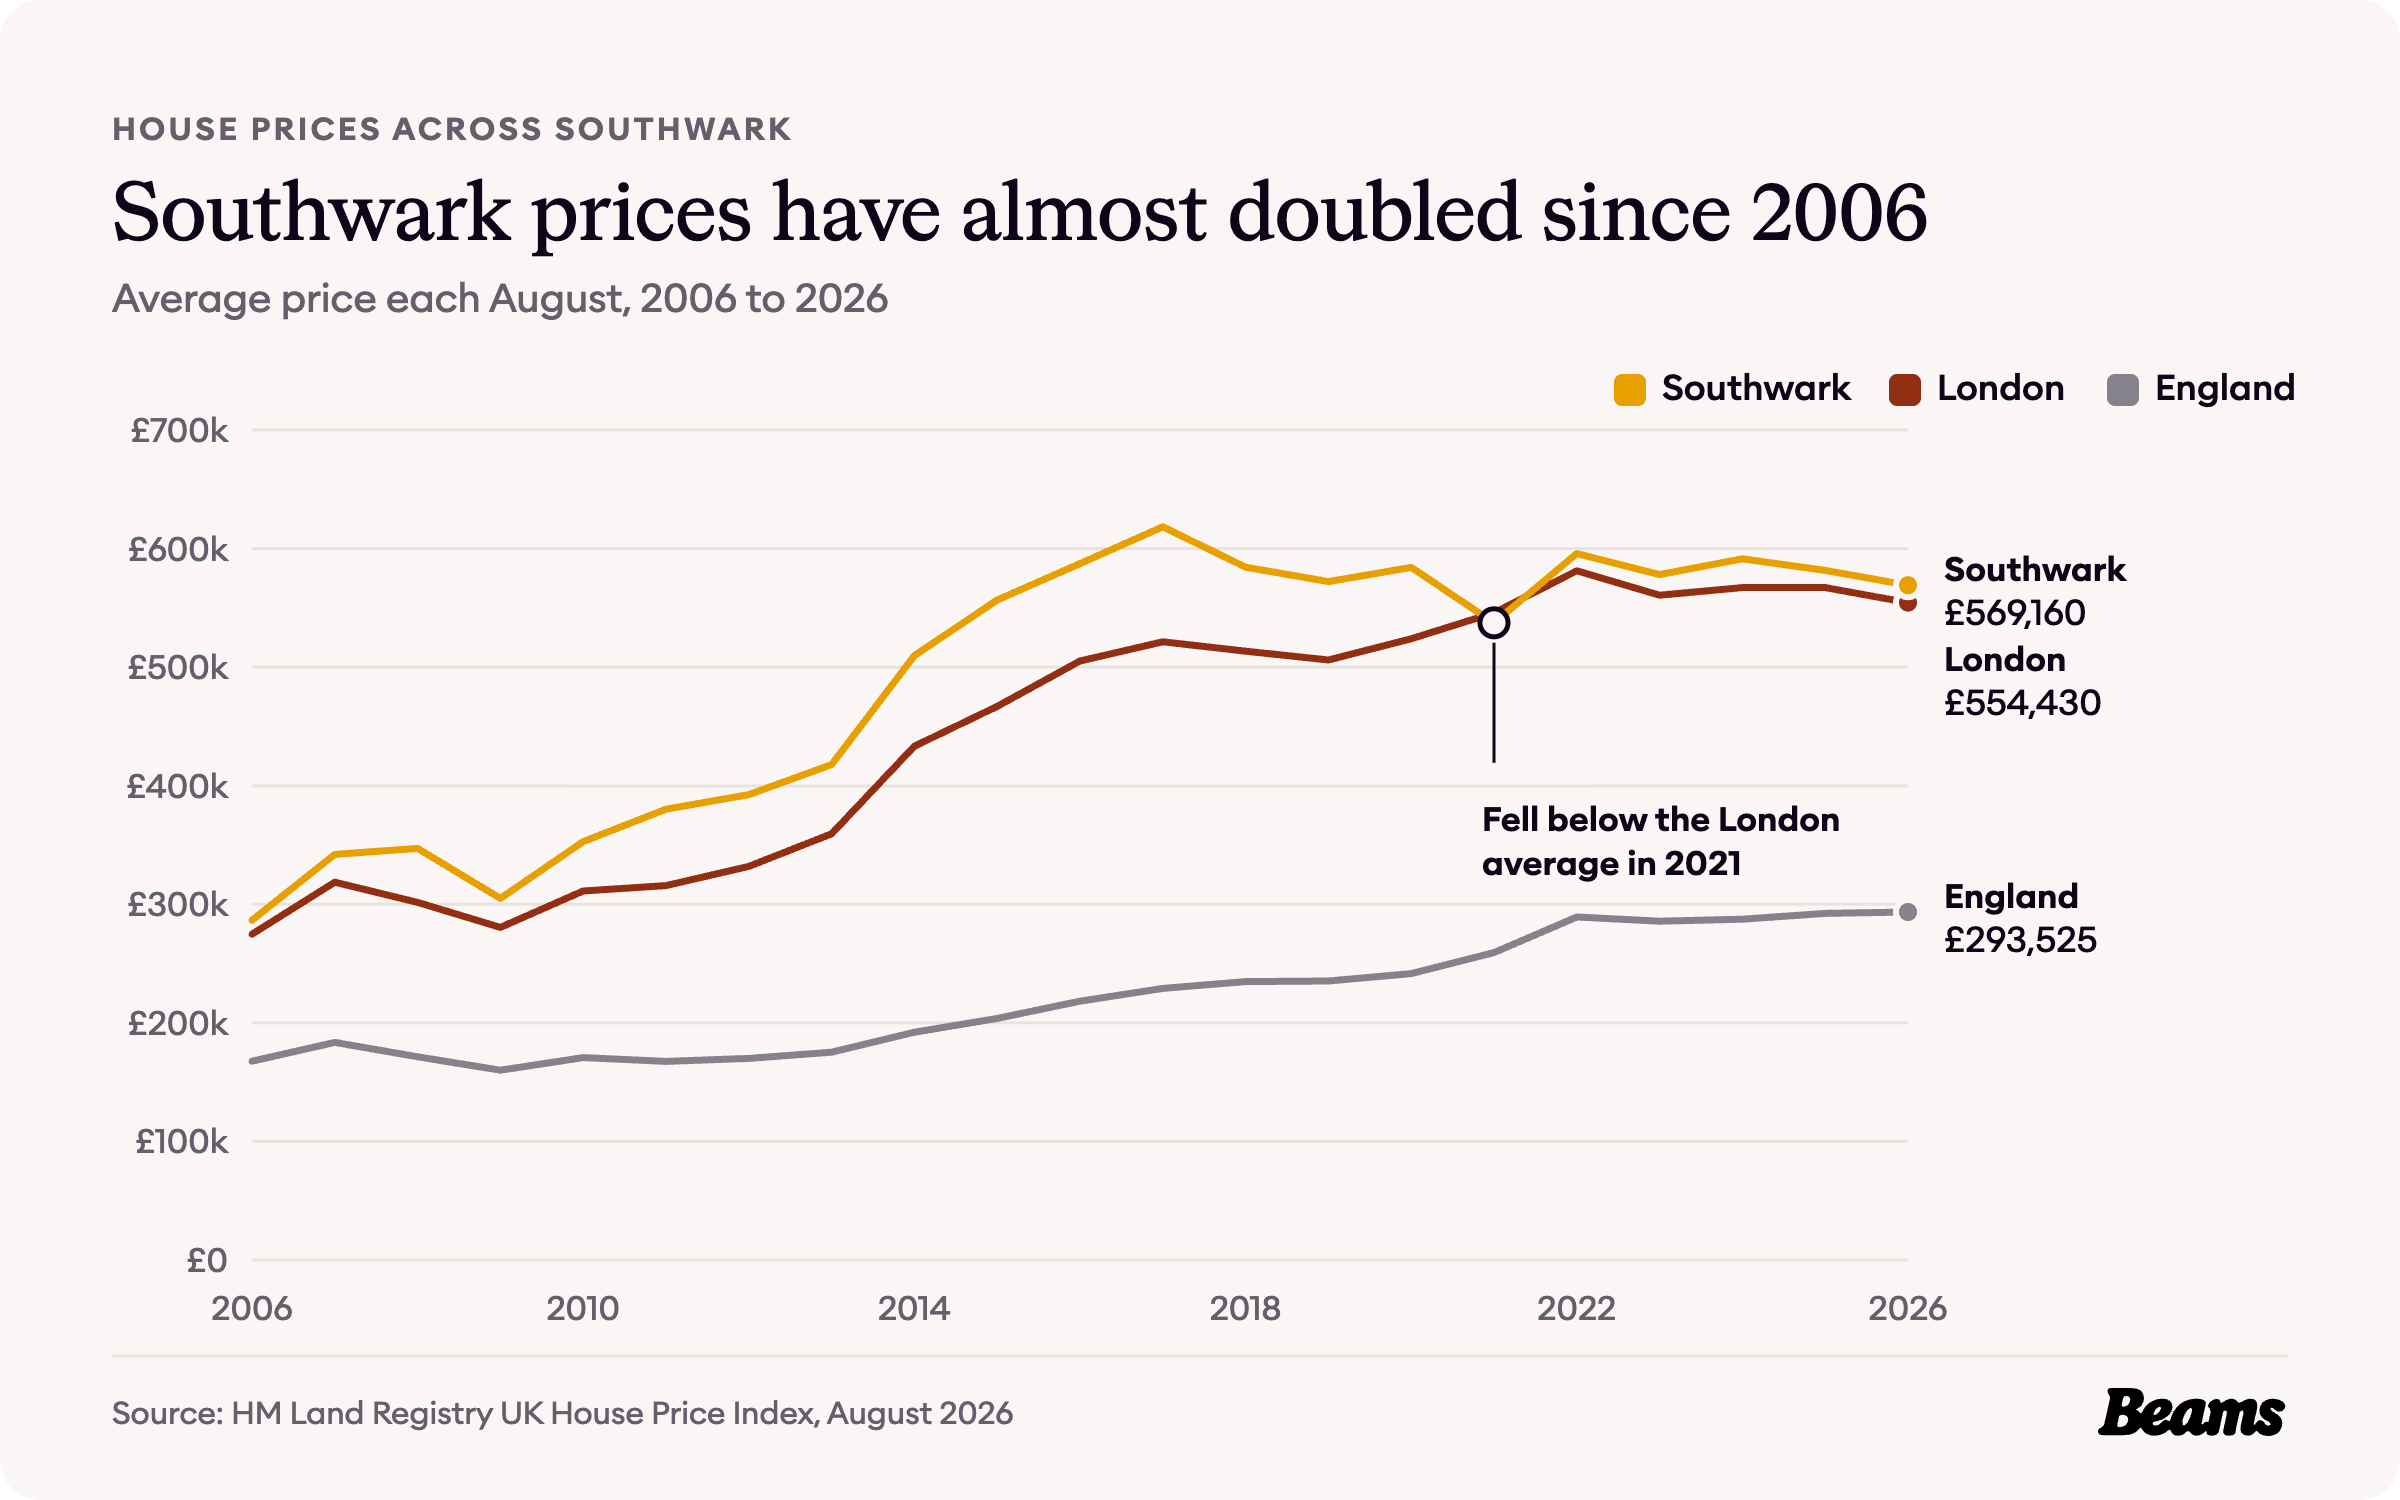
The average Southwark home cost £569,160 in August 2026, 2.1% less than a year earlier [5]. That is about 3% above the London average of £554,430, and almost twice the England average of £293,525 [6].
Southwark has been dearer than London for most of the past twenty years. In August 2006 its average was £286,658, against £274,815 for London. The biggest rise came between 2013 and 2014, from £417,871 to £509,781, and the average peaked at £618,306 in 2017. In 2021 Southwark fell below the London average, at £537,423 against £545,831, before moving back above it in 2022 [6].
Flats, terraces and the gap between them
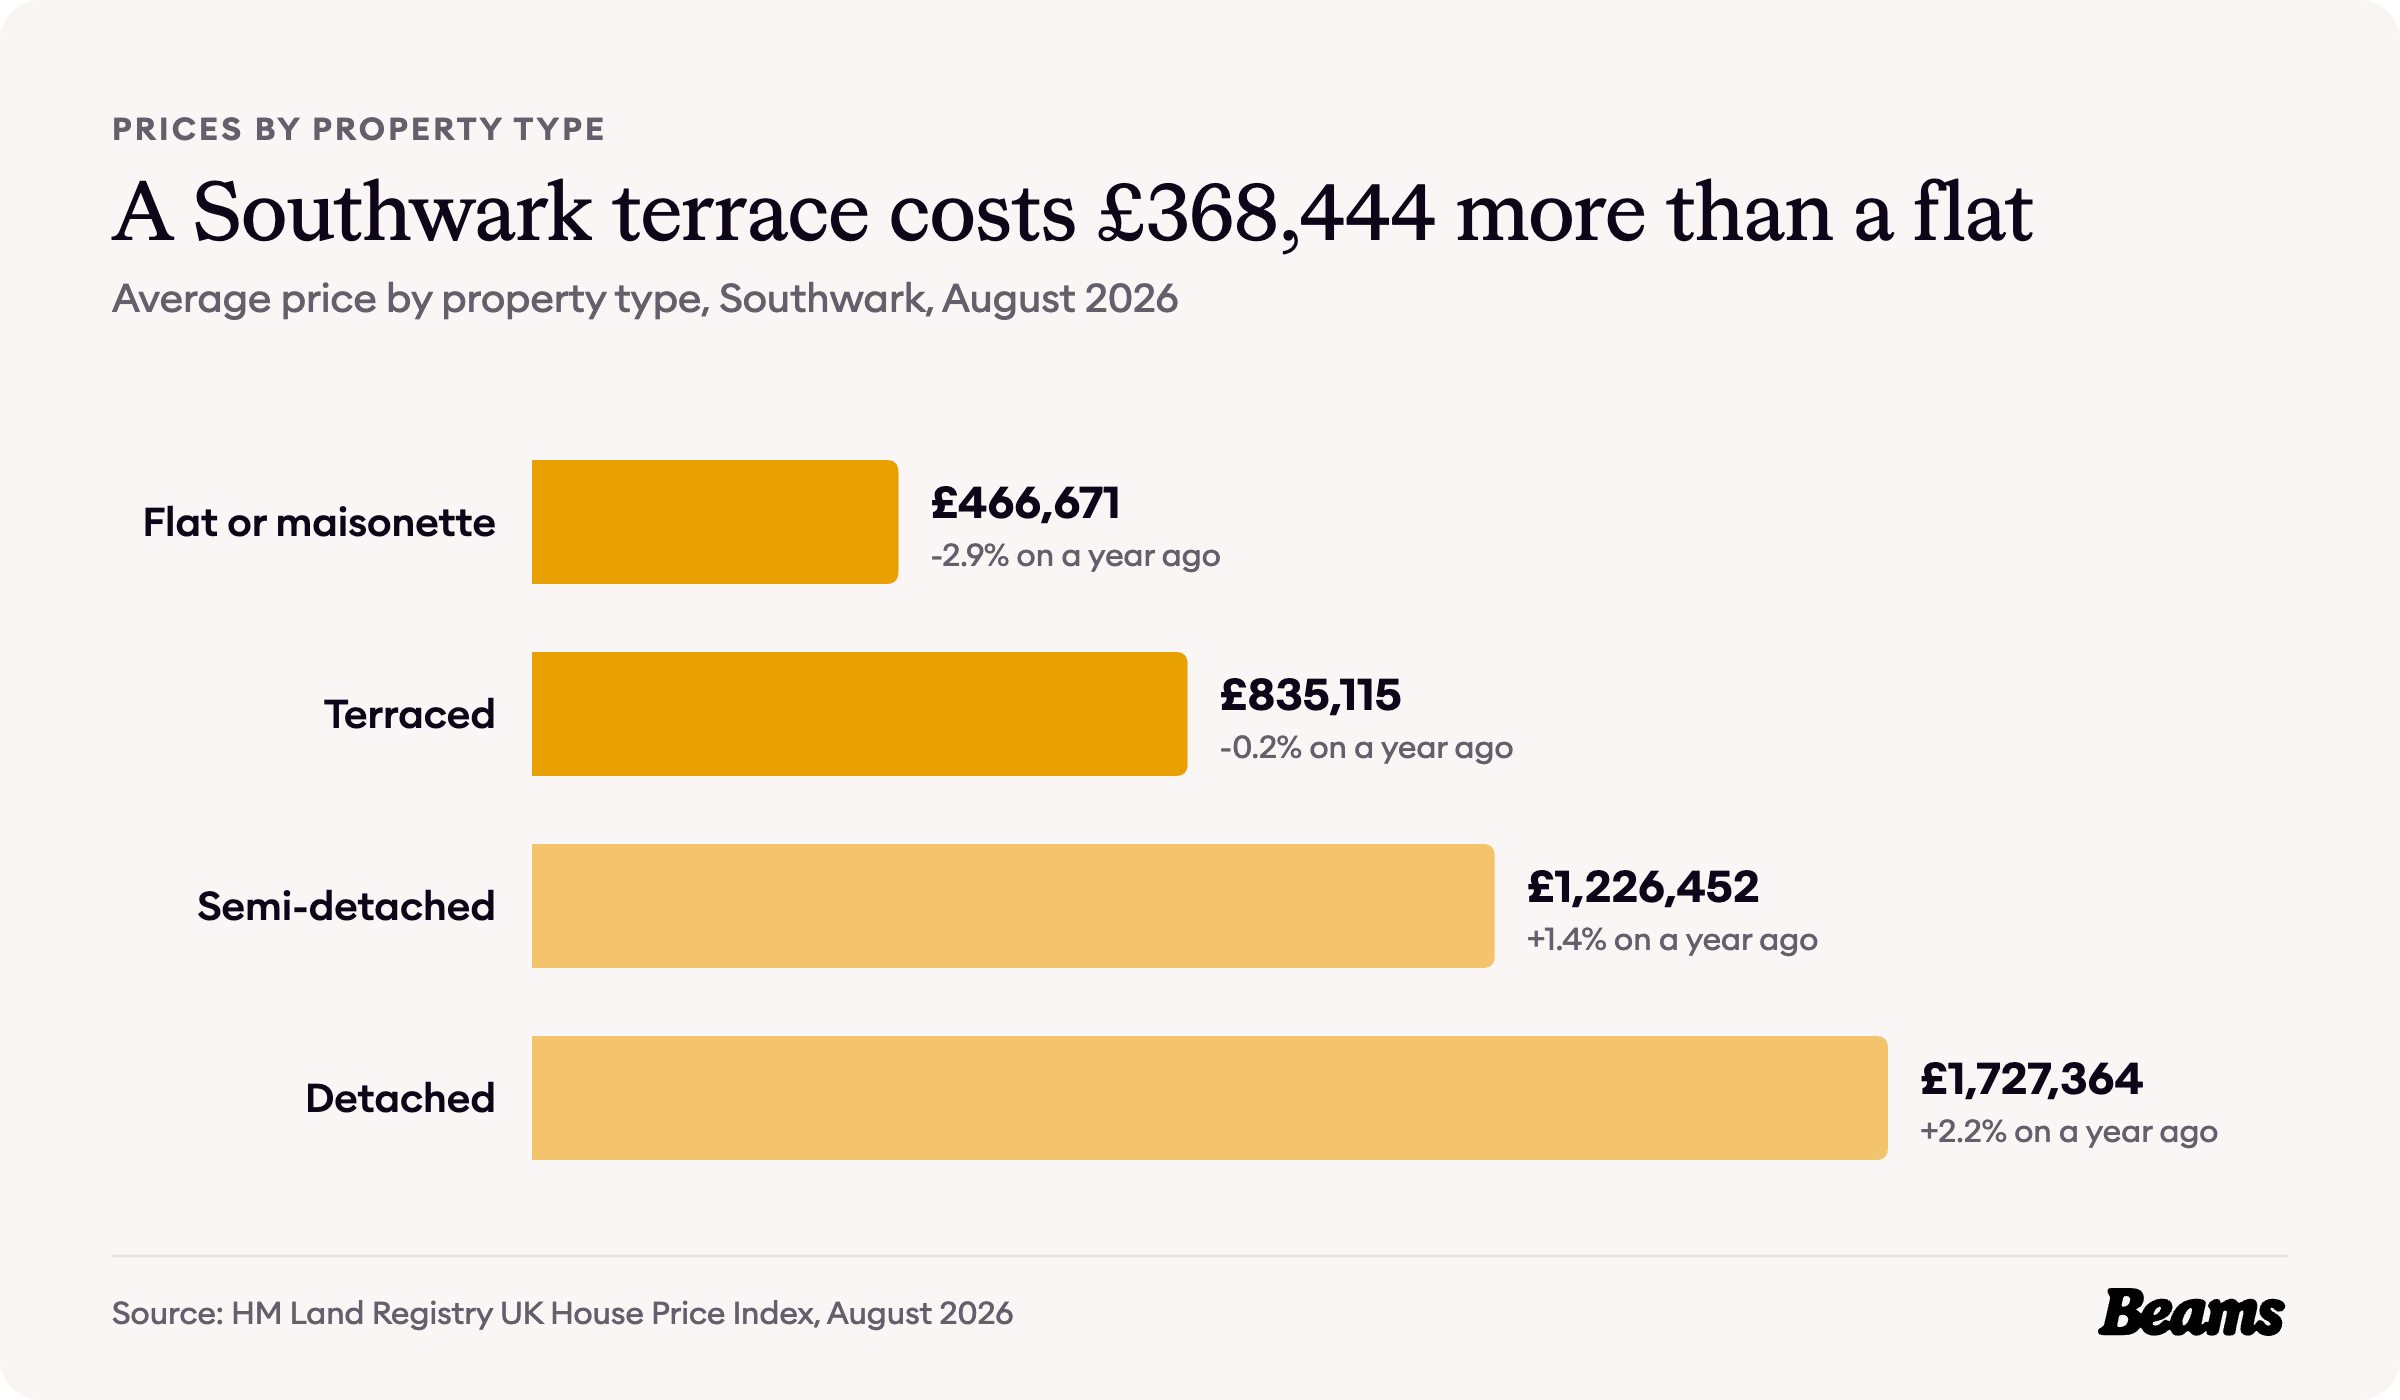
Across Southwark, a flat or maisonette averaged £466,671 in August 2026 and a terraced house £835,115, a gap of £368,444 [5]. Semi-detached homes averaged £1,226,452 and detached homes £1,727,364. First-time buyers paid an average of £497,815, while owners moving home paid £721,524 [5].
What homes sell for in SE22
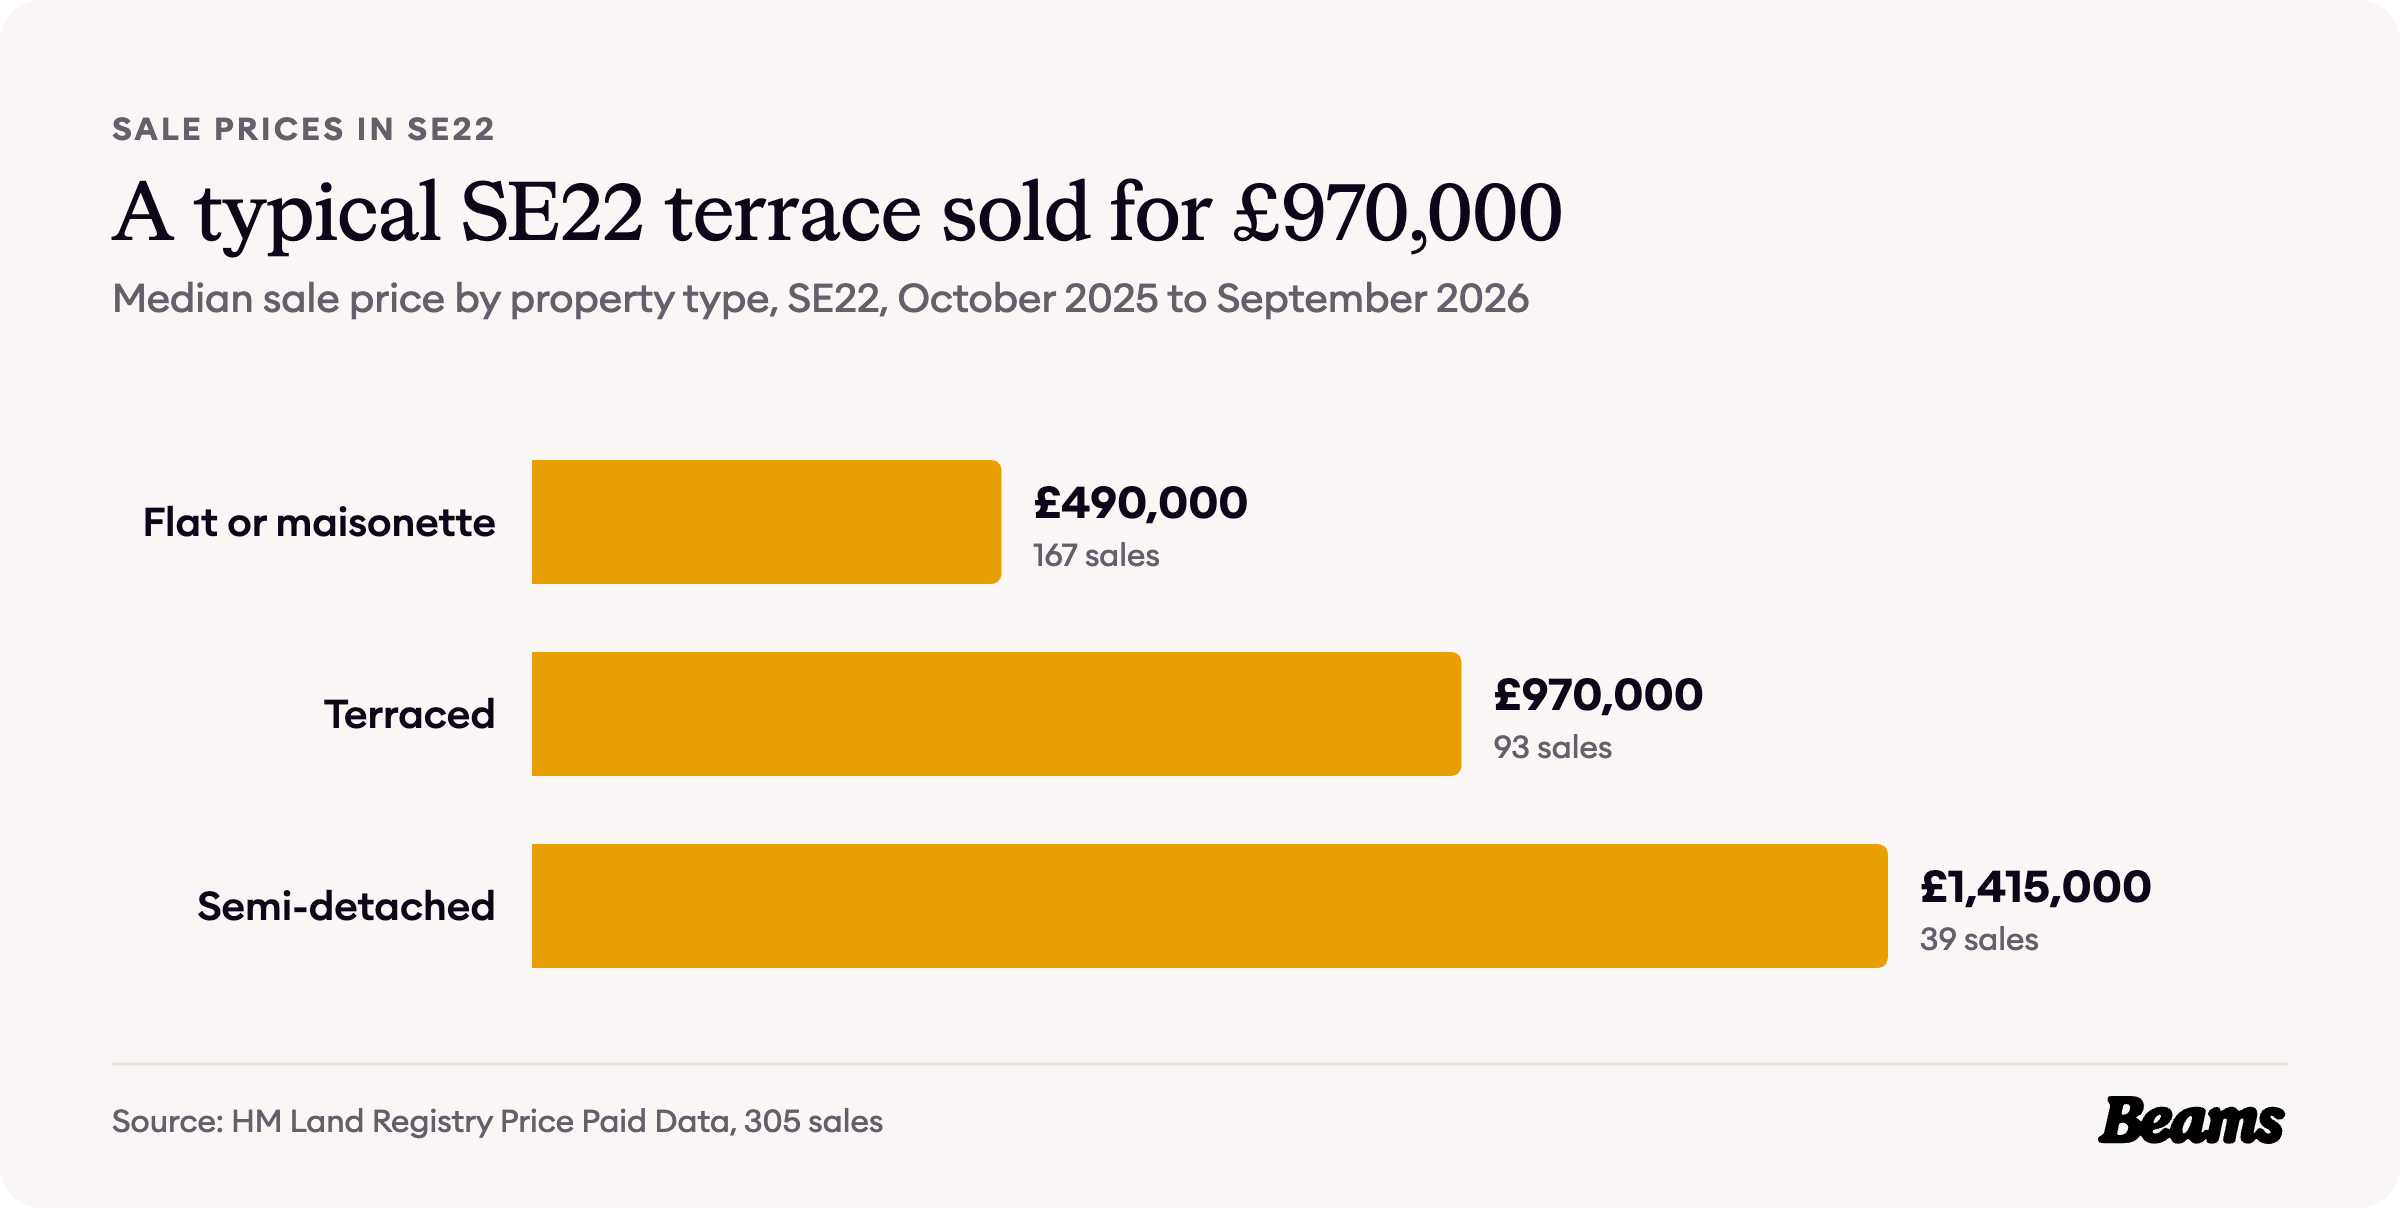
Sales in SE22 itself come in above those borough averages. In the twelve months from October 2025 to September 2026, Land Registry recorded 305 sales in the district at a median price of £677,000 [7].
Flats and maisonettes sold for a median of £490,000 across 167 sales, terraced houses for £970,000 across 93 sales and semi-detached houses for £1,415,000 across 39 sales [7]. That puts £480,000 between the typical flat and the typical terrace, and another £445,000 between a terrace and a semi. For a family already in a terrace, a house extension in East Dulwich adds room without paying that difference to move.
What it costs to rent
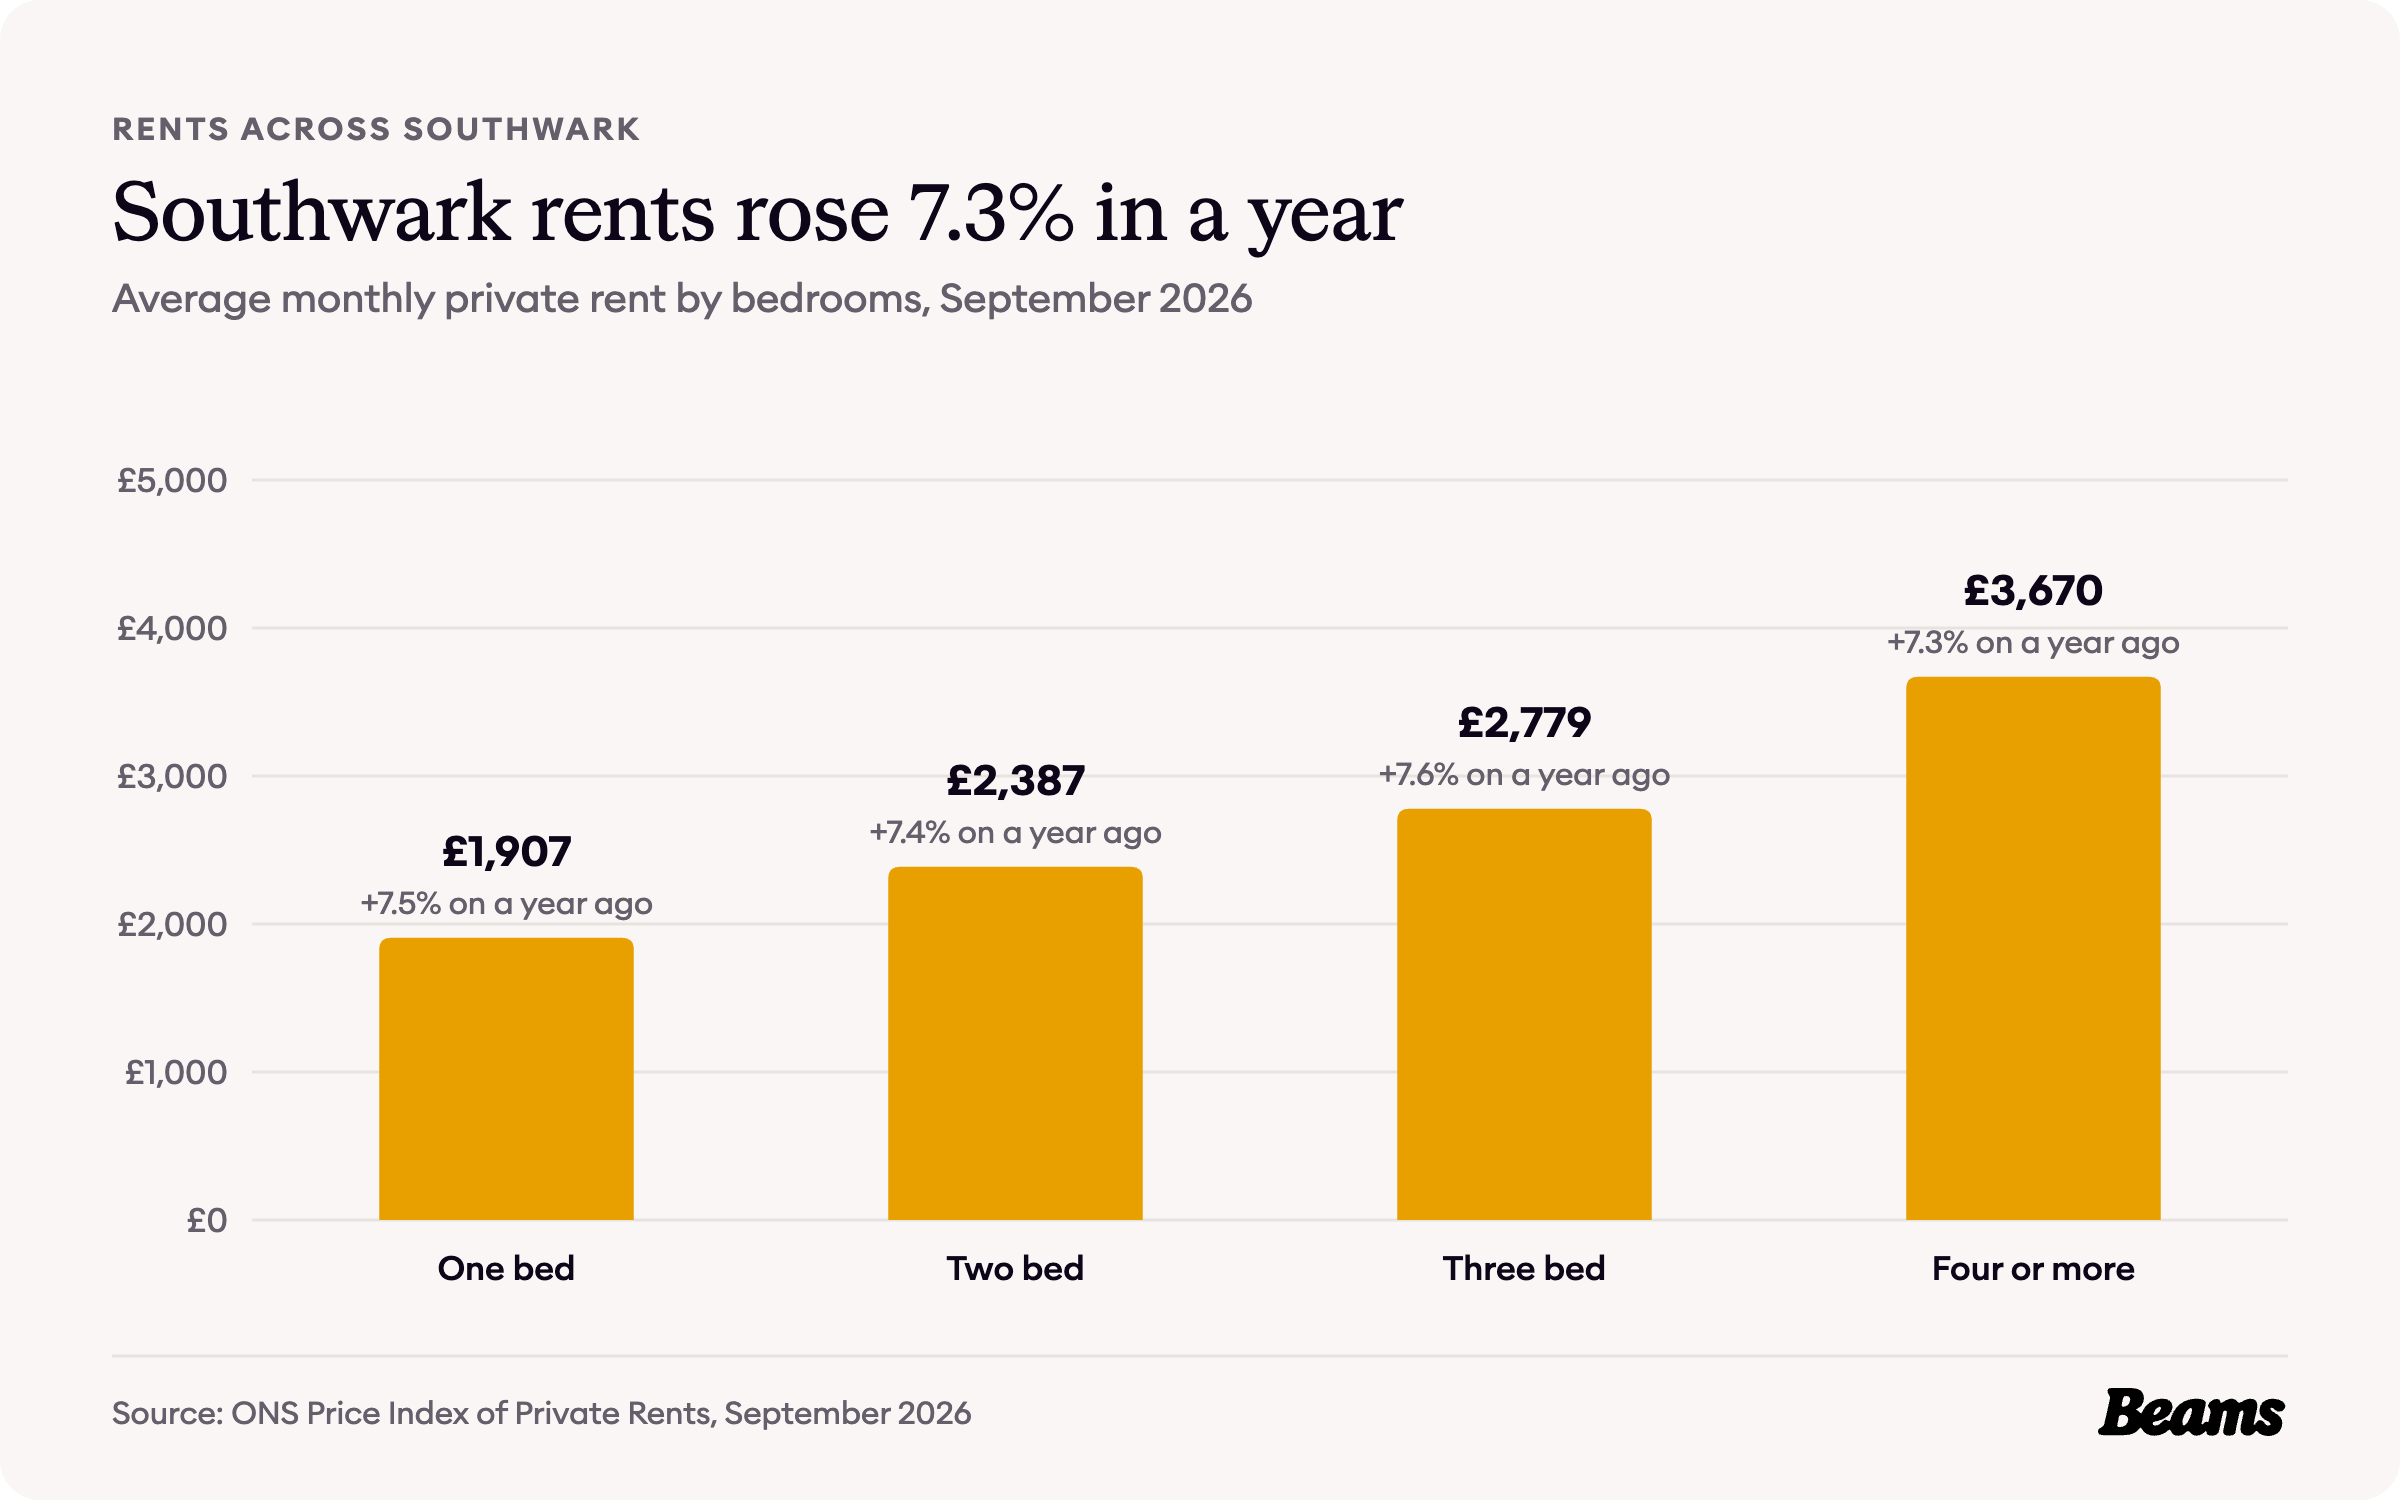
The average private rent in Southwark was £2,516 a month in September 2026, up 7.3% on a year earlier [5]. A one-bedroom home averaged £1,907 a month, a two-bedroom home £2,387 and a home with four or more bedrooms £3,670.
Almost a quarter of East Dulwich households rent privately, 23.9% at the last census [4]. At these rents landlords have every reason to keep homes in good order, and a dated bathroom is often the first thing a bathroom renovation in East Dulwich puts right between tenancies.
Council Tax in East Dulwich
Council Tax bands in England are based on what a home would have sold for on the open market on 1 April 1991 [8]. That is why the bands here look modest next to today's prices.
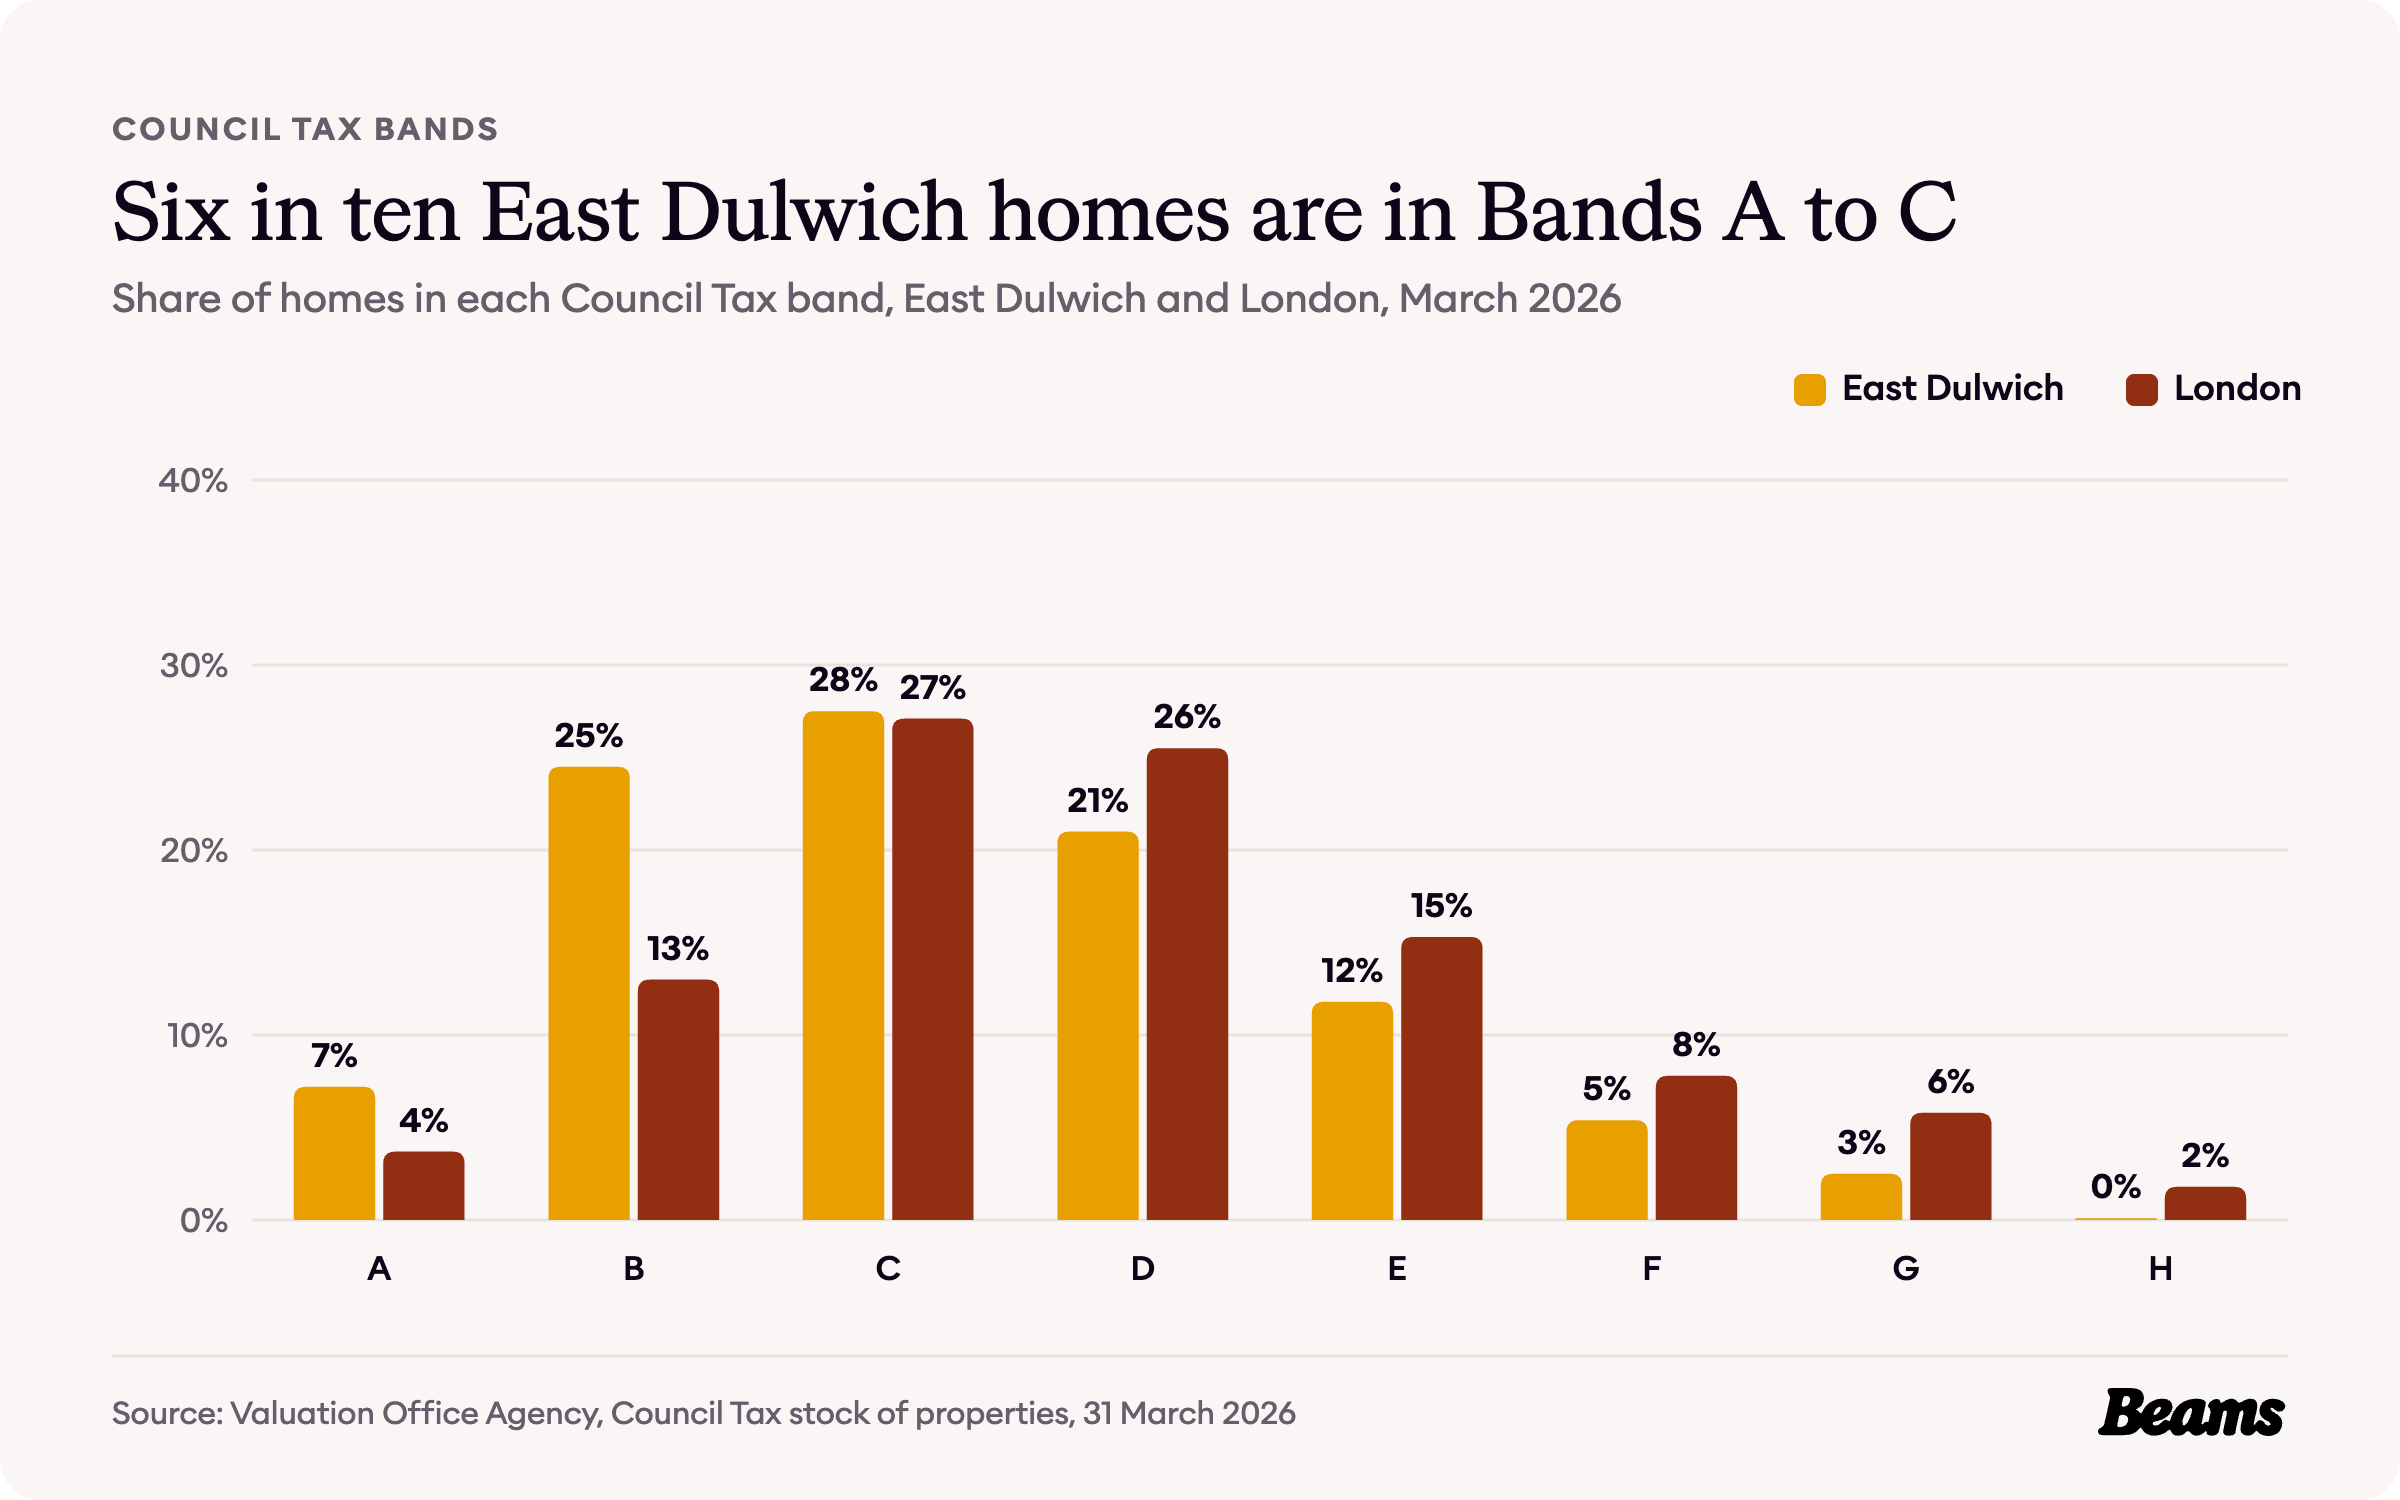
59.2% of homes in East Dulwich sit in Bands A to C, against 43.8% across London, and almost a quarter, 24.5%, are in Band B alone. Only 8.0% are in Band F or above, against 15.4% for London [2]. It is the pattern you would expect from a neighbourhood of converted flats and Victorian terraces.
The rules on your street
Southwark Council says the borough has 48 conservation areas, although the list on its website now names 53 [9] [10]. None of them is named after East Dulwich, but two sit on its edges. The Gardens, designated on 22 June 1988, is a square of houses around a central green on the west side of Peckham Rye Common, and also takes in Oakhurst Grove and Kelmore Grove. The council also names East Dulwich as one of the areas that loosely border the Dulwich Village conservation area [10].
In north Dulwich, the Sunray Estate is a small garden suburb of cottage housing built between 1920 and 1922. It is covered by an Article 4 direction confirmed on 13 November 1987, so some external alterations that would otherwise be permitted development need planning permission [10].
When you apply, Southwark Council sends an application number and an estimated date by which it aims to decide, either 8, 13 or 16 weeks later depending on the type of application. Most decisions are made by senior officers, with more complex or controversial cases going to a planning committee [11]. With almost half the homes here built before 1900, check the council's map for your street before anyone starts drawing. Builders in East Dulwich matched through Beams are vetted and quote against the same specification, on a fixed-price contract.
East Dulwich housing statistics at a glance
- Median sale price, SE22, October 2025 to September 2026: £677,000 [7]
- Average house price, Southwark, August 2026: £569,160 (London £554,430) [5] [6]
- Change on a year earlier: -2.1% (London -2.2%) [5] [6]
- Average flat or maisonette, Southwark: £466,671 (London £427,310) [5] [6]
- Average terraced house, Southwark: £835,115 (London £648,650) [5] [6]
- Average private rent, Southwark, September 2026: £2,516 a month [5]
- Homes built before 1900: 48.1% (London 20.8%) [2]
- Households living in a converted flat: 21.1% (London 11.1%) [3]
- Households who own their home: 48.0% (London 45.2%) [4]
- Homes in Council Tax Bands A to C: 59.2% (London 43.8%) [2]
Frequently asked questions
References
- University of Greenwich, Ideal Homes: History of East Dulwich. How Friern Manor Farm and the Bower-Smith estate were developed between 1865 and 1885.
- Valuation Office Agency, Council Tax: stock of properties 2026. Properties by build period and Council Tax band at 31 March 2026, for the North Dulwich, East Dulwich and Dulwich Hill small areas.
- ONS, Census 2021 table TS044: Accommodation type. Households by type of home, East Dulwich small areas and London.
- ONS, Census 2021 table TS054: Tenure. Households by tenure, East Dulwich small areas and London.
- ONS, Housing prices in Southwark. UK House Price Index for August 2026 and Price Index of Private Rents for September 2026, published 21 October 2026.
- HM Land Registry, UK House Price Index. Average prices for Southwark, London and England, August 2006 to August 2026.
- HM Land Registry, Price Paid Data. Sales in the SE22 postcode district, October 2025 to September 2026.
- GOV.UK, Understand how Council Tax bands are assessed. Bands in England are based on values at 1 April 1991. Accessed 29 October 2026.
- Southwark Council, Conservation areas. Overview, including the number of conservation areas. Accessed 29 October 2026.
- Southwark Council, List of conservation areas. The Gardens, Dulwich Village and Sunray Estate entries. Accessed 29 October 2026.
- Southwark Council, After submitting your planning application. Target decision dates and who decides. Accessed 29 October 2026.
Thinking of improving rather than moving?
Tell us about your East Dulwich home and what you want to change. We'll give you a free estimate, then up to three vetted builders quote against the same specification.