
Clapton housing statistics 2026
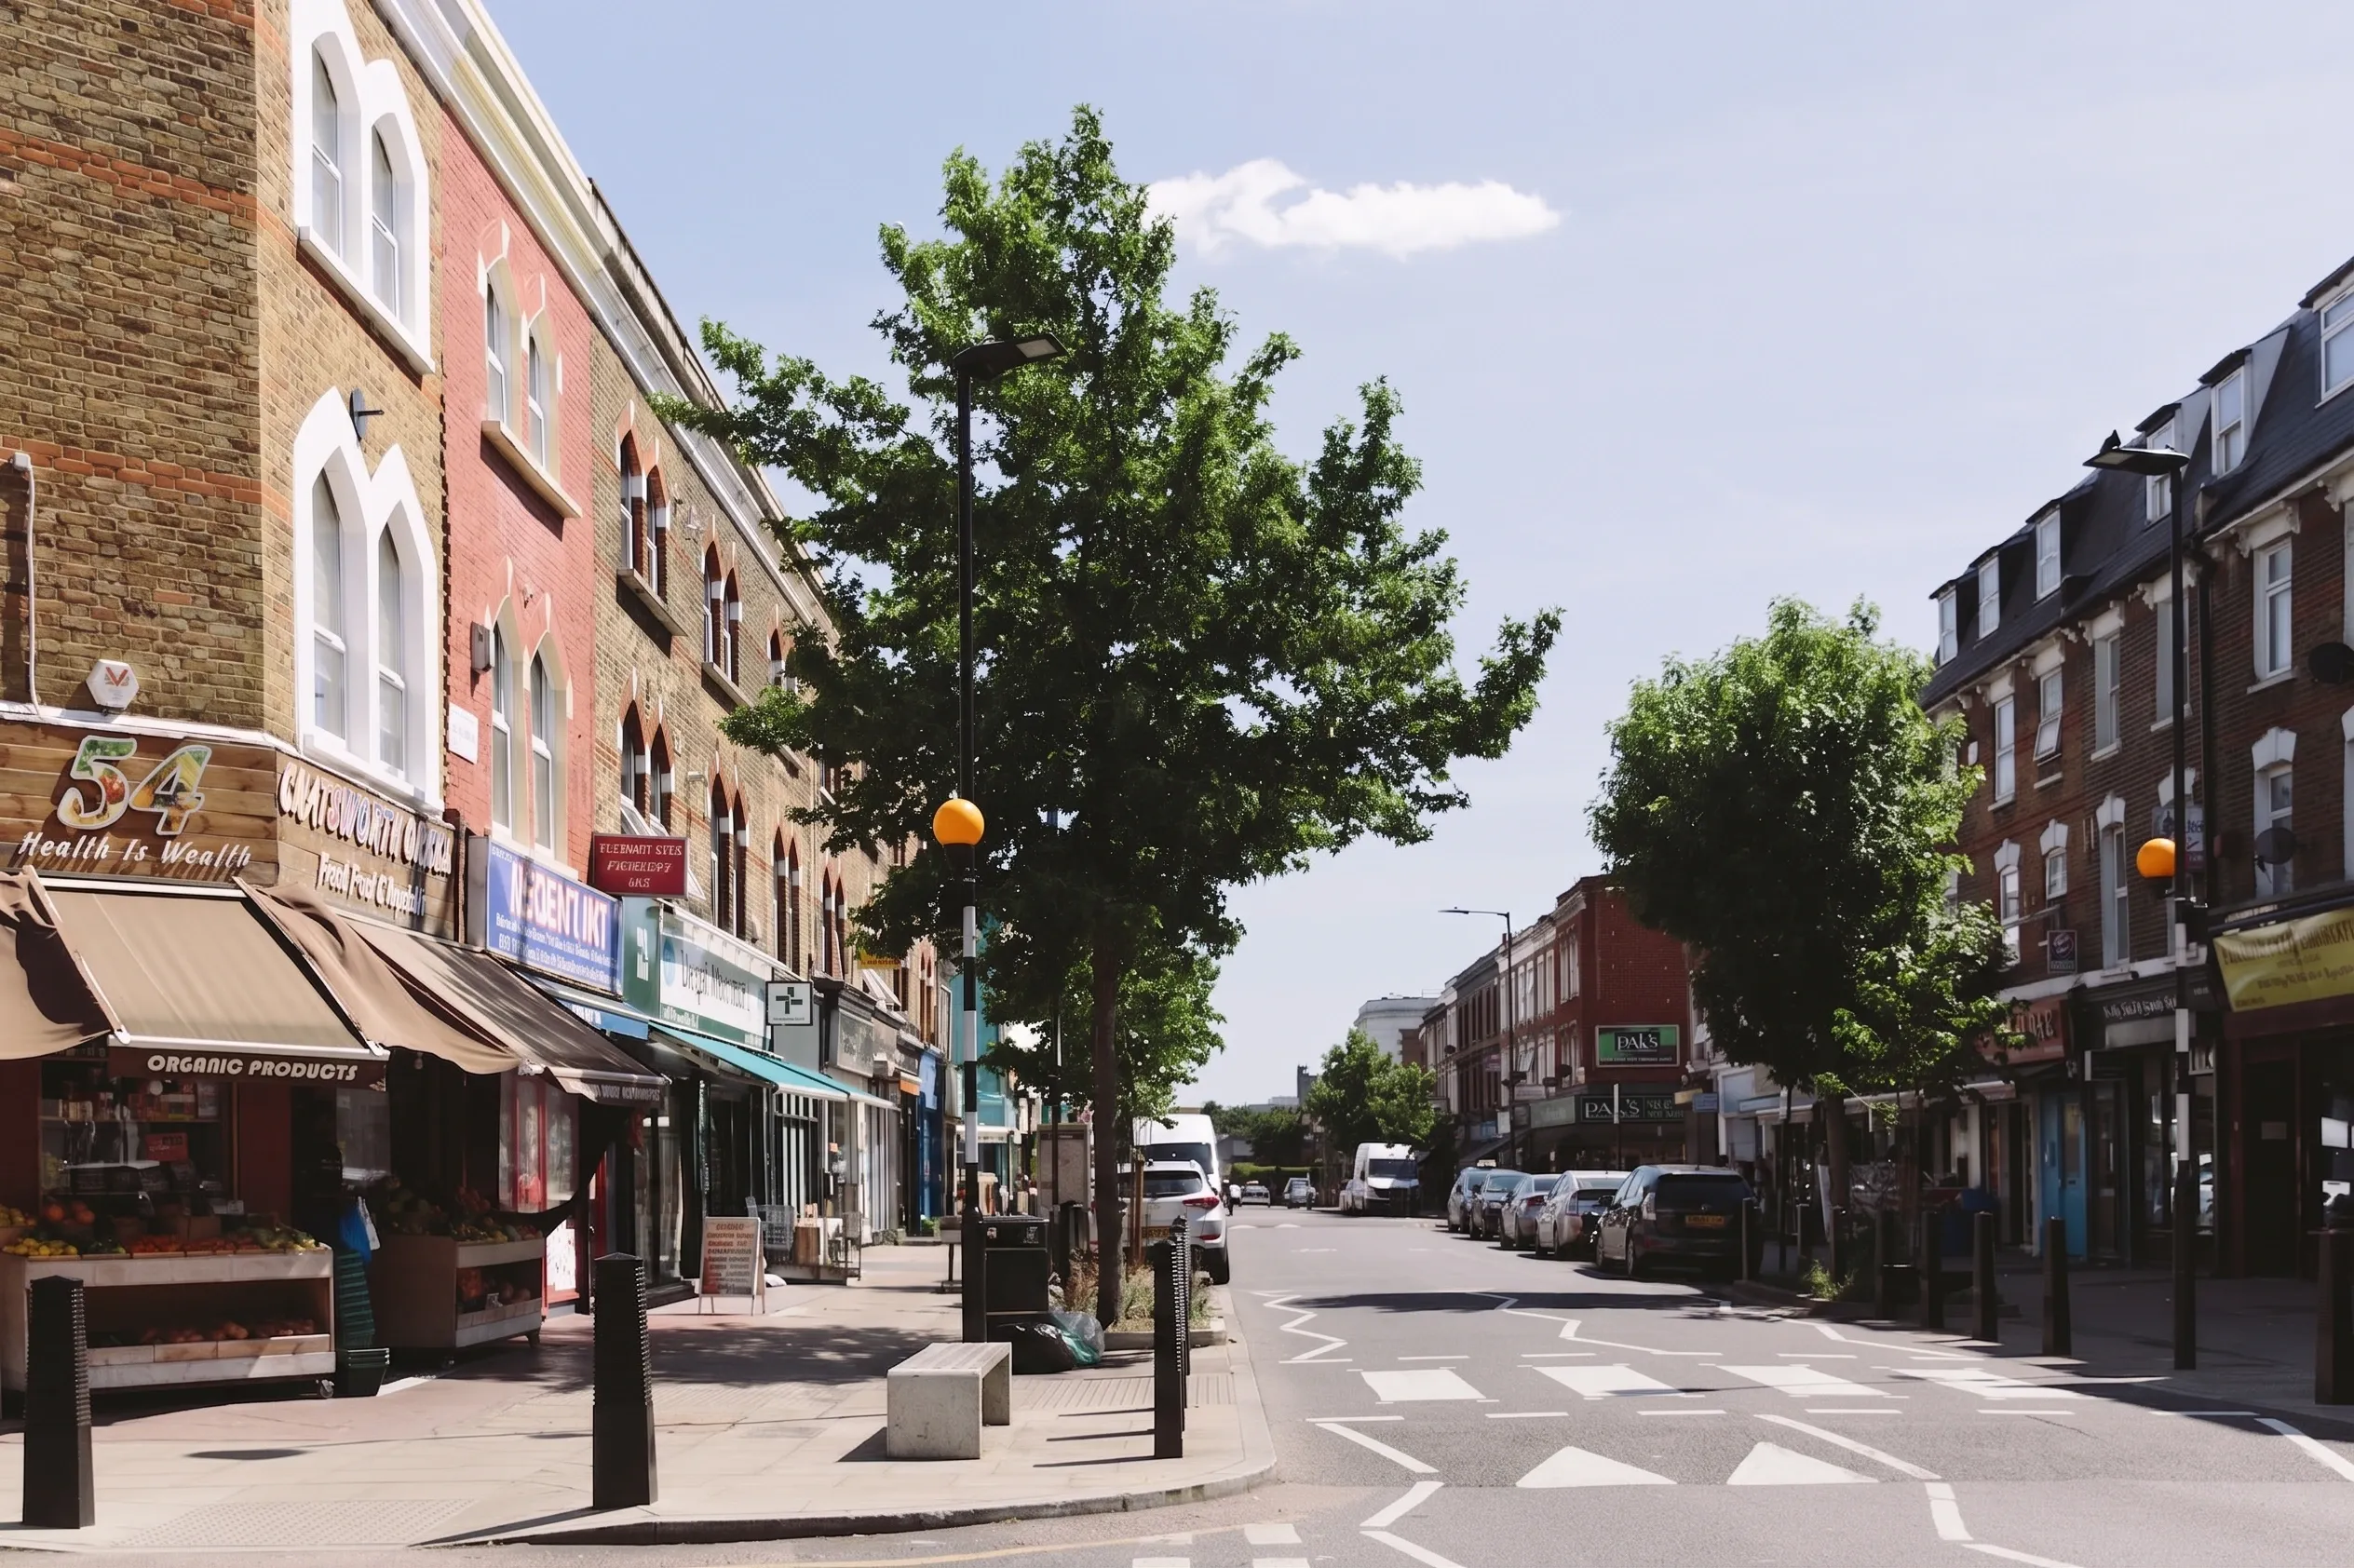
Clapton was built in layers: a Georgian square in 1816, streets of Victorian terraces around Chatsworth Road from the late 1860s, then, in 1938, the London County Council's largest estate in the borough. These are the numbers behind that story, from the oldest terraces to today's £600,000 median sale price in E5.
Every figure comes from an official source and is dated, so you can see exactly what you are working with before you plan a home renovation in Clapton. The sources are numbered in brackets and listed in full at the end of the page.
How Clapton was built
Clapton Square was laid out in 1816, on land north of Hackney village [1]. Half a century later the London & Suburban Land Company laid out Chatsworth Road along a field path, between about 1867 and 1870, and filled the land between it and Lower Clapton Road with new streets such as Clifden Road and Glenarm Road [1].
Council flats followed between the wars. Powell House opened with 198 flats in 1934, and in 1938 Northwold, with 459 flats, was the London County Council's largest estate in the borough. After the war the Greater London Council built the Nightingale estate, with towers of up to 21 storeys, between 1967 and 1972 [1].
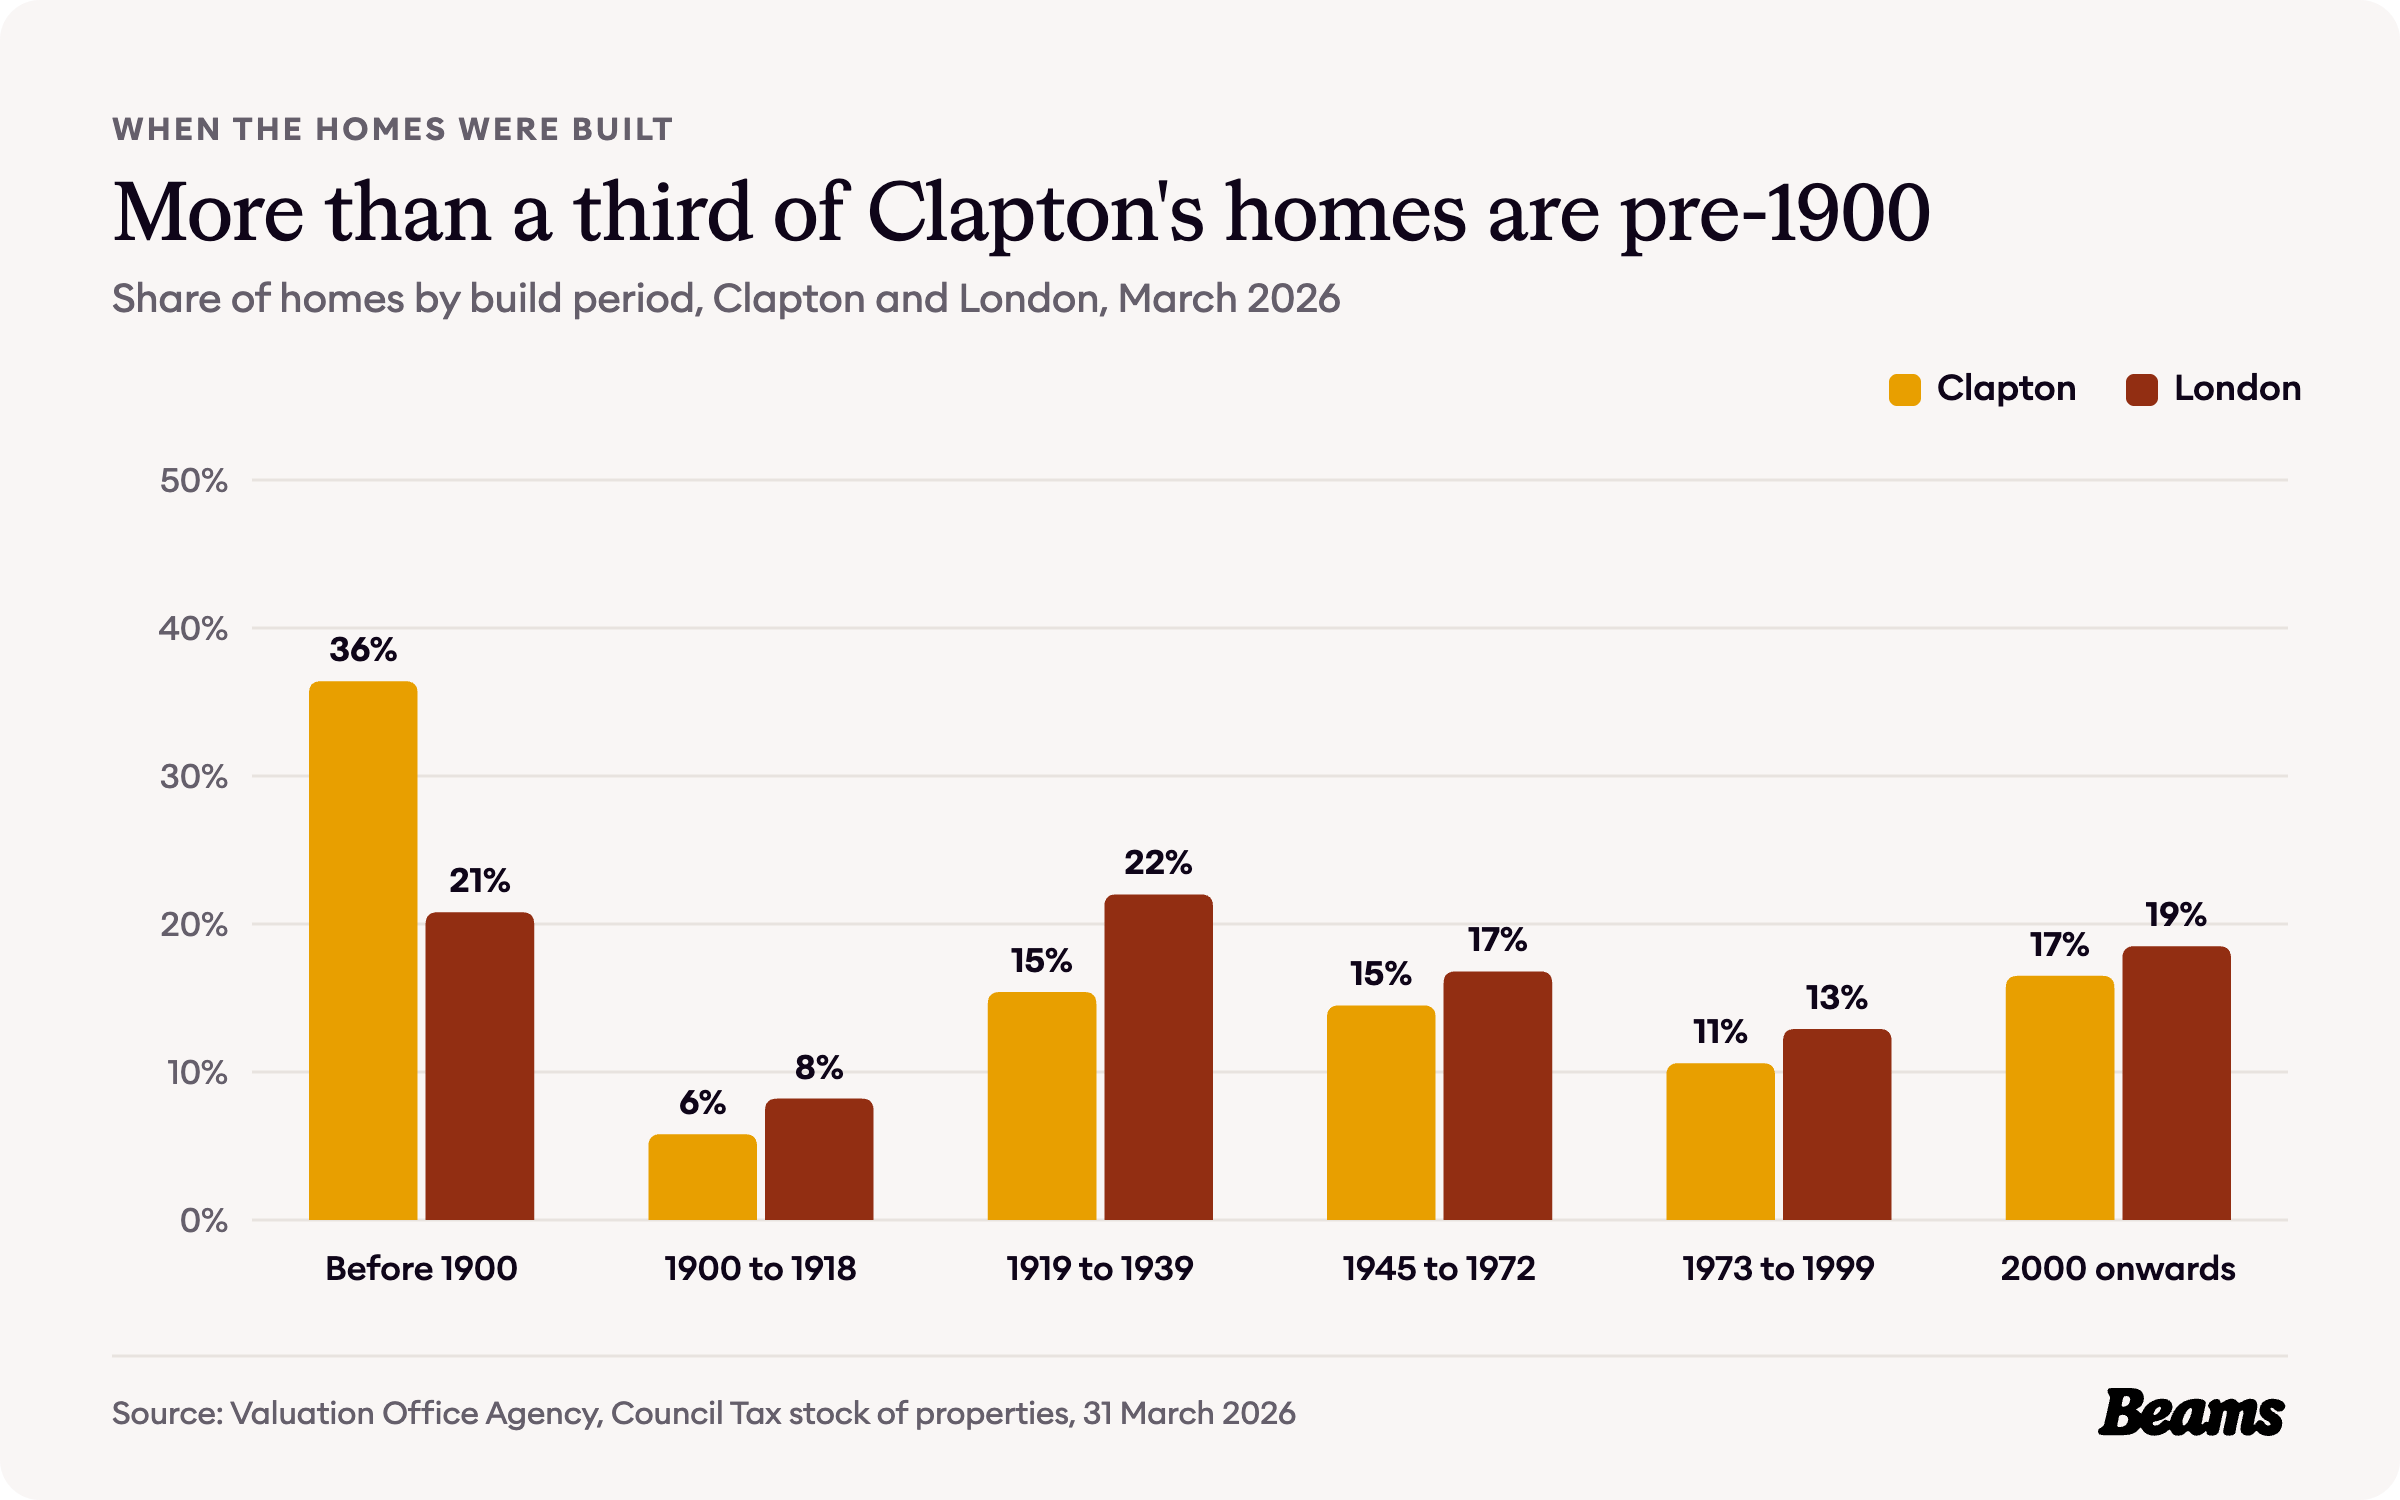
Those layers still show. The Valuation Office Agency counts 9,910 homes across Clapton's three census areas, Lower Clapton, Upper Clapton and Clapton Leaside, and 36.4% of them were built before 1900, against 20.8% across London. Add the 5.8% built from 1900 to 1918 and 42.2% of Clapton's homes are older than 1919, against 29.0% for London [2].
The inter-war layer is there too, at 15.4% of homes, though below London's 22.0%. Post-war building accounts for 14.5% and homes built since 2000 for 16.5% [2]. With more than a third of homes dating from before 1900, many of them terraces with pitched roofs, a loft conversion in Clapton is often the simplest way to add a bedroom.
How Clapton households live
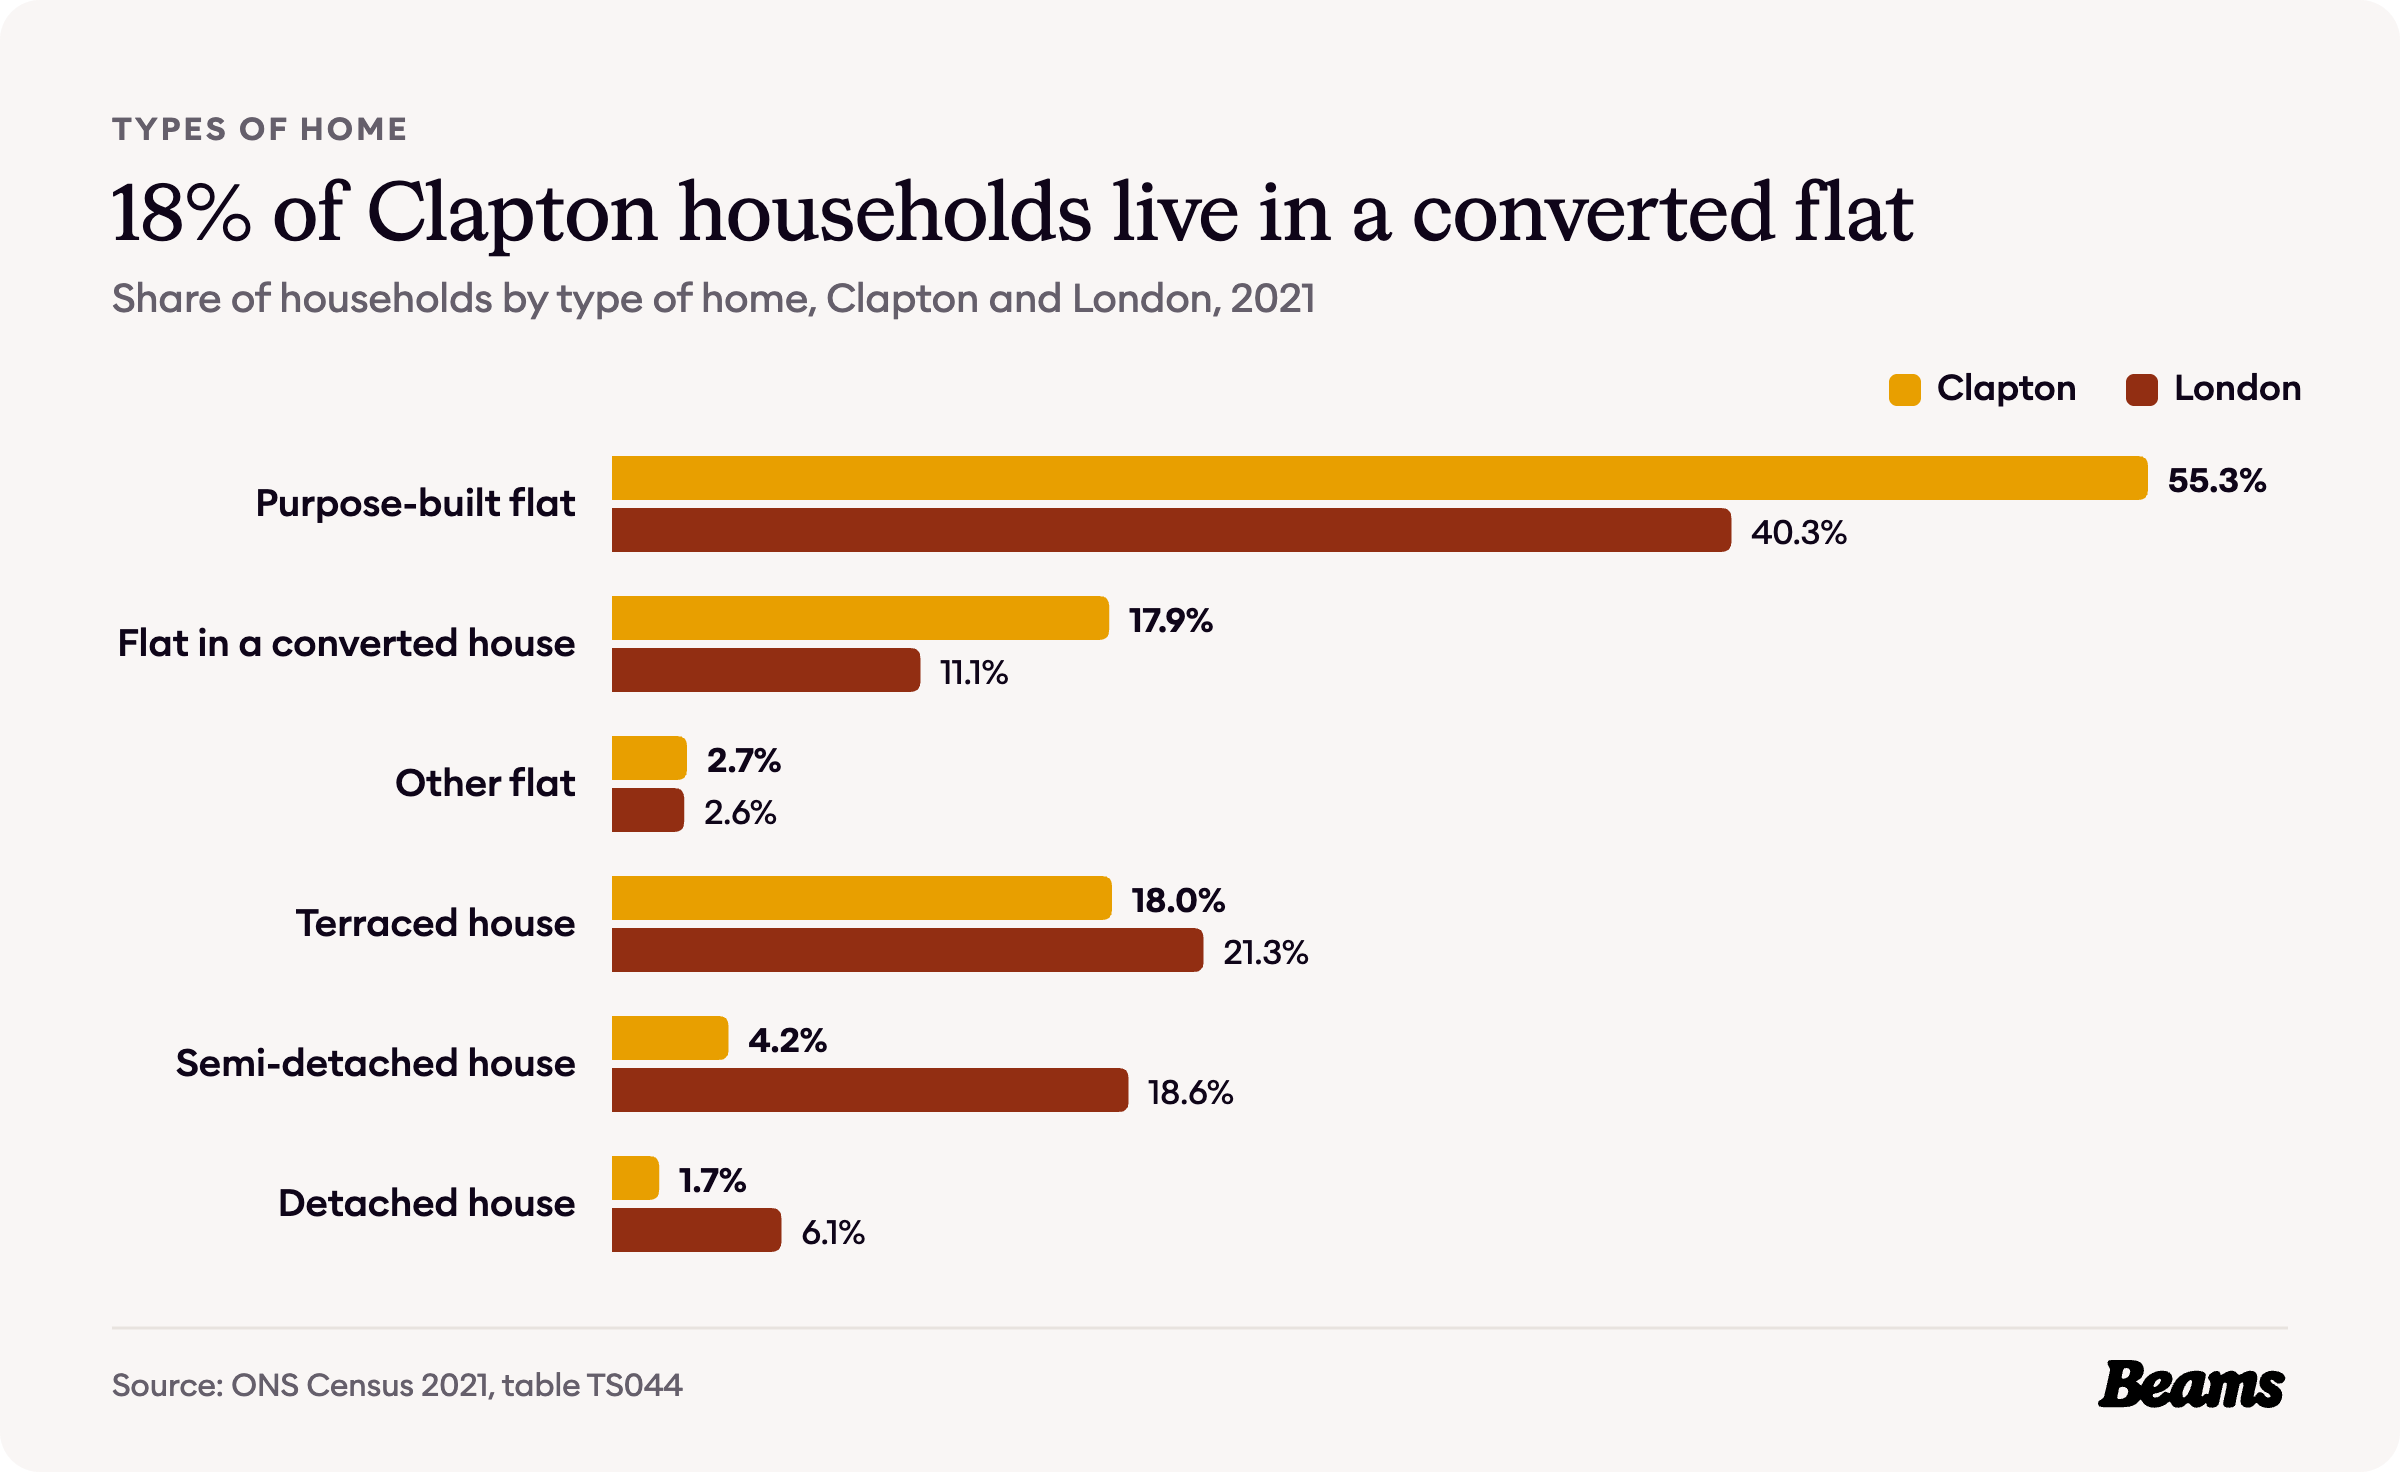
The 2021 Census counted 9,064 households in Clapton. Of these, 55.3% live in a purpose-built flat, against 40.3% across London, and 17.9% live in a flat inside a converted house, against 11.1% [3].
That converted share is a Clapton signature: nearly one household in five lives in a house that has been split into flats. Only 18.0% live in a terraced house, and 5.9% in a semi-detached or detached one [3]. In a converted flat the kitchen often sits in what was once a back room, so a kitchen renovation in Clapton usually starts with the layout.
Who owns Clapton's homes
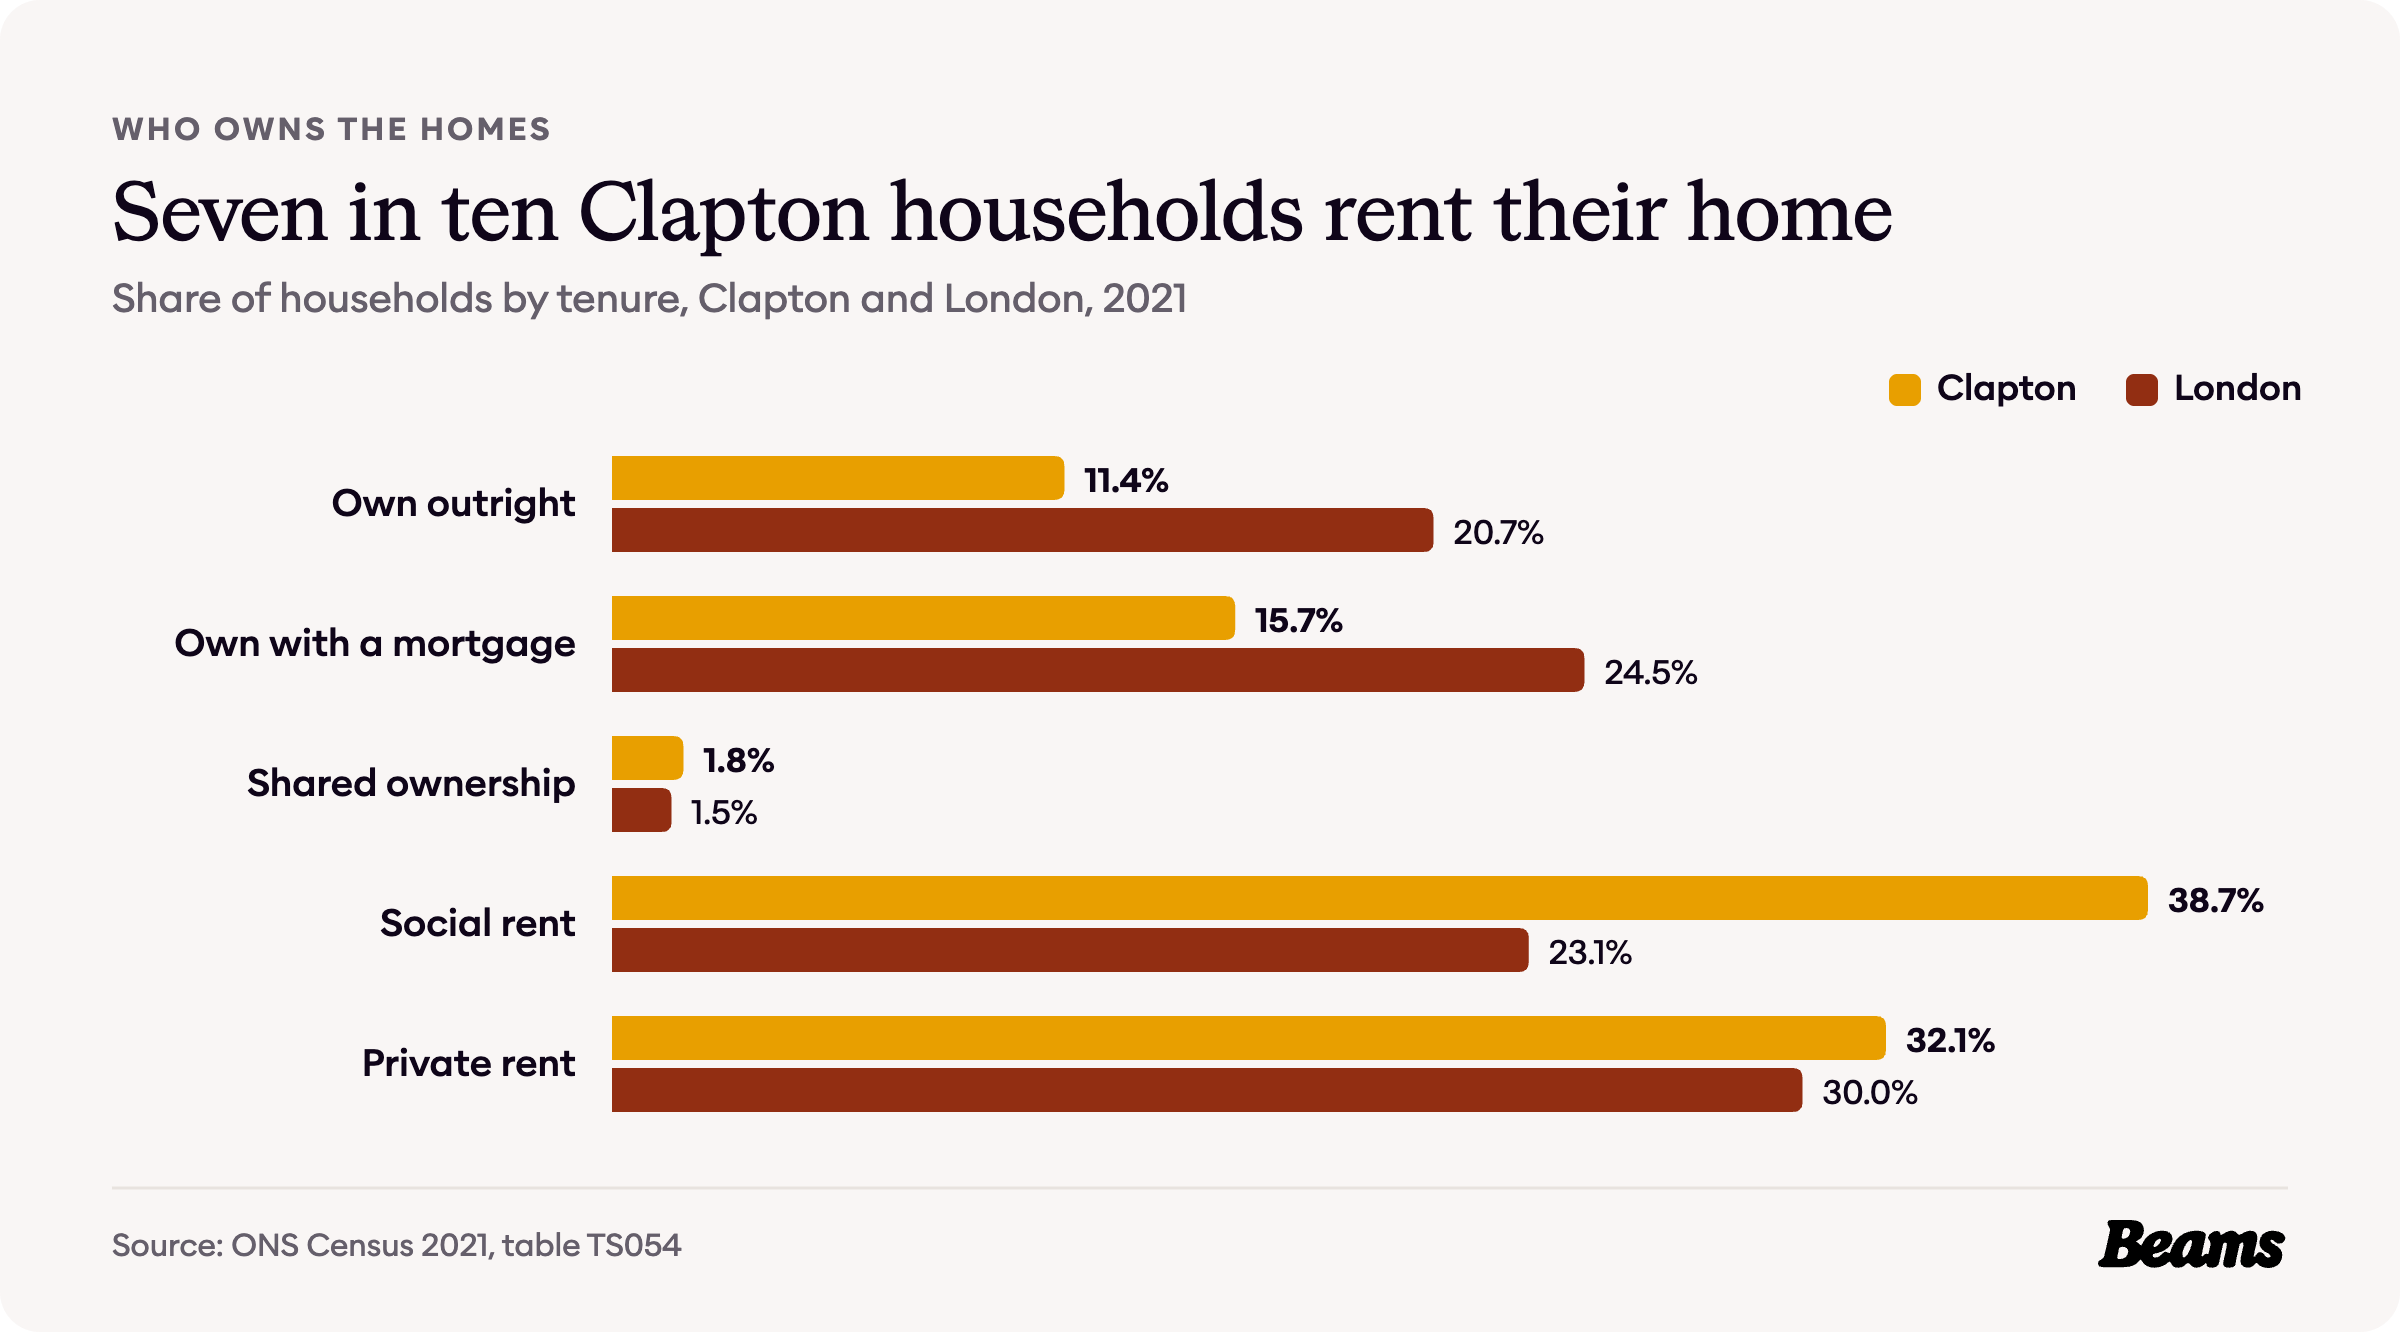
Just over a quarter of Clapton households, 27.1%, own their home: 11.4% outright and 15.7% with a mortgage. Across London the figure is 45.2% [4].
Social renting accounts for 38.7% of households, against 23.1% for London, and private renting for 32.1%, against 30.0% [4]. Between them, renters make up 70.8% of Clapton households.
What a home costs in Clapton
Official price and rent indexes stop at borough level, so the UK House Price Index and rent figures on this page cover the whole of Hackney. The census and Valuation Office figures cover Clapton's three census areas, Lower Clapton, Upper Clapton and Clapton Leaside, and the local sale prices cover the E5 postcode district.
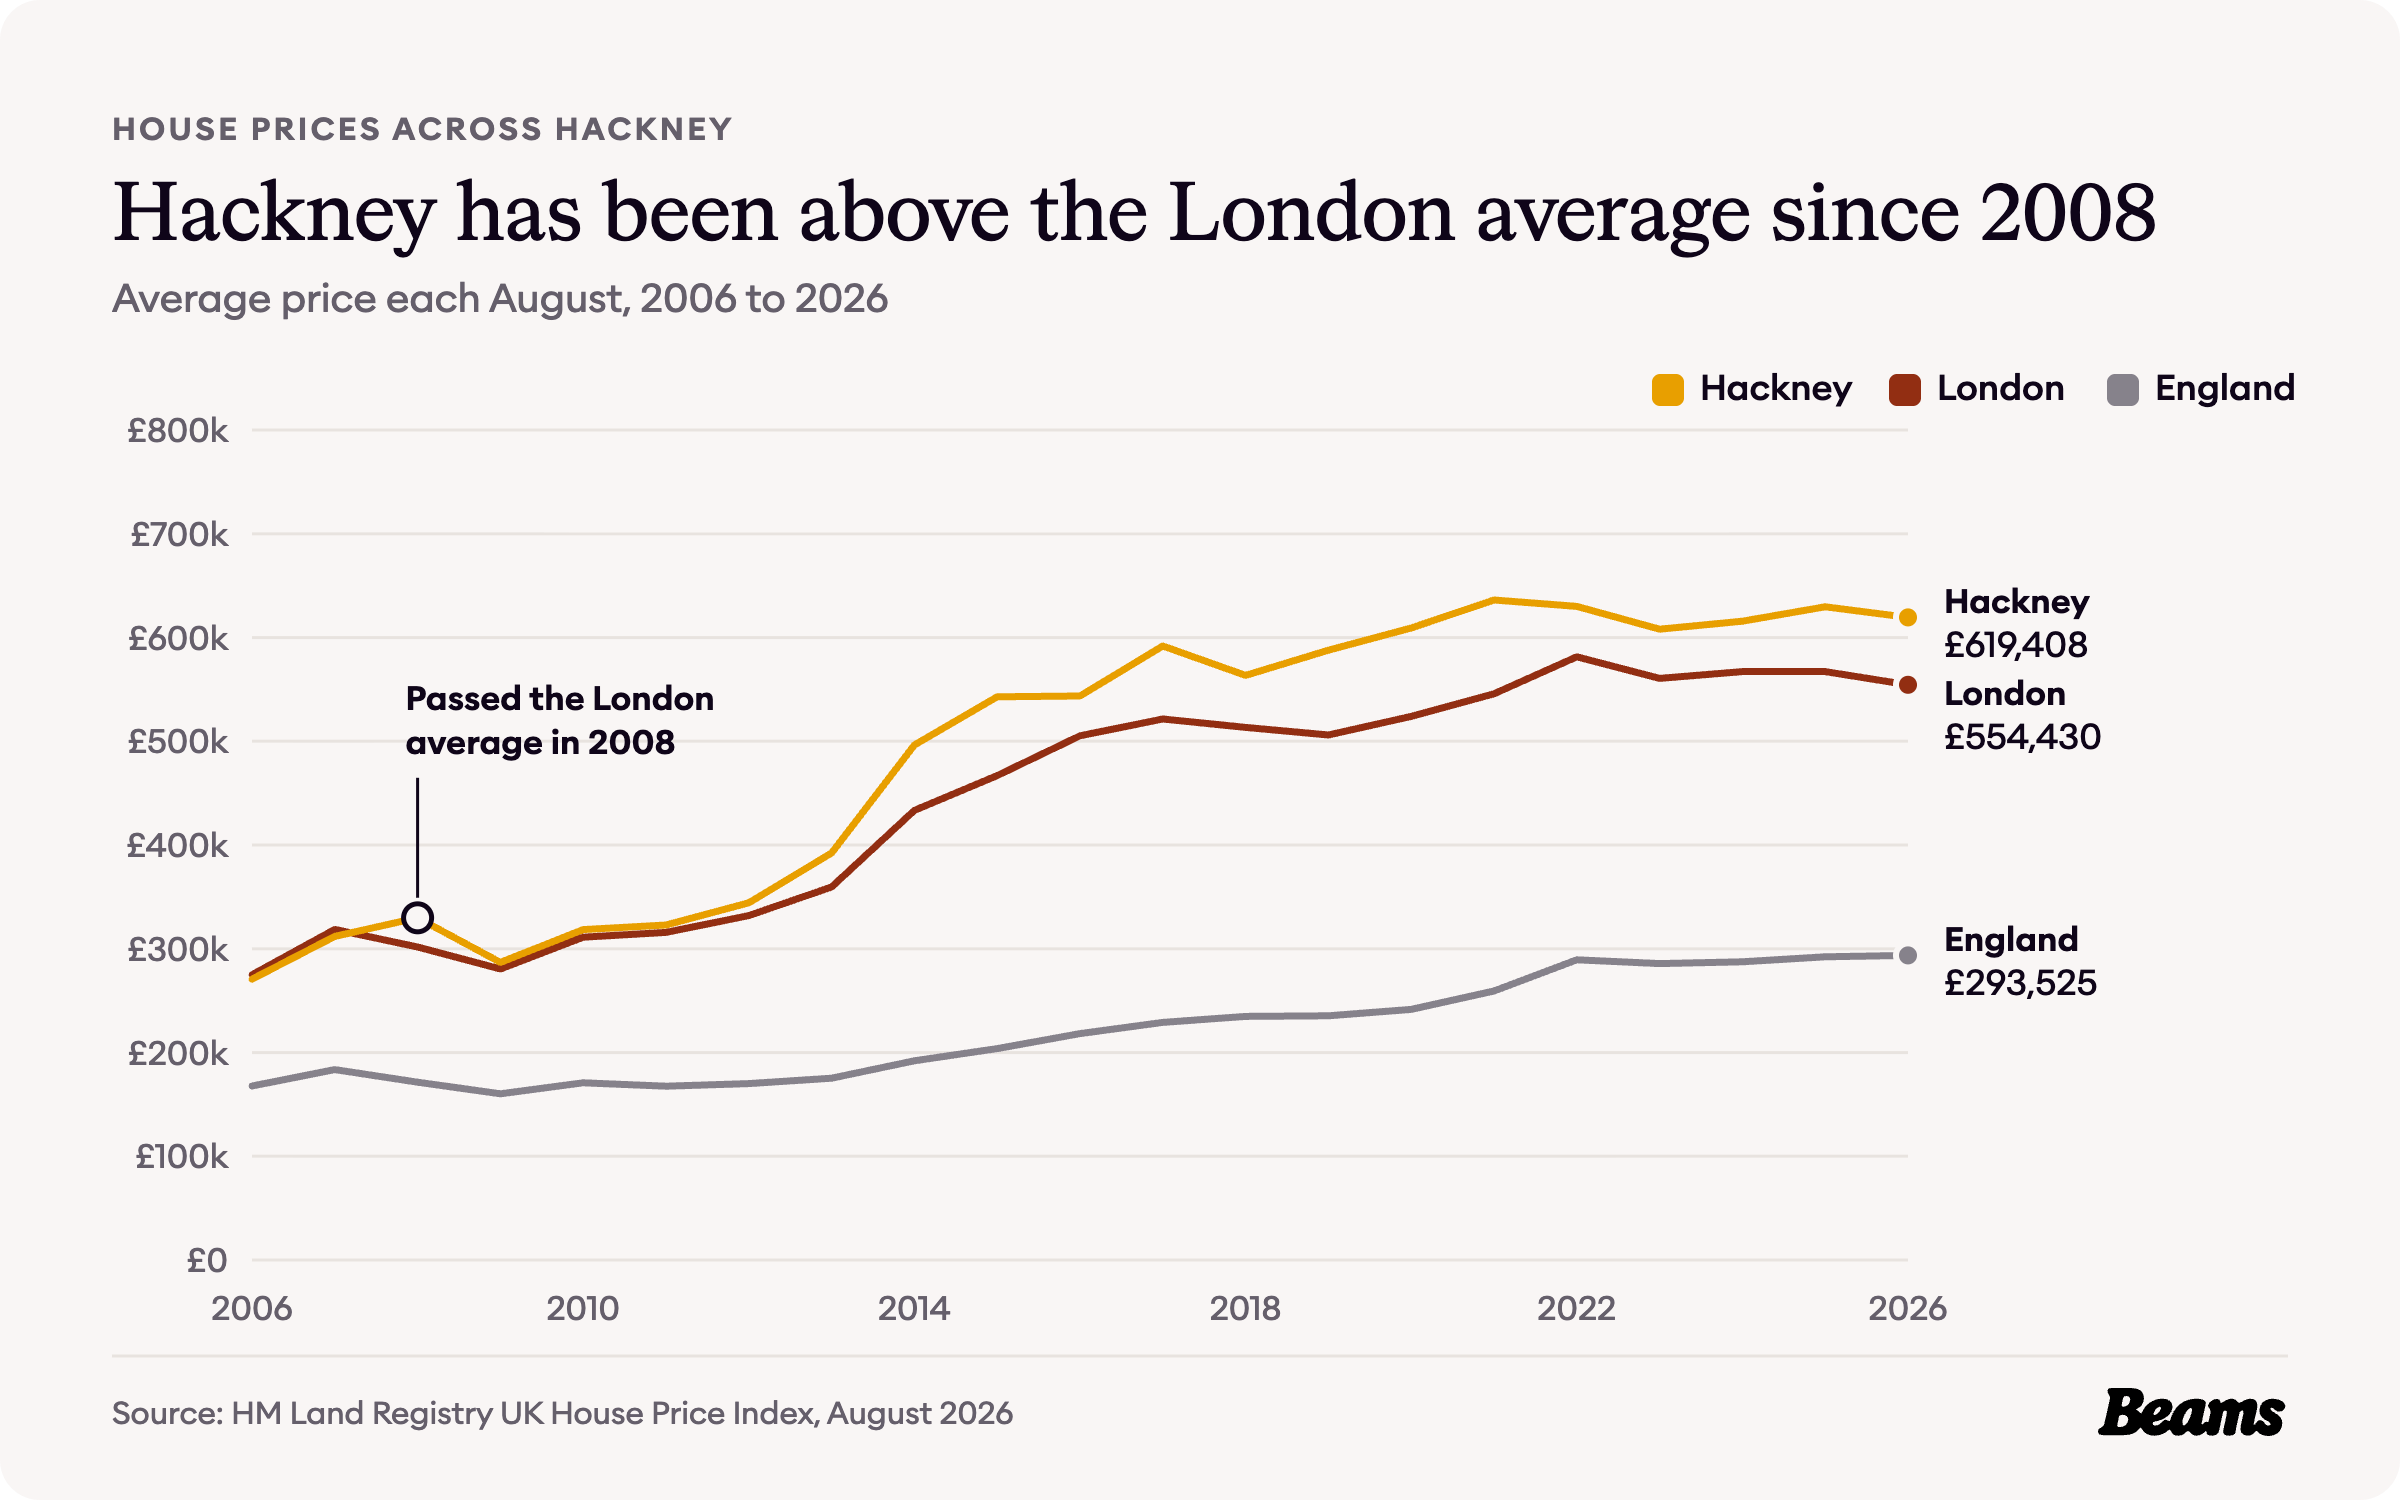
Across Hackney the average home cost £619,408 in August 2026, down 1.6% on a year earlier [5]. That compares with £554,430 for London and £293,525 for England, and the borough has been above the London average every August since 2008 [6].
Sale prices in E5
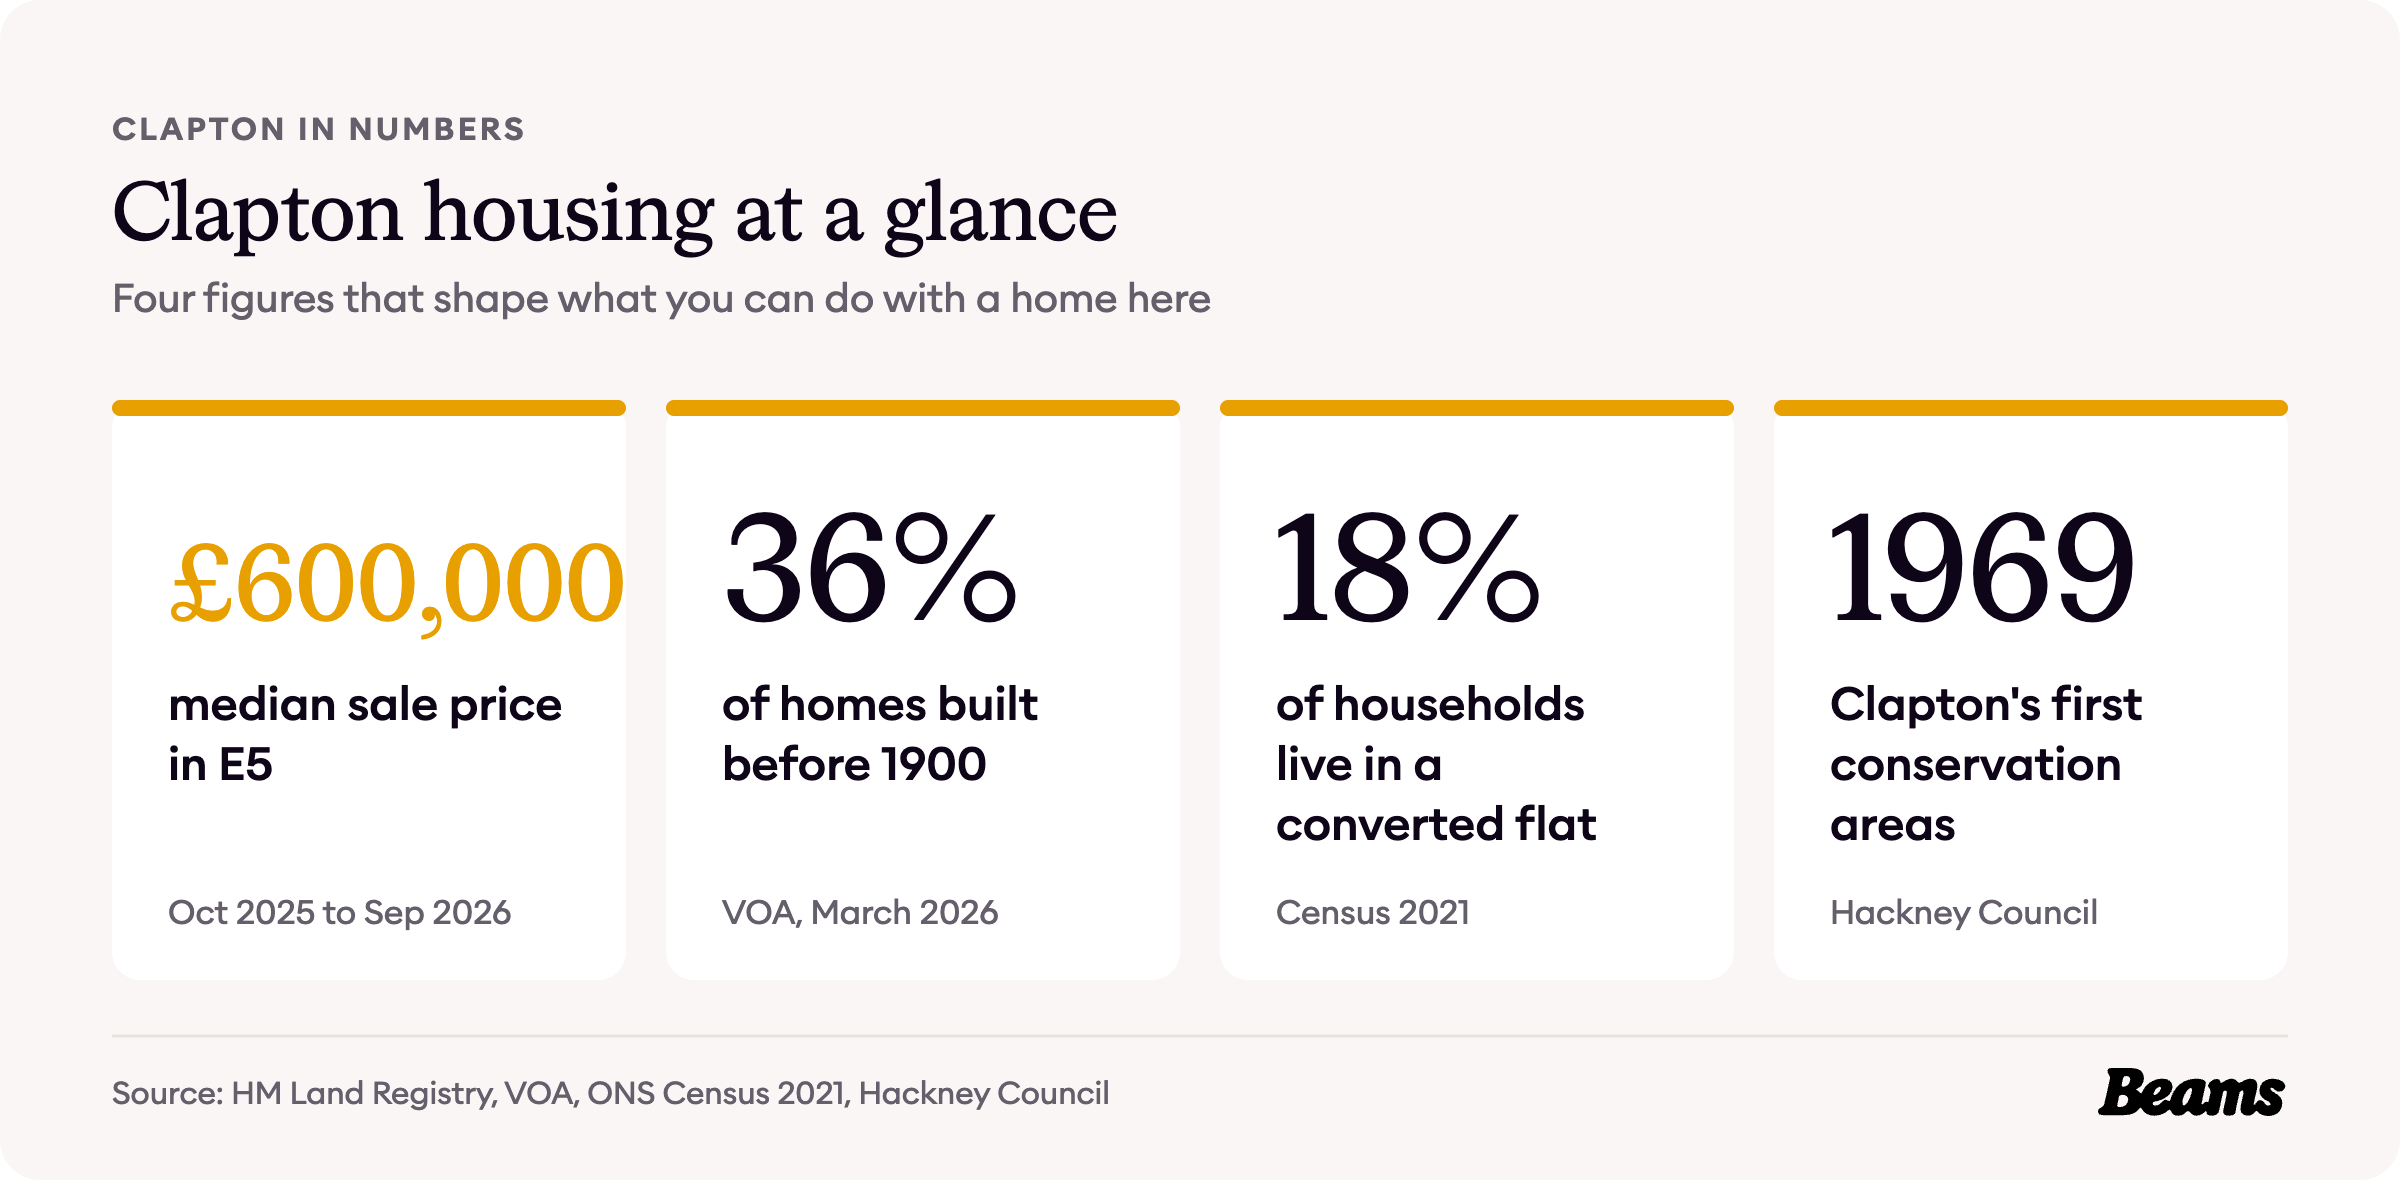
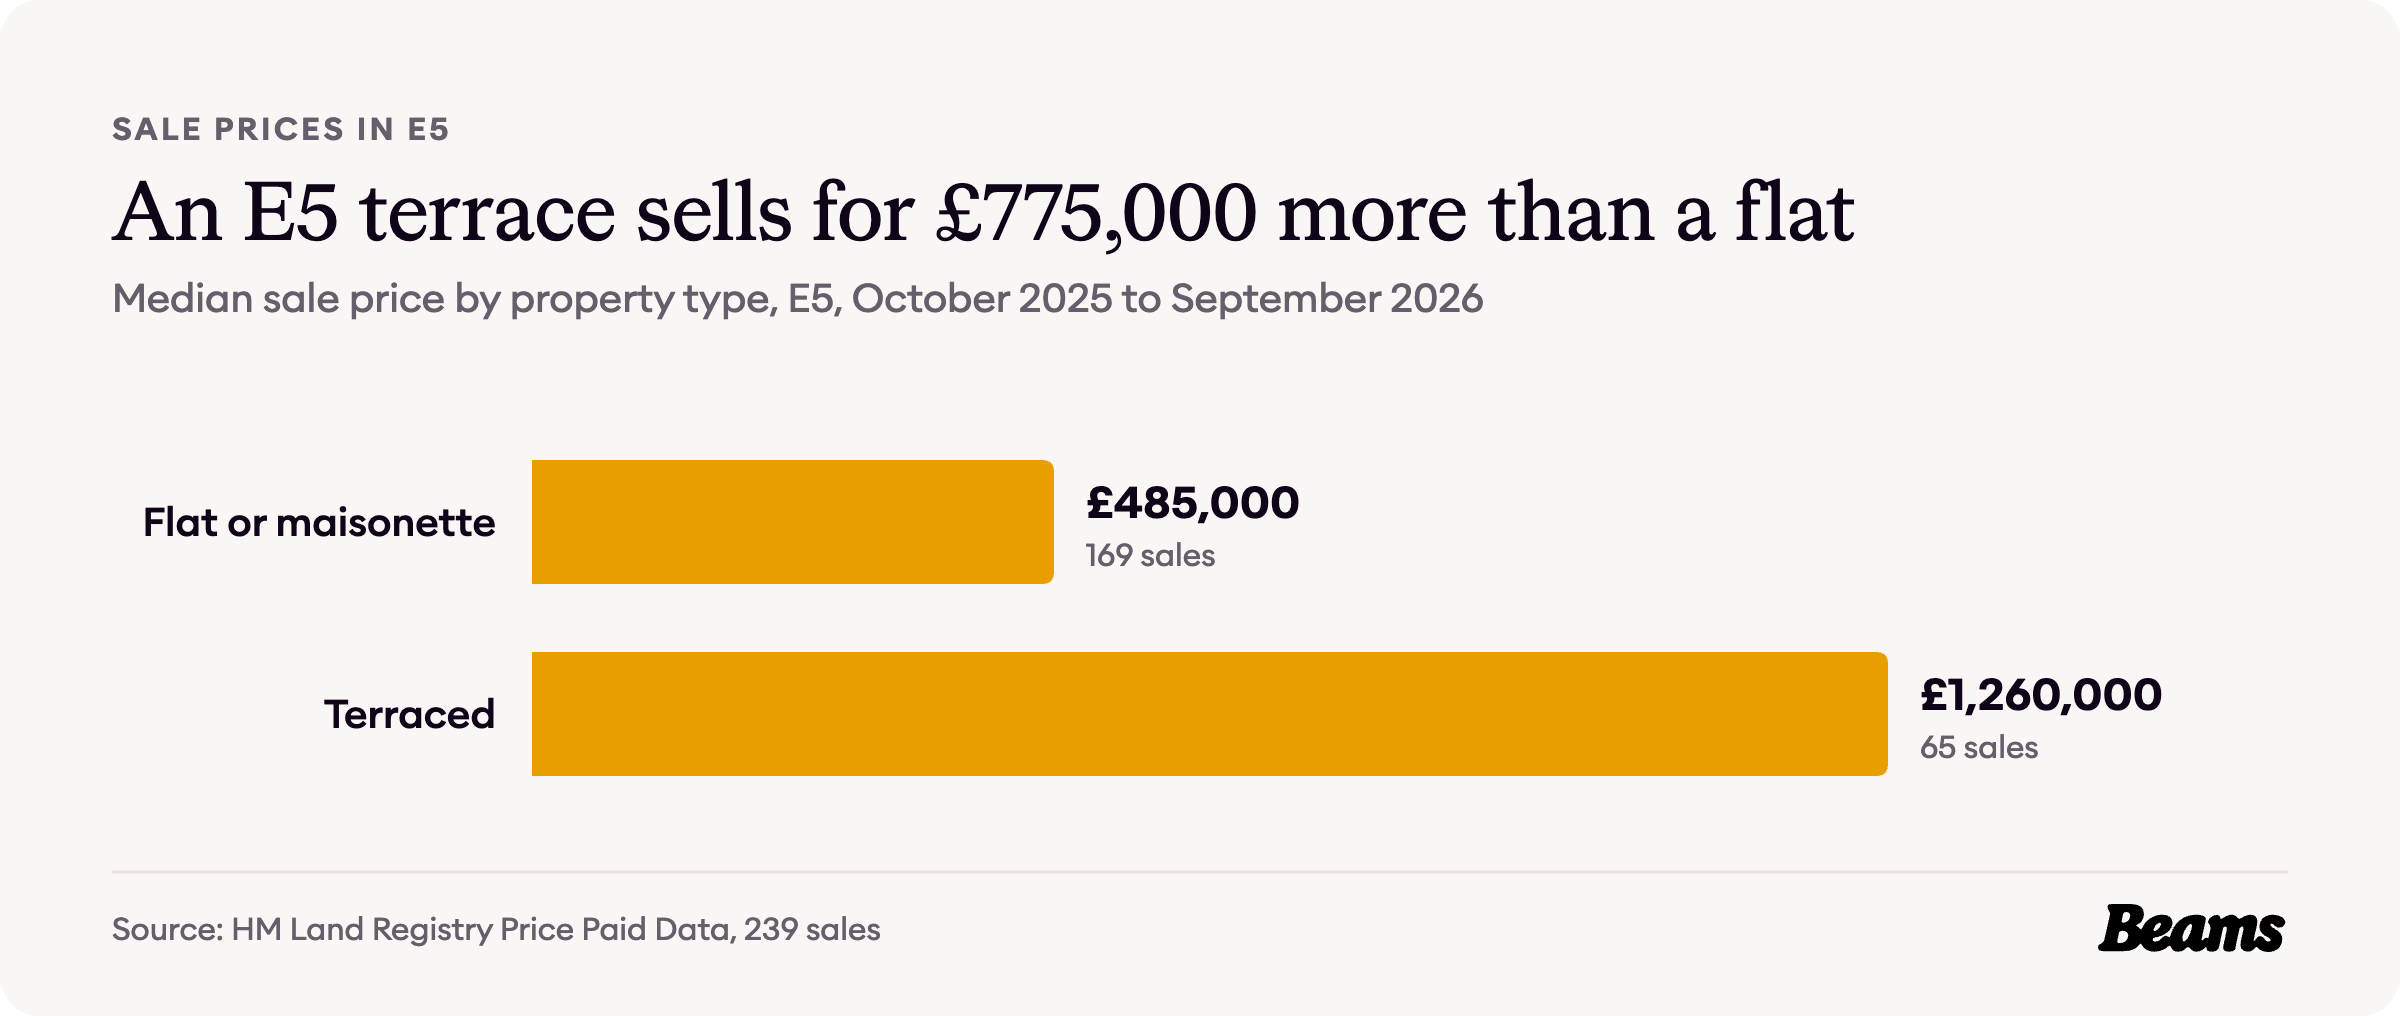
The E5 figures show what Clapton itself sells for. Land Registry recorded 239 sales in the district between October 2025 and September 2026, at a median price of £600,000 [7]. Flats and maisonettes made up 169 of them, at a median of £485,000. The 65 terraced houses sold for a median of £1,260,000, a gap of £775,000 [7].
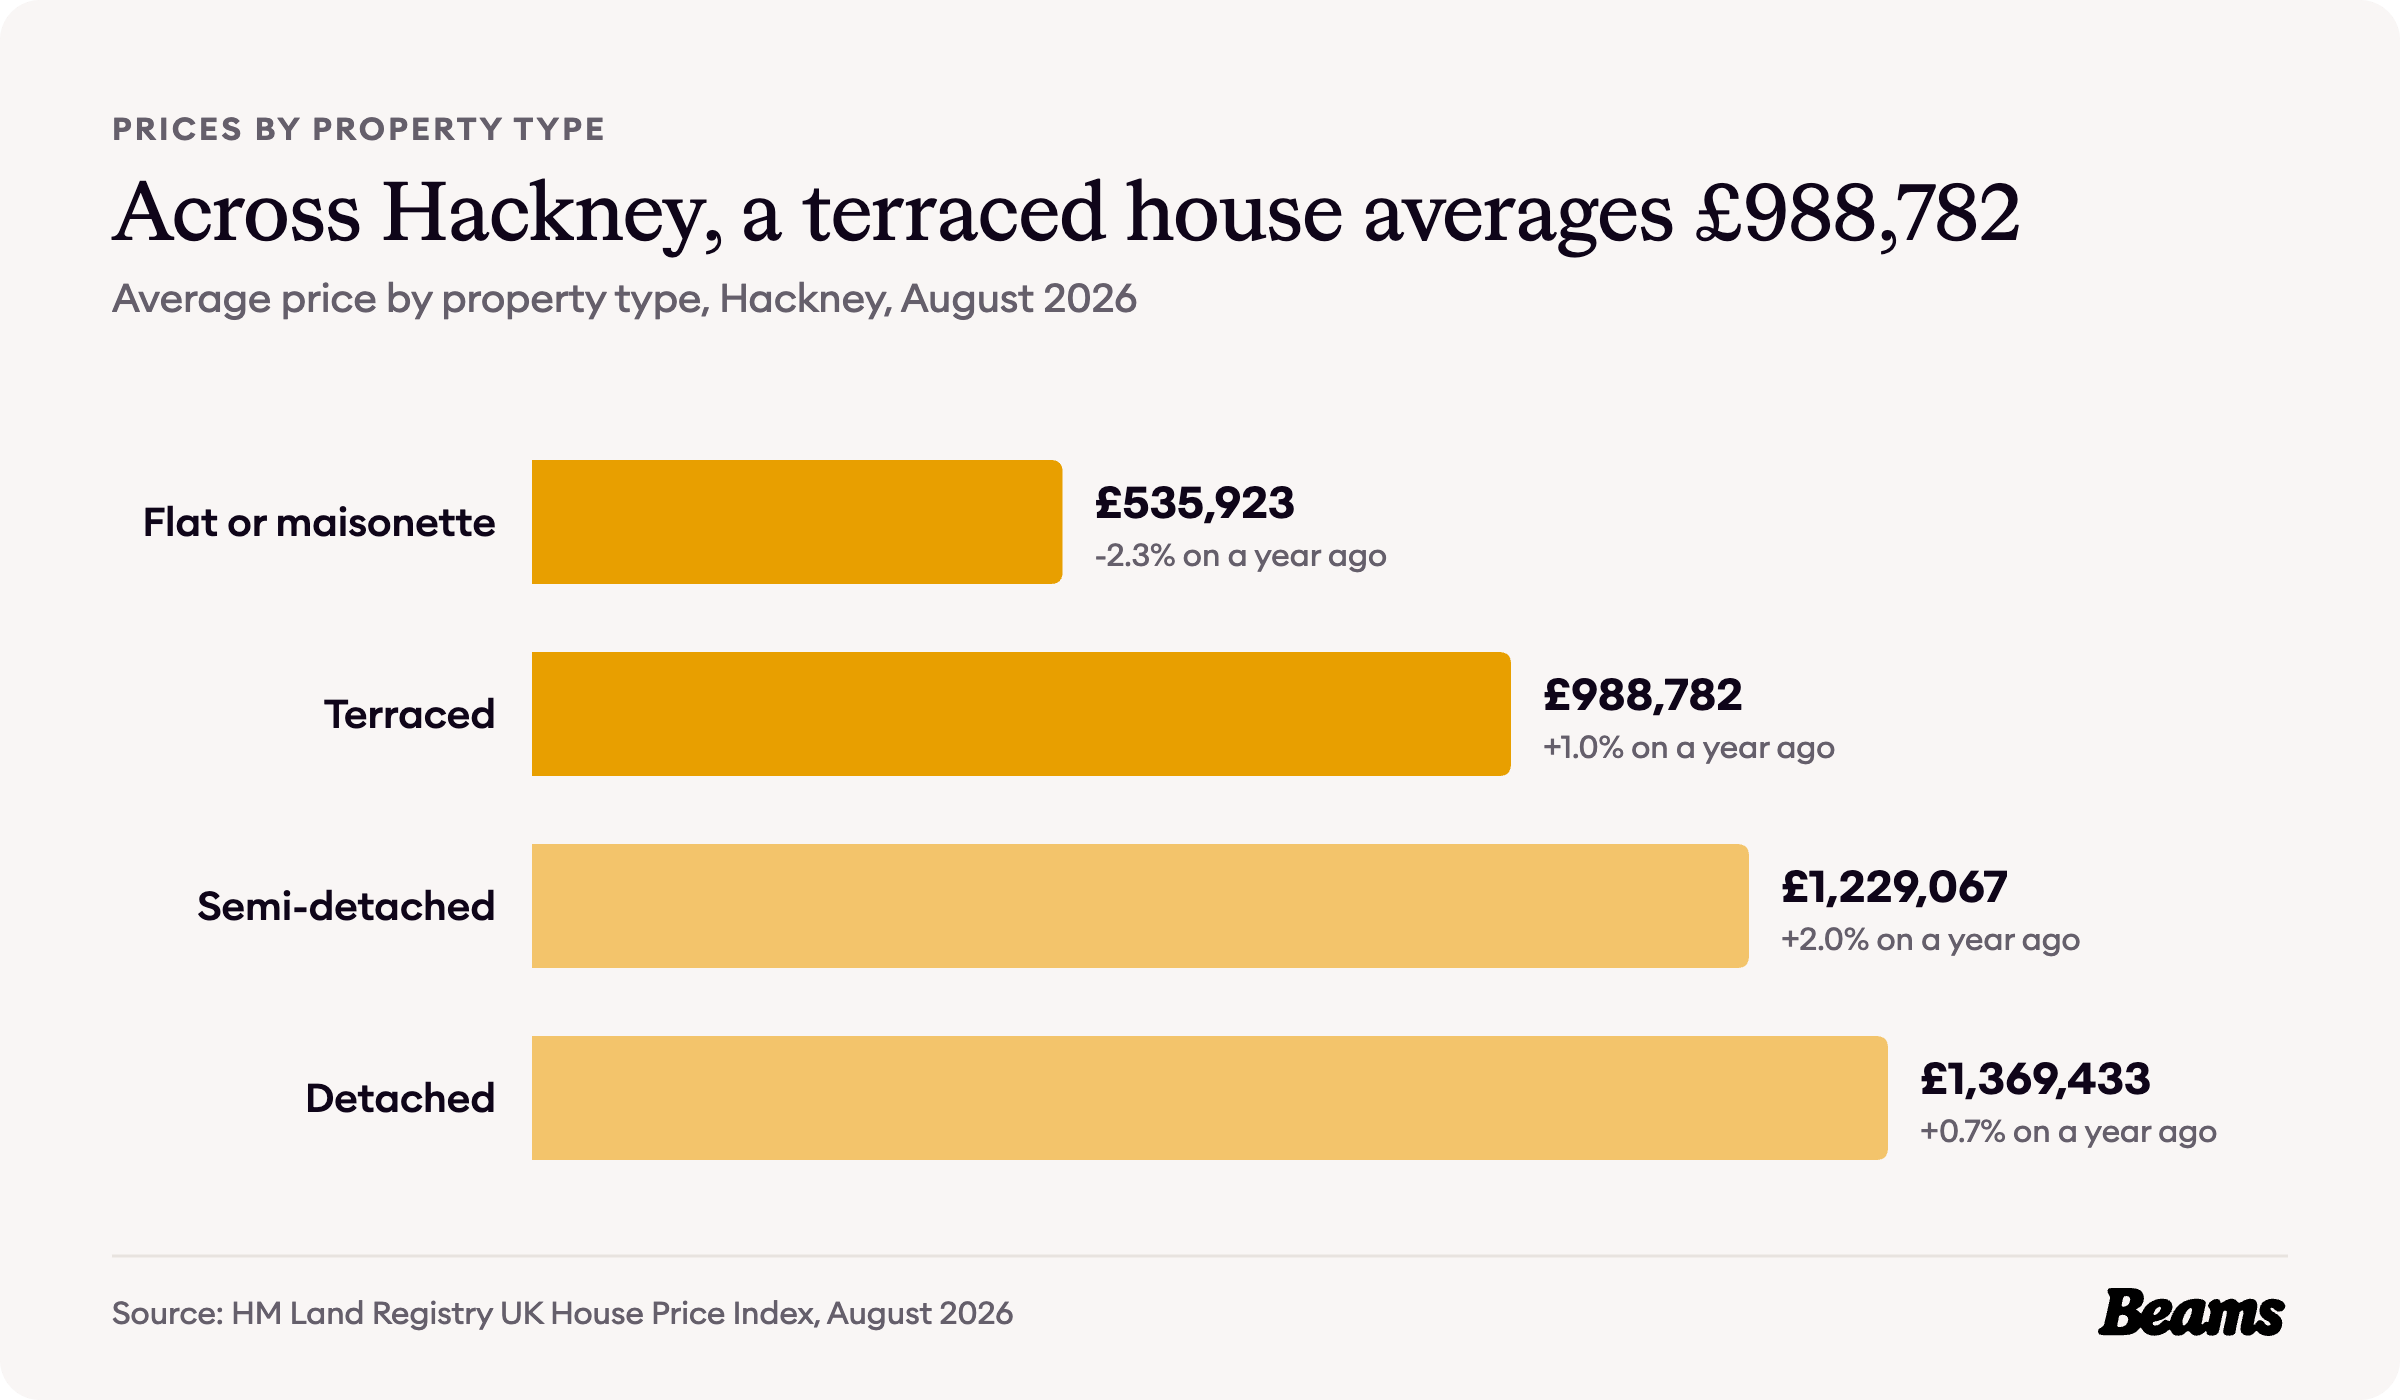
So a Clapton terrace sells for more than two and a half times the price of a Clapton flat. Across the whole of Hackney, a terraced house averaged £988,782 in August 2026 and a flat or maisonette £535,923 [5].
With a gap that size between a flat and a house, an owner who already has a terrace has every reason to stay, and a house extension in Clapton adds the room without paying for the move.
What it costs to rent
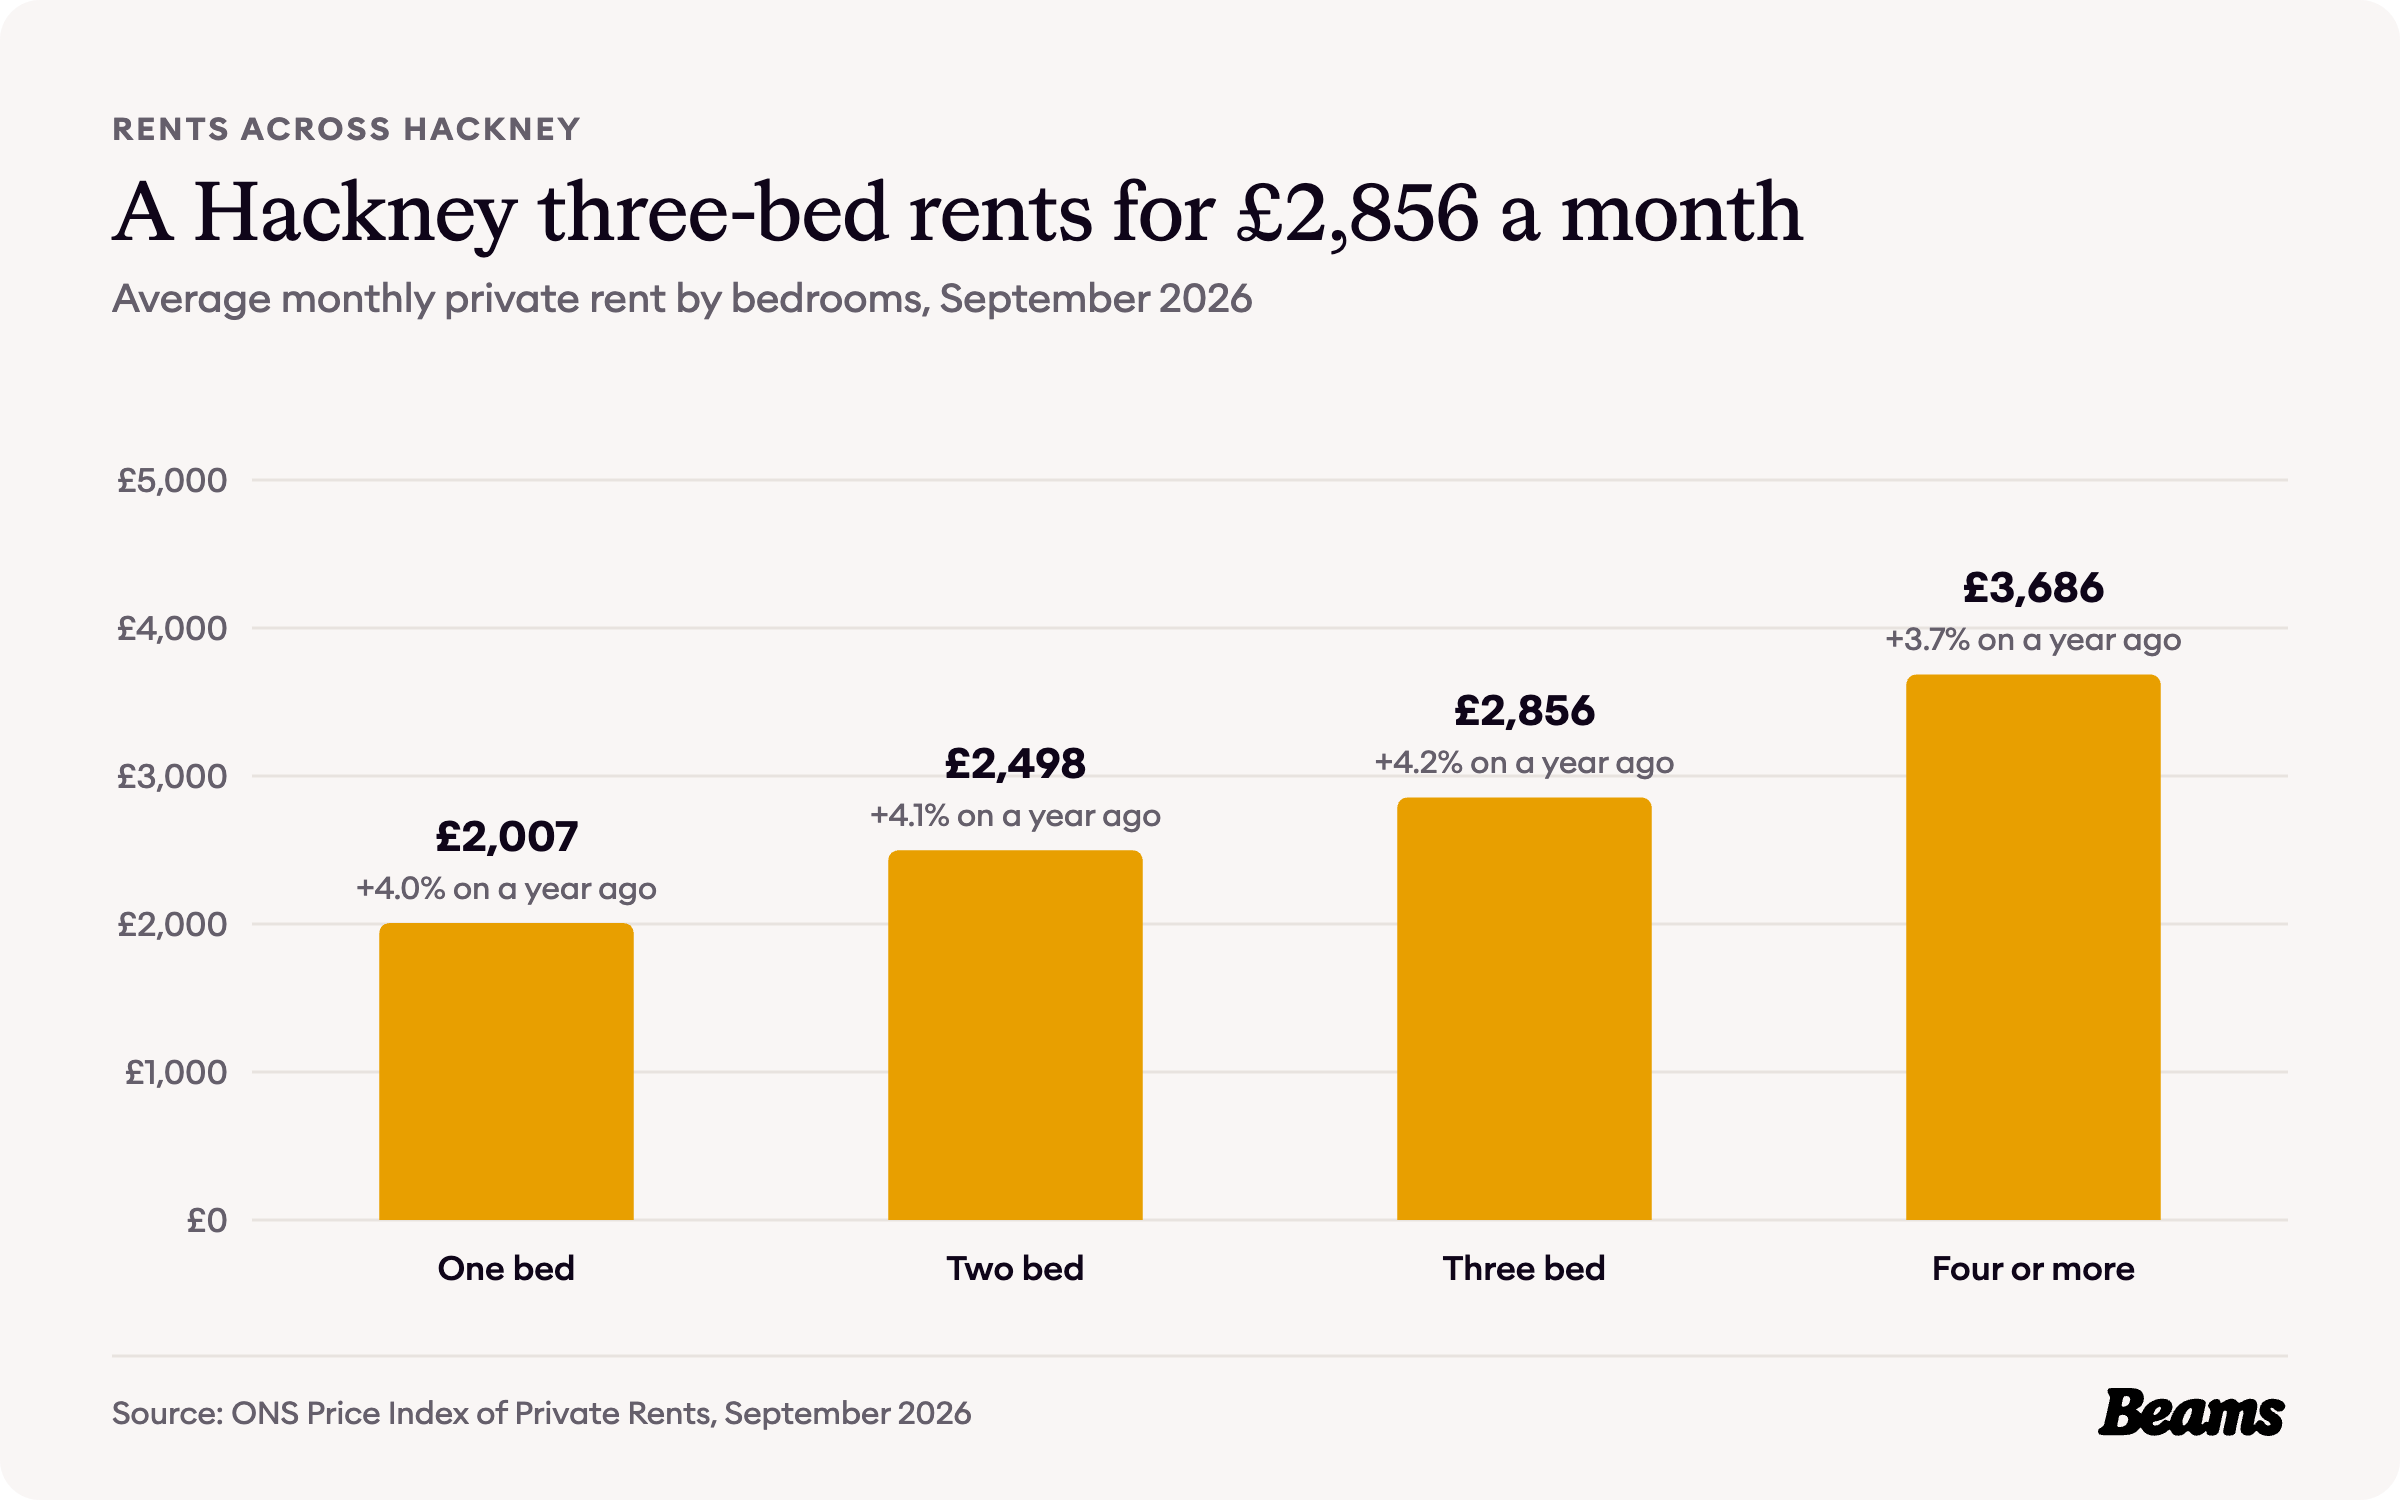
Rents are published for the whole borough. The average private rent in Hackney was £2,667 a month in September 2026, up 3.9% on a year earlier [5]. A one-bedroom home averaged £2,007 a month, a two-bedroom home £2,498 and a three-bedroom home £2,856.
With 32.1% of Clapton households renting privately, many of them in converted flats, landlords have good reason to keep those flats up to date, and a tired bathroom is often the job a bathroom renovation in Clapton tackles between tenancies.
Where Clapton homes sit for Council Tax
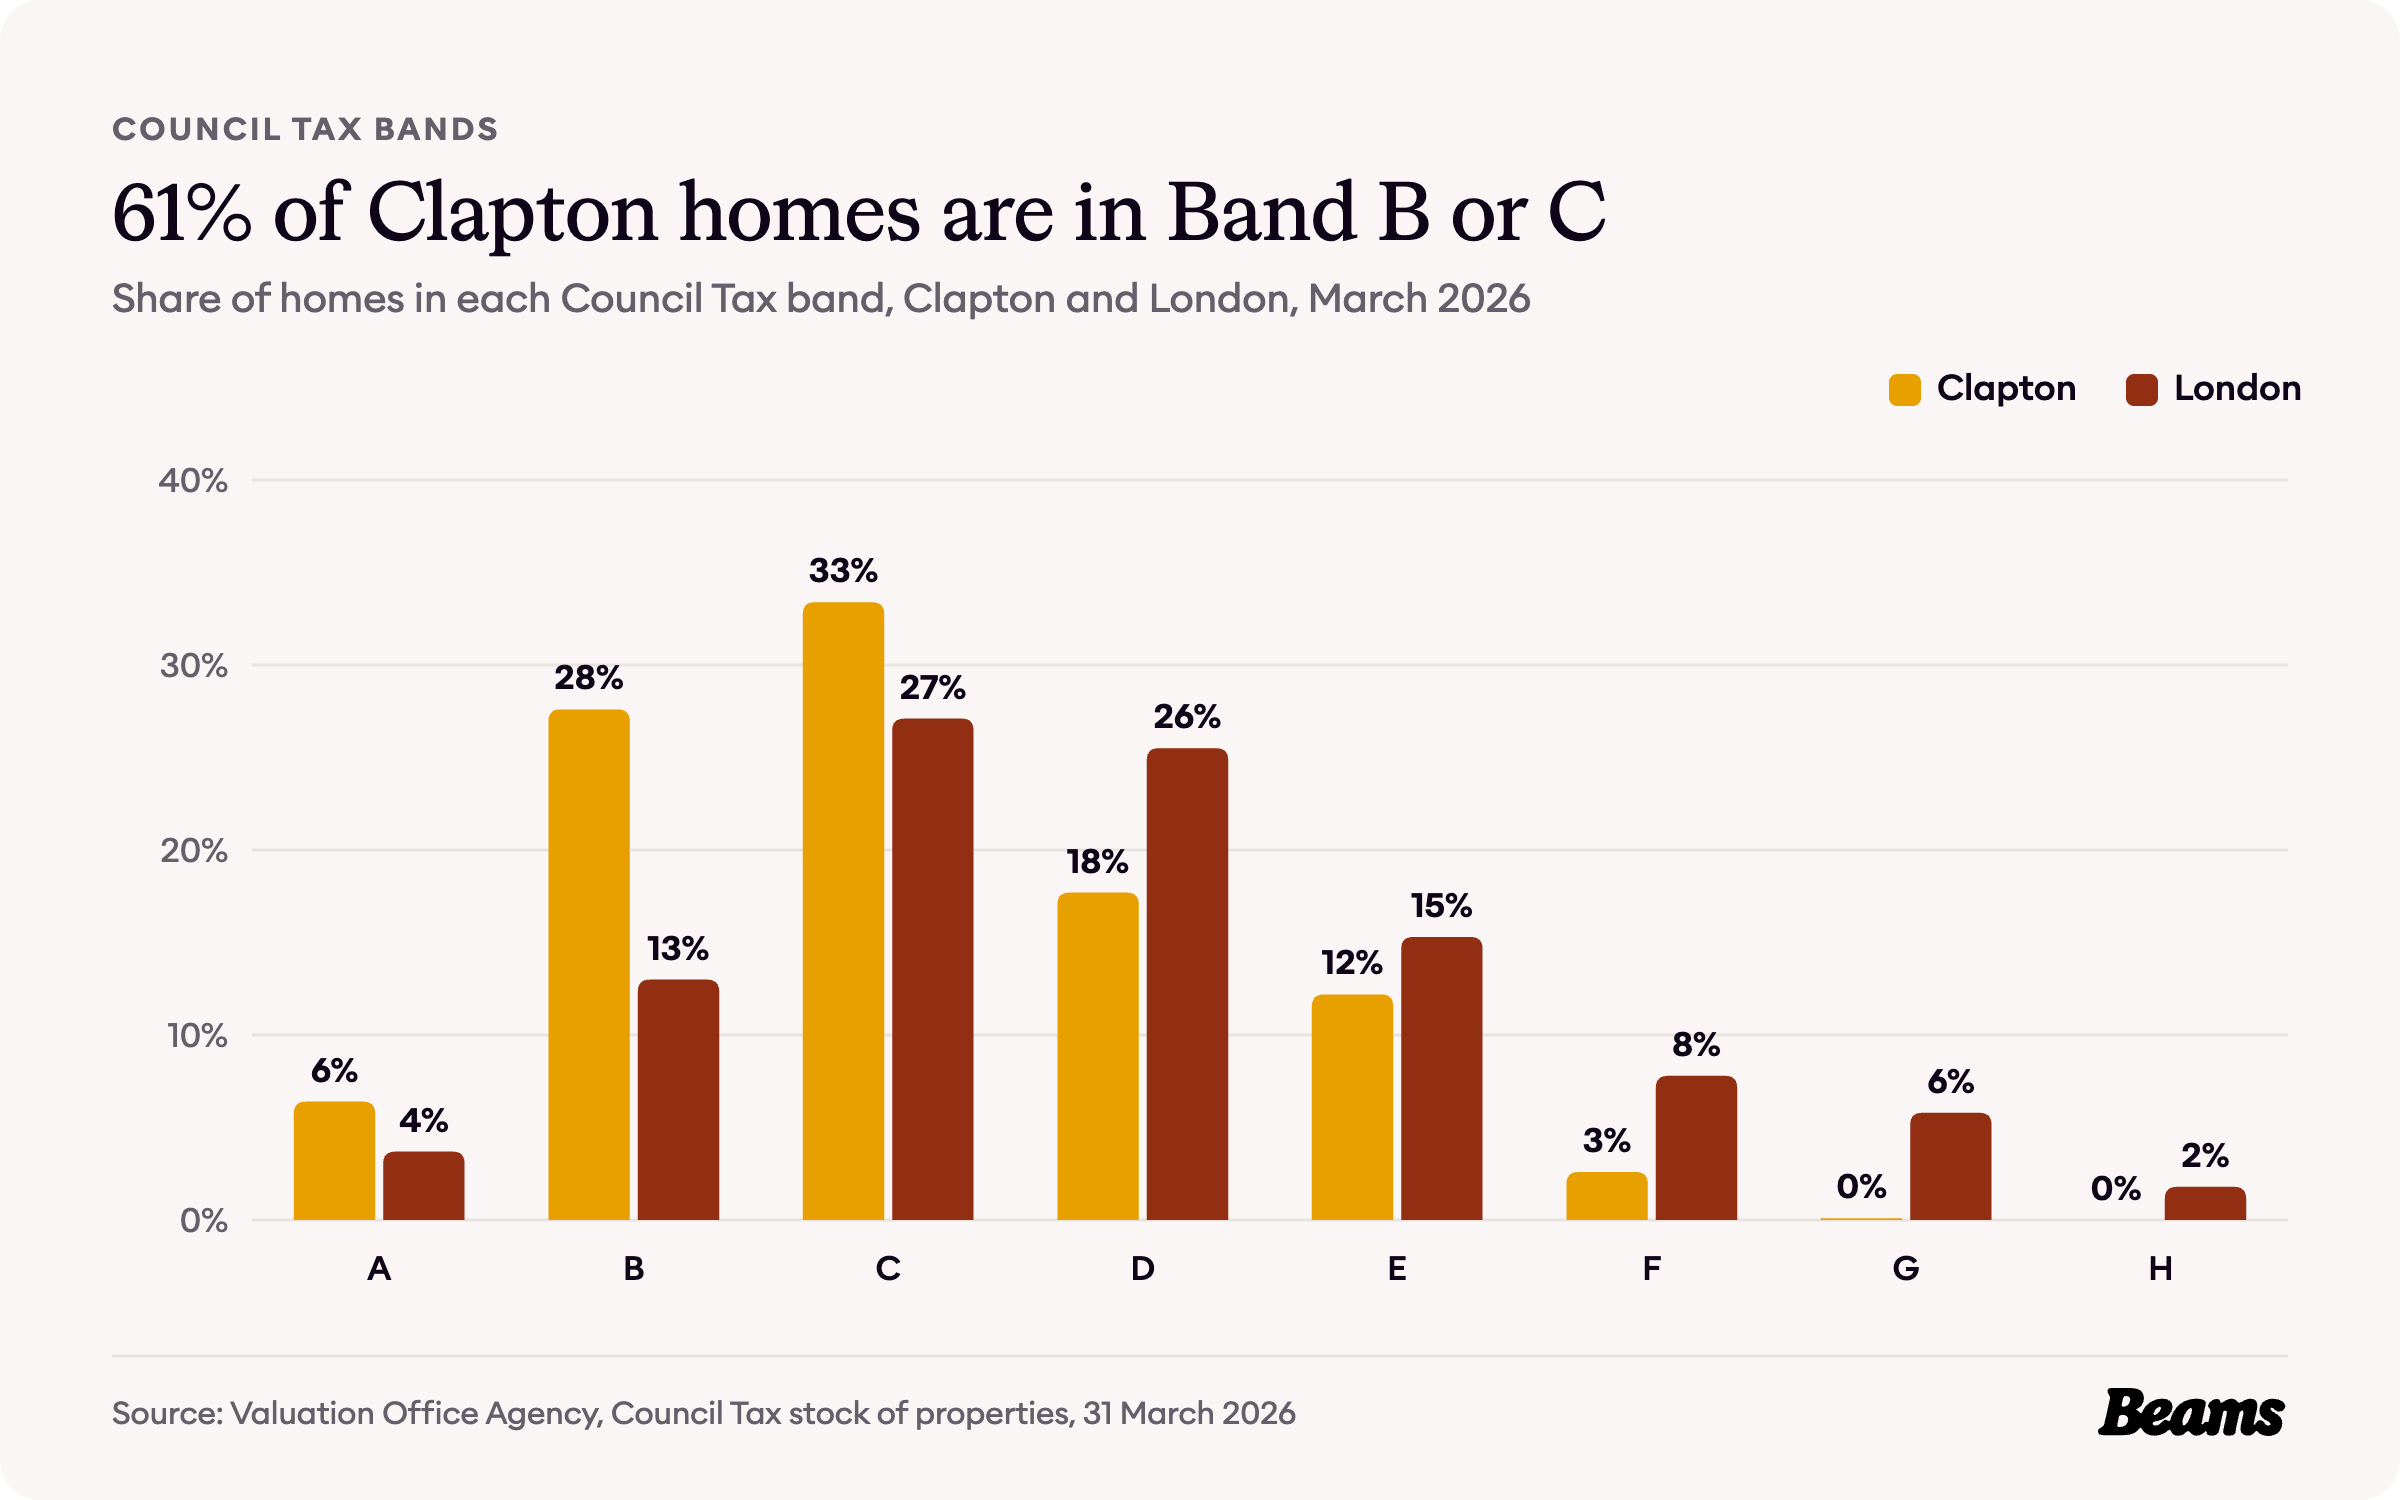
The Valuation Office Agency puts 33.4% of Clapton homes in Band C and 27.6% in Band B, 61.0% between them, against 40.1% for London [2].
Only 2.7% of homes are in Bands F to H, against 15.4% across London, and 6.4% are in Band A, the lowest band [2].
The rules on your street
Hackney has 35 conservation areas, and they started in Clapton. Three of the first four, designated in 1969, were Clapton Square, Clapton Common and Clapton Pond [8].
Clapton Square conservation area was extended in 1991 and 2000. Its terraces of listed buildings face a square that is protected by Act of Parliament as a London Square [9].
Inside a conservation area, Hackney says you may need planning permission for work that would not normally need it, such as minor roof alterations, dormer windows or a satellite dish [8]. The council has also made Article 4 directions that remove householder rights in four conservation areas, Brownswood, Well Street, Beck Road and Shacklewell Green, but none of Clapton's conservation areas is on that list [10]. Digging down is where the rules need the most care, so a basement conversion in Clapton starts with a check of the address.
Hackney aims to decide an application within eight weeks of it being made valid, and a major application within 13 weeks [11]. Our builders in Clapton check which rules apply to your street before any drawings start.
Clapton housing statistics at a glance
- Median sale price in E5, October 2025 to September 2026: £600,000 [7]
- Median terraced house in E5: £1,260,000 [7]
- Median flat or maisonette in E5: £485,000 [7]
- Average house price, Hackney, August 2026: £619,408 (London £554,430) [5] [6]
- Average private rent, Hackney, September 2026: £2,667 a month [5]
- Homes built before 1900: 36.4% (London 20.8%) [2]
- Households living in a converted flat: 17.9% (London 11.1%) [3]
- Households living in a flat of any kind: 75.9% (London 54.0%) [3]
- Households who own their home: 27.1% (London 45.2%) [4]
- Conservation areas in Hackney: 35 [8]
Frequently asked questions
References
- British History Online, Hackney: Clapton. Victoria County History of Middlesex, volume 10.
- Valuation Office Agency, Council Tax: stock of properties 2026. Table CTSOP4.1, properties by build period and Council Tax band at 31 March 2026, Clapton census areas and London.
- ONS, Census 2021 table TS044: Accommodation type. Households by type of home, Clapton census areas and London.
- ONS, Census 2021 table TS054: Tenure. Households by tenure, Clapton census areas and London.
- ONS, Housing prices in Hackney. UK House Price Index for August 2026 and Price Index of Private Rents for September 2026, published 21 October 2026.
- HM Land Registry, UK House Price Index. Average prices for Hackney, London and England, August 2006 to August 2026.
- HM Land Registry, Price Paid Data. Sales in the E5 postcode district, October 2025 to September 2026.
- Hackney Council, Conservation areas map. Accessed 29 October 2026.
- Hackney Council, Clapton Square conservation area. Accessed 29 October 2026.
- Hackney Council, Article 4 Directions. Accessed 29 October 2026.
- Hackney Council, Submit your planning application. Accessed 29 October 2026.
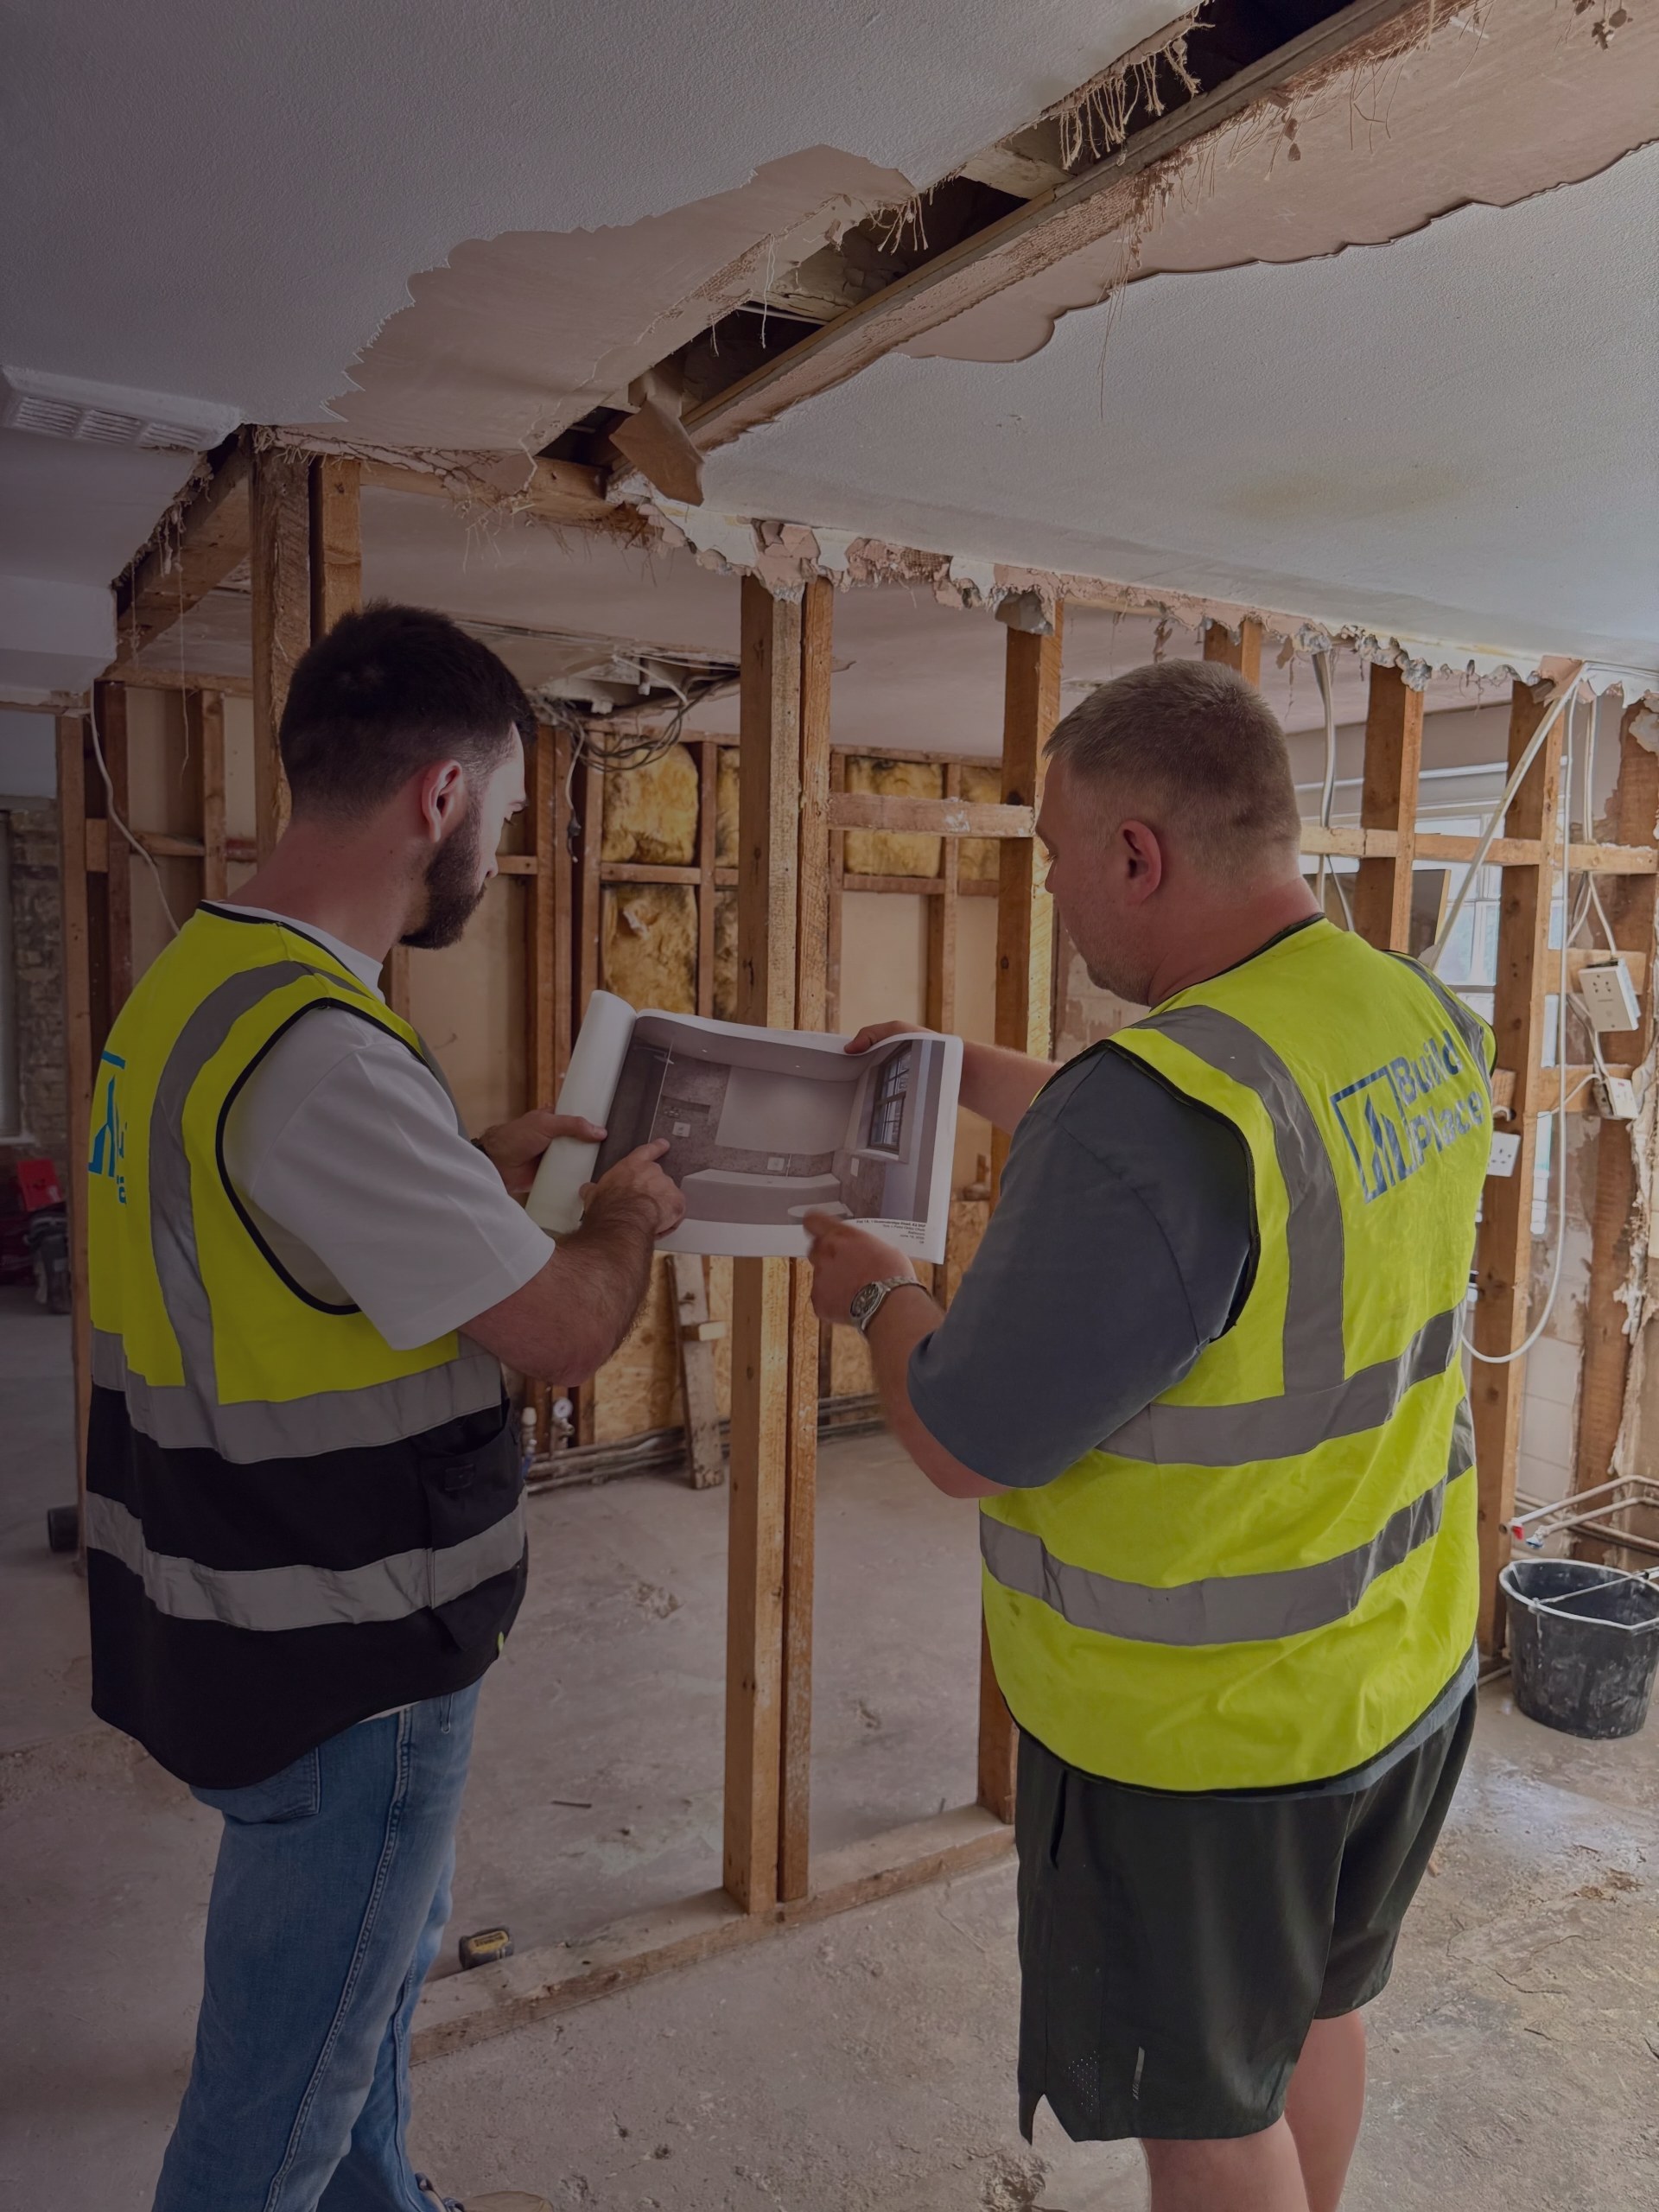
Thinking of improving rather than moving?
Tell us about your Clapton home and what you want to change, from a converted flat to a Victorian terrace. We'll give you a free estimate, then up to three vetted builders quote against the same specification.