
Chiswick housing statistics 2026
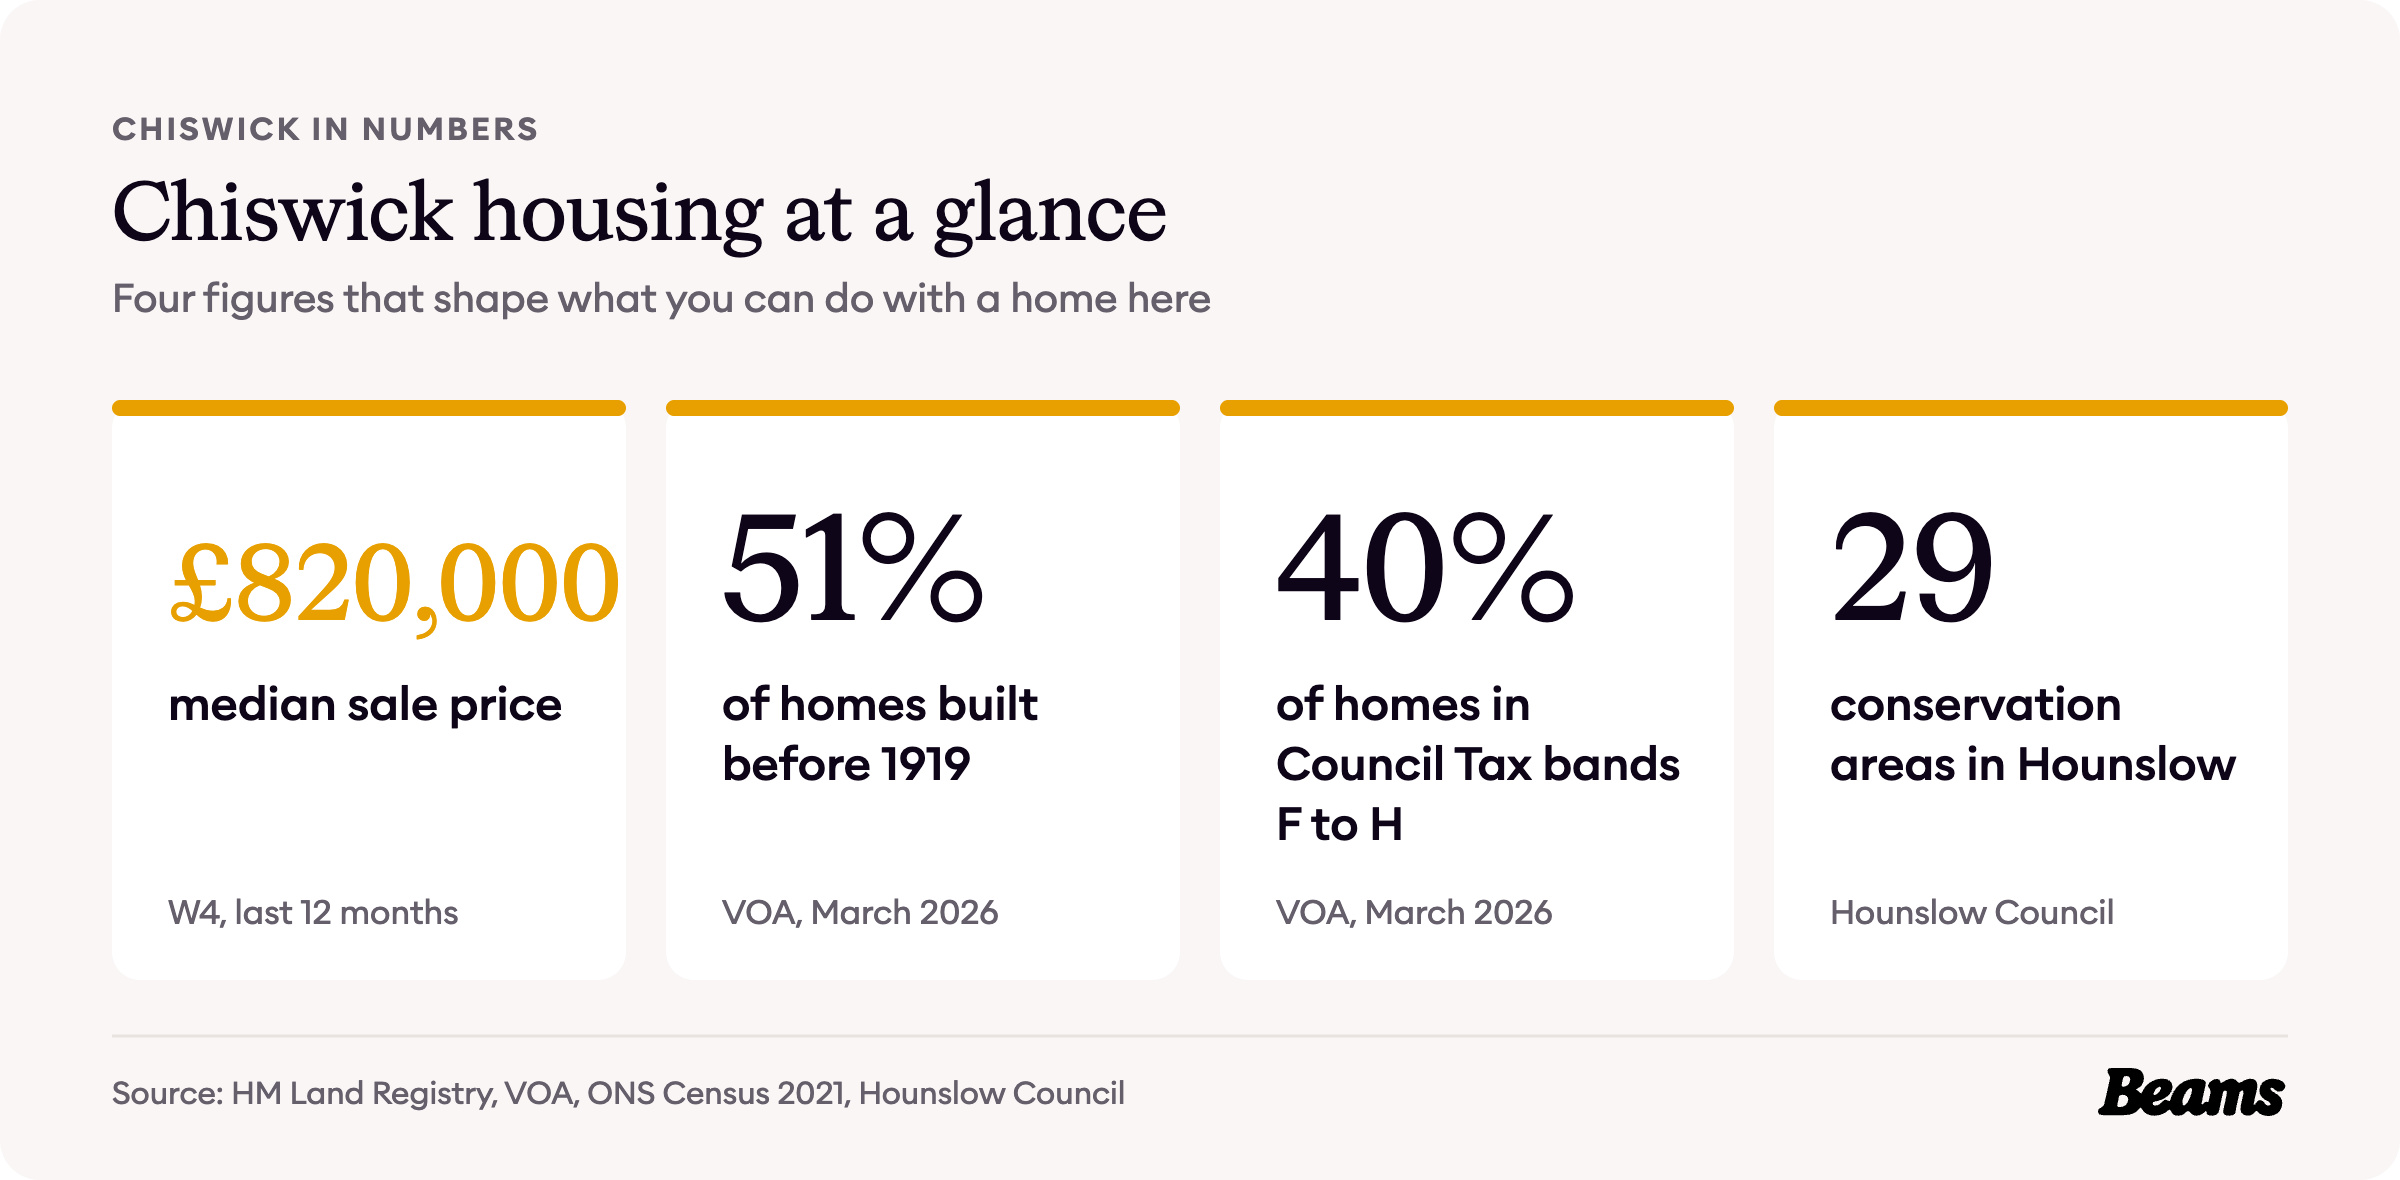
Chiswick went from three small settlements to a busy Victorian and Edwardian suburb in about forty years, and its homes now sell for far more than the Hounslow average. Half of them were built before 1919, and the typical W4 home sold for £820,000 in the last year.
Every figure comes from an official source and is dated, so you can see exactly what you are working with before you plan a home renovation in Chiswick. The sources are numbered in brackets and listed in full at the end of the page.
How Chiswick was built
For centuries Chiswick was three settlements: Old Chiswick, Turnham Green and Strand-on-the-Green [1]. Its building boom began in the late 1860s, helped by the railway line of 1869. The population was only 8,508 in 1871, but it reached 15,975 by 1881 and 38,697 by 1911, more than four times as many people in forty years [1].
Bedford Park is the best known result. It was begun in the mid 1870s, its first houses, in the Avenue, were occupied in 1876, and Richard Norman Shaw was its estate architect from 1877 until 1880. By 1883 there were 490 houses on 113 acres [1].
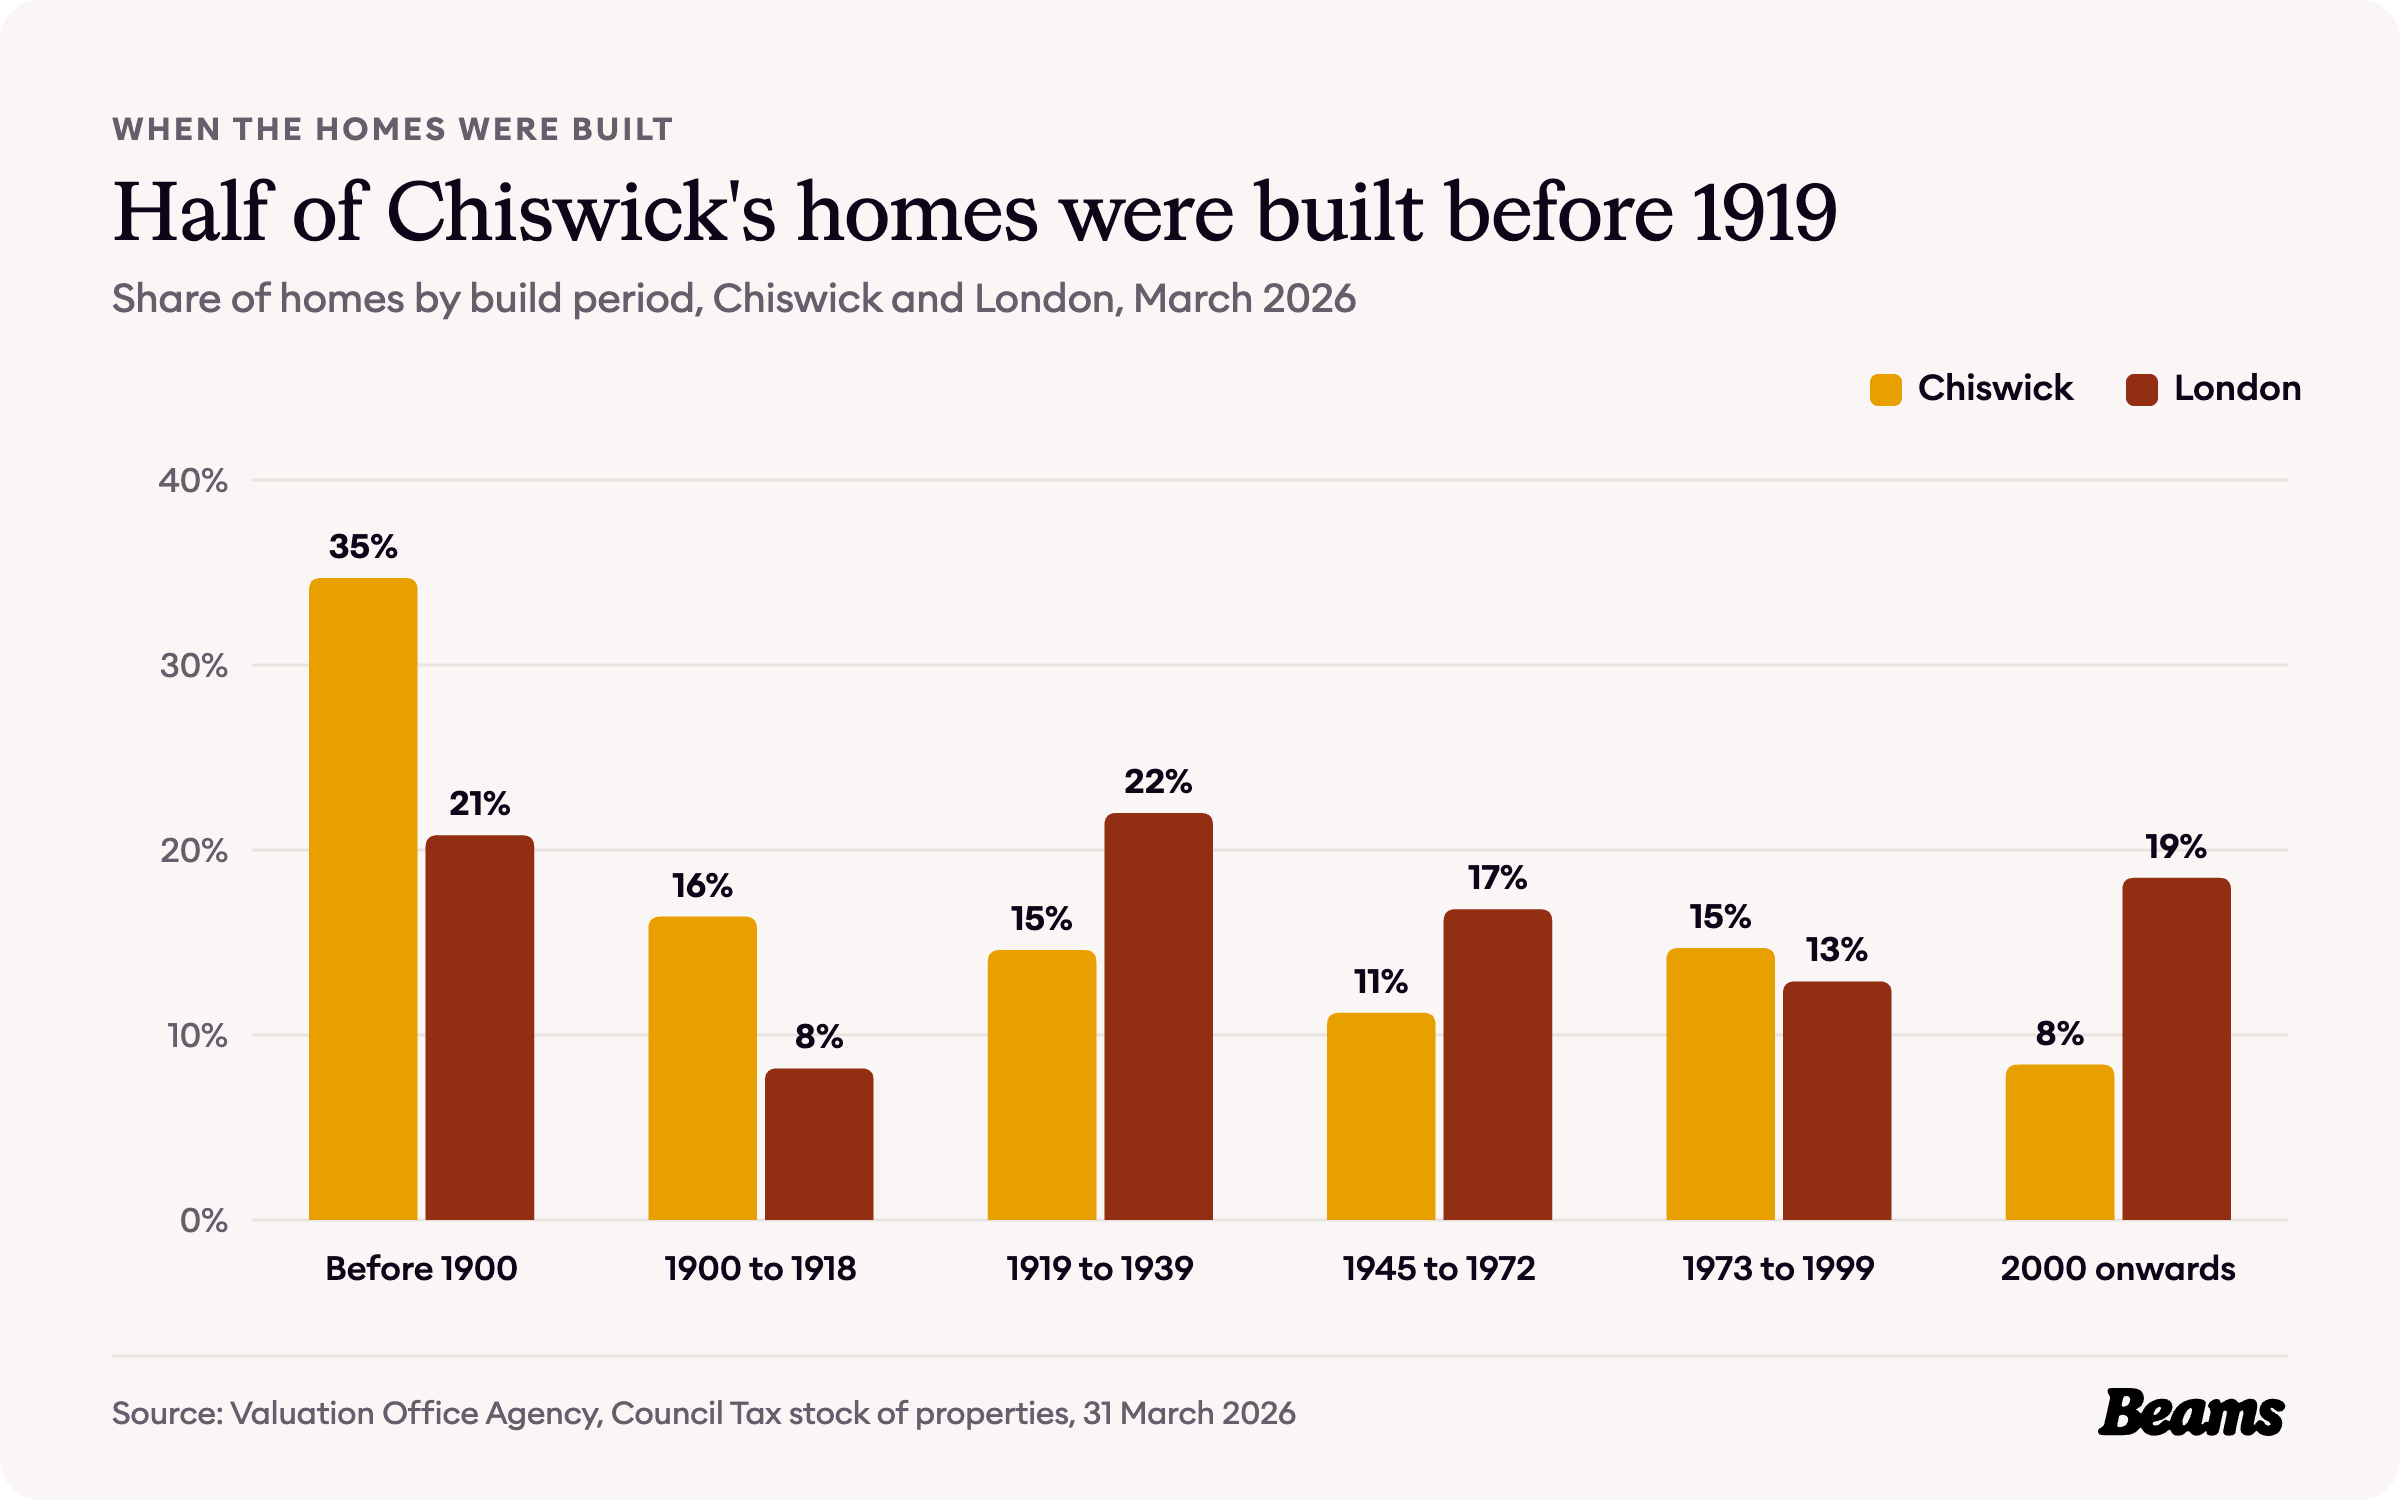
That building boom still shapes the place. The Valuation Office Agency counts 16,480 homes in the census areas that make up Chiswick on this page. 34.7% were built before 1900 and another 16.4% between 1900 and 1918, so 51.1% predate the First World War, against 29.0% across London [2].
Far less has been built since. Only 8.4% of Chiswick's homes date from 2000 or later, compared with 18.5% for London [2]. Victorian and Edwardian houses with pitched roofs are the classic starting point for a loft conversion in Chiswick.
How Chiswick households live
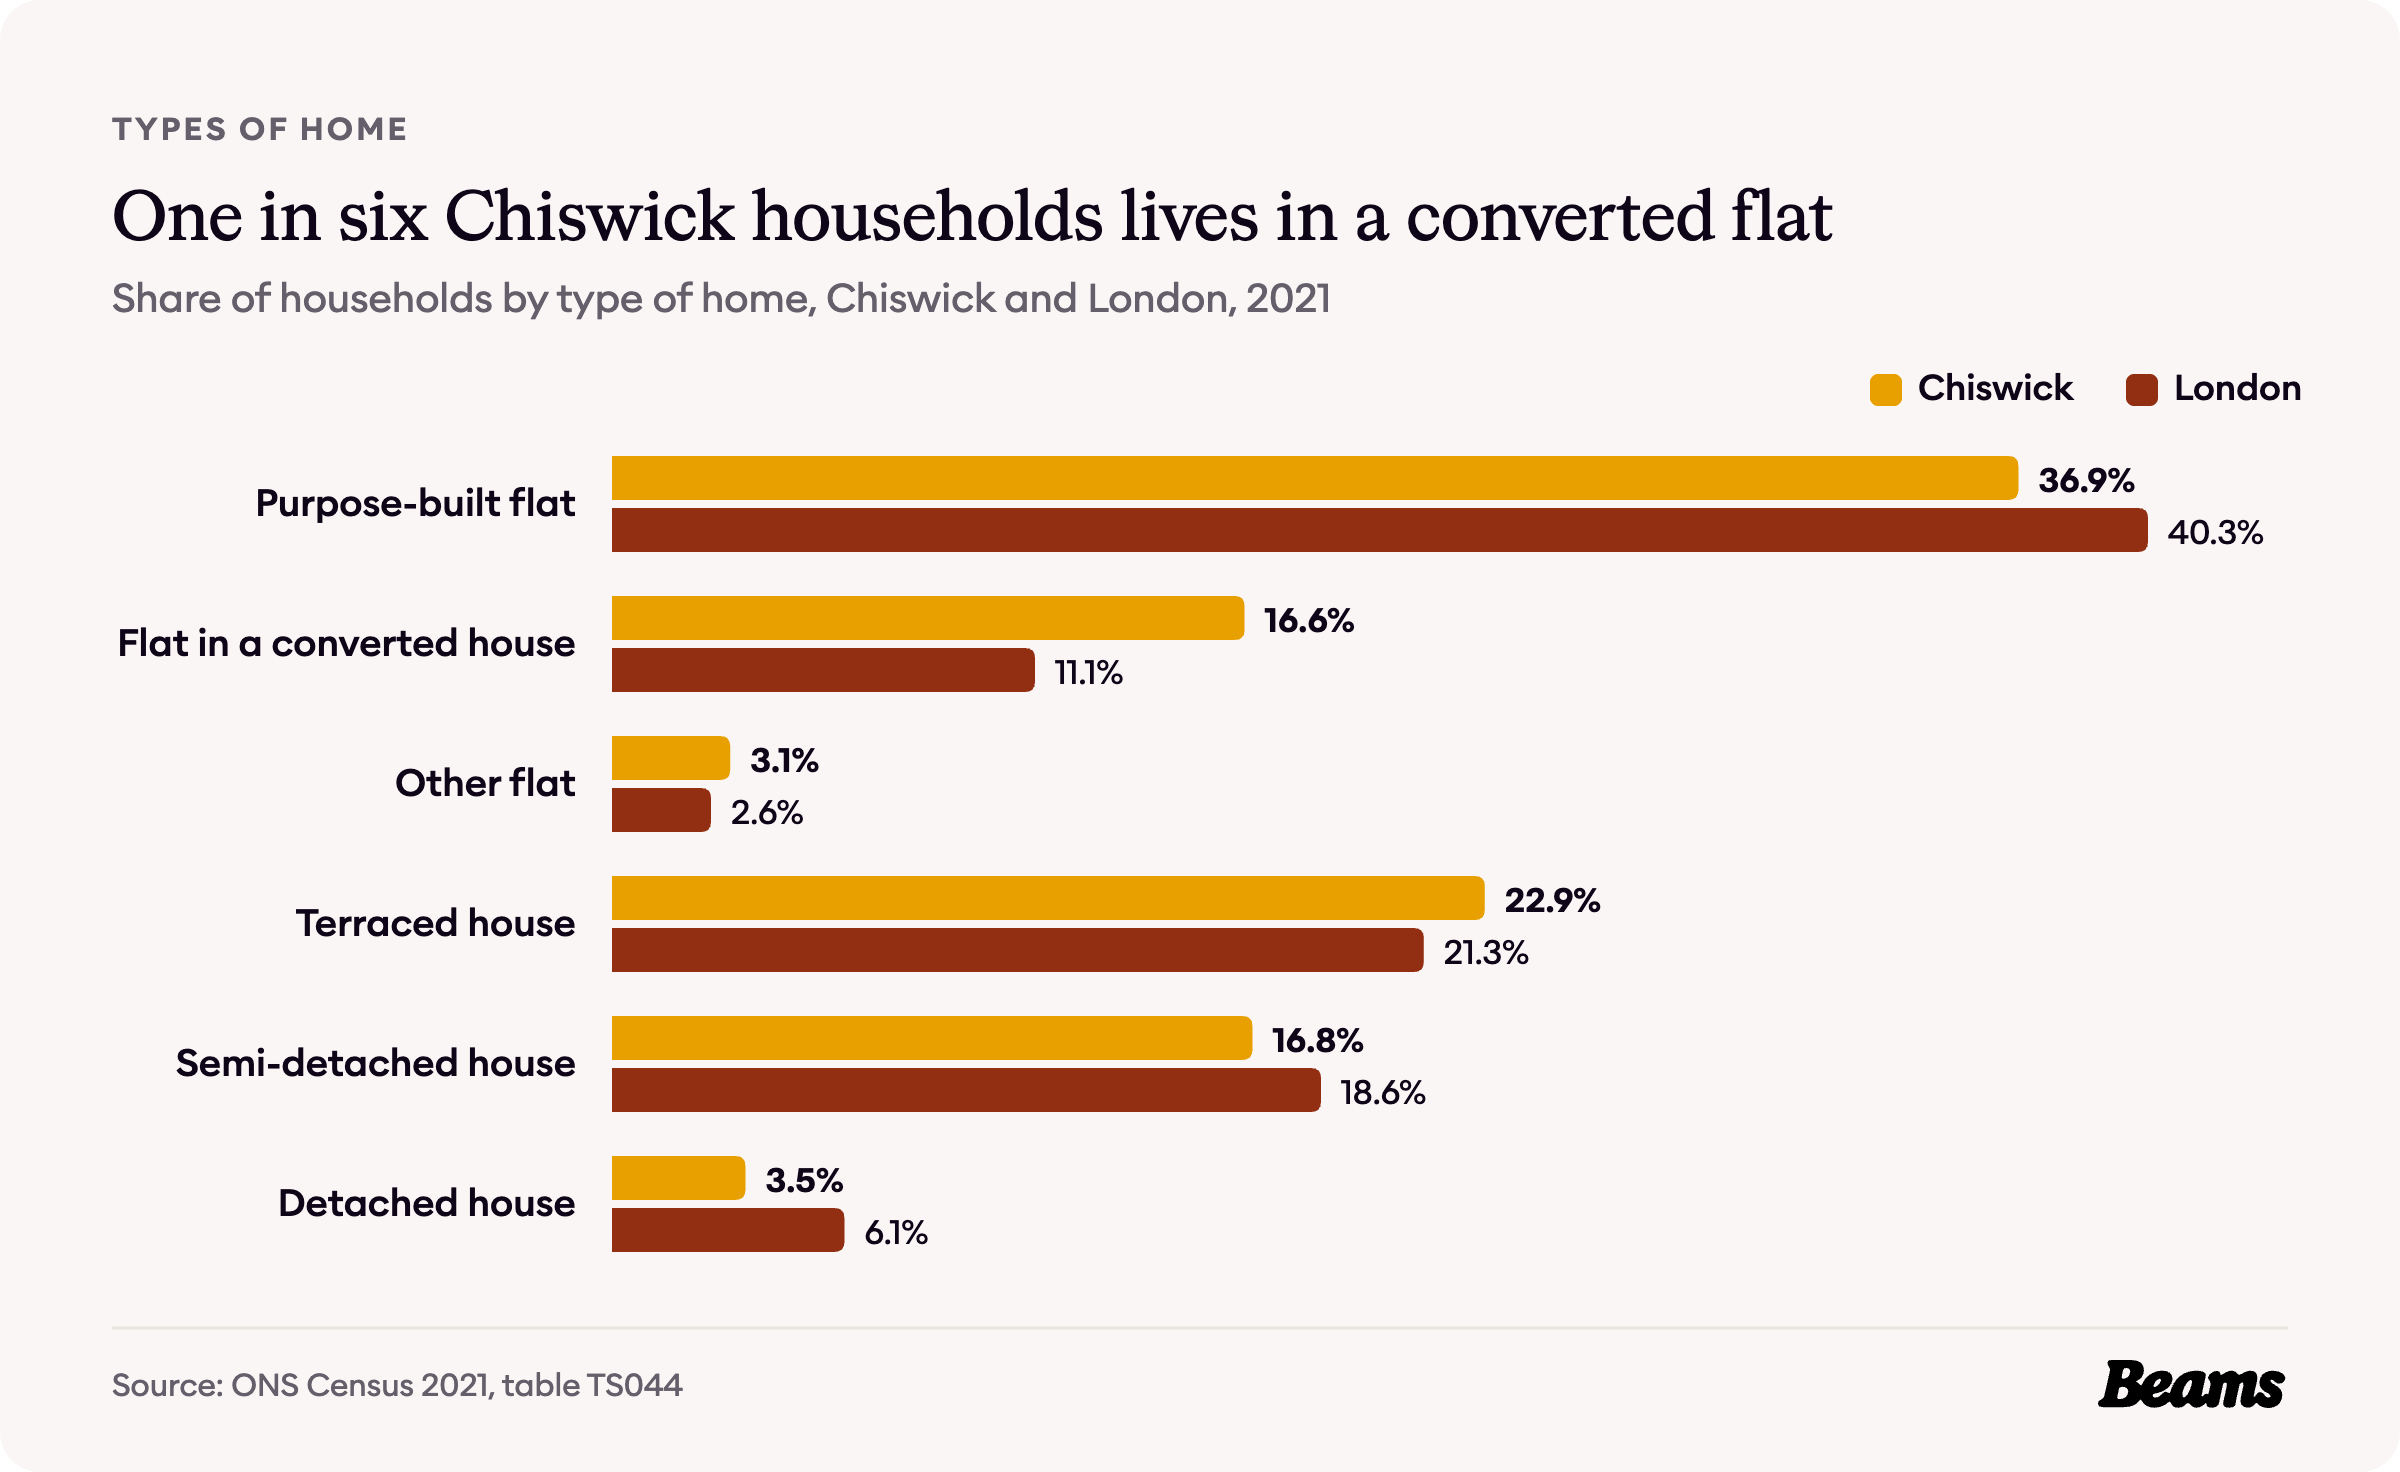
The 2021 Census counted 15,274 households here, and they are split almost evenly between flats and houses. 56.6% live in a flat of some kind, close to London's 54.0%, and 43.2% live in a house [3].
36.9% live in a purpose-built flat and 16.6% in a flat in a converted house, half as many again as London's 11.1%. A further 22.9% live in a terraced house and 16.8% in a semi-detached house [3]. In those converted flats a kitchen renovation in Chiswick is often about getting more out of the same floor area.
Who owns Chiswick's homes
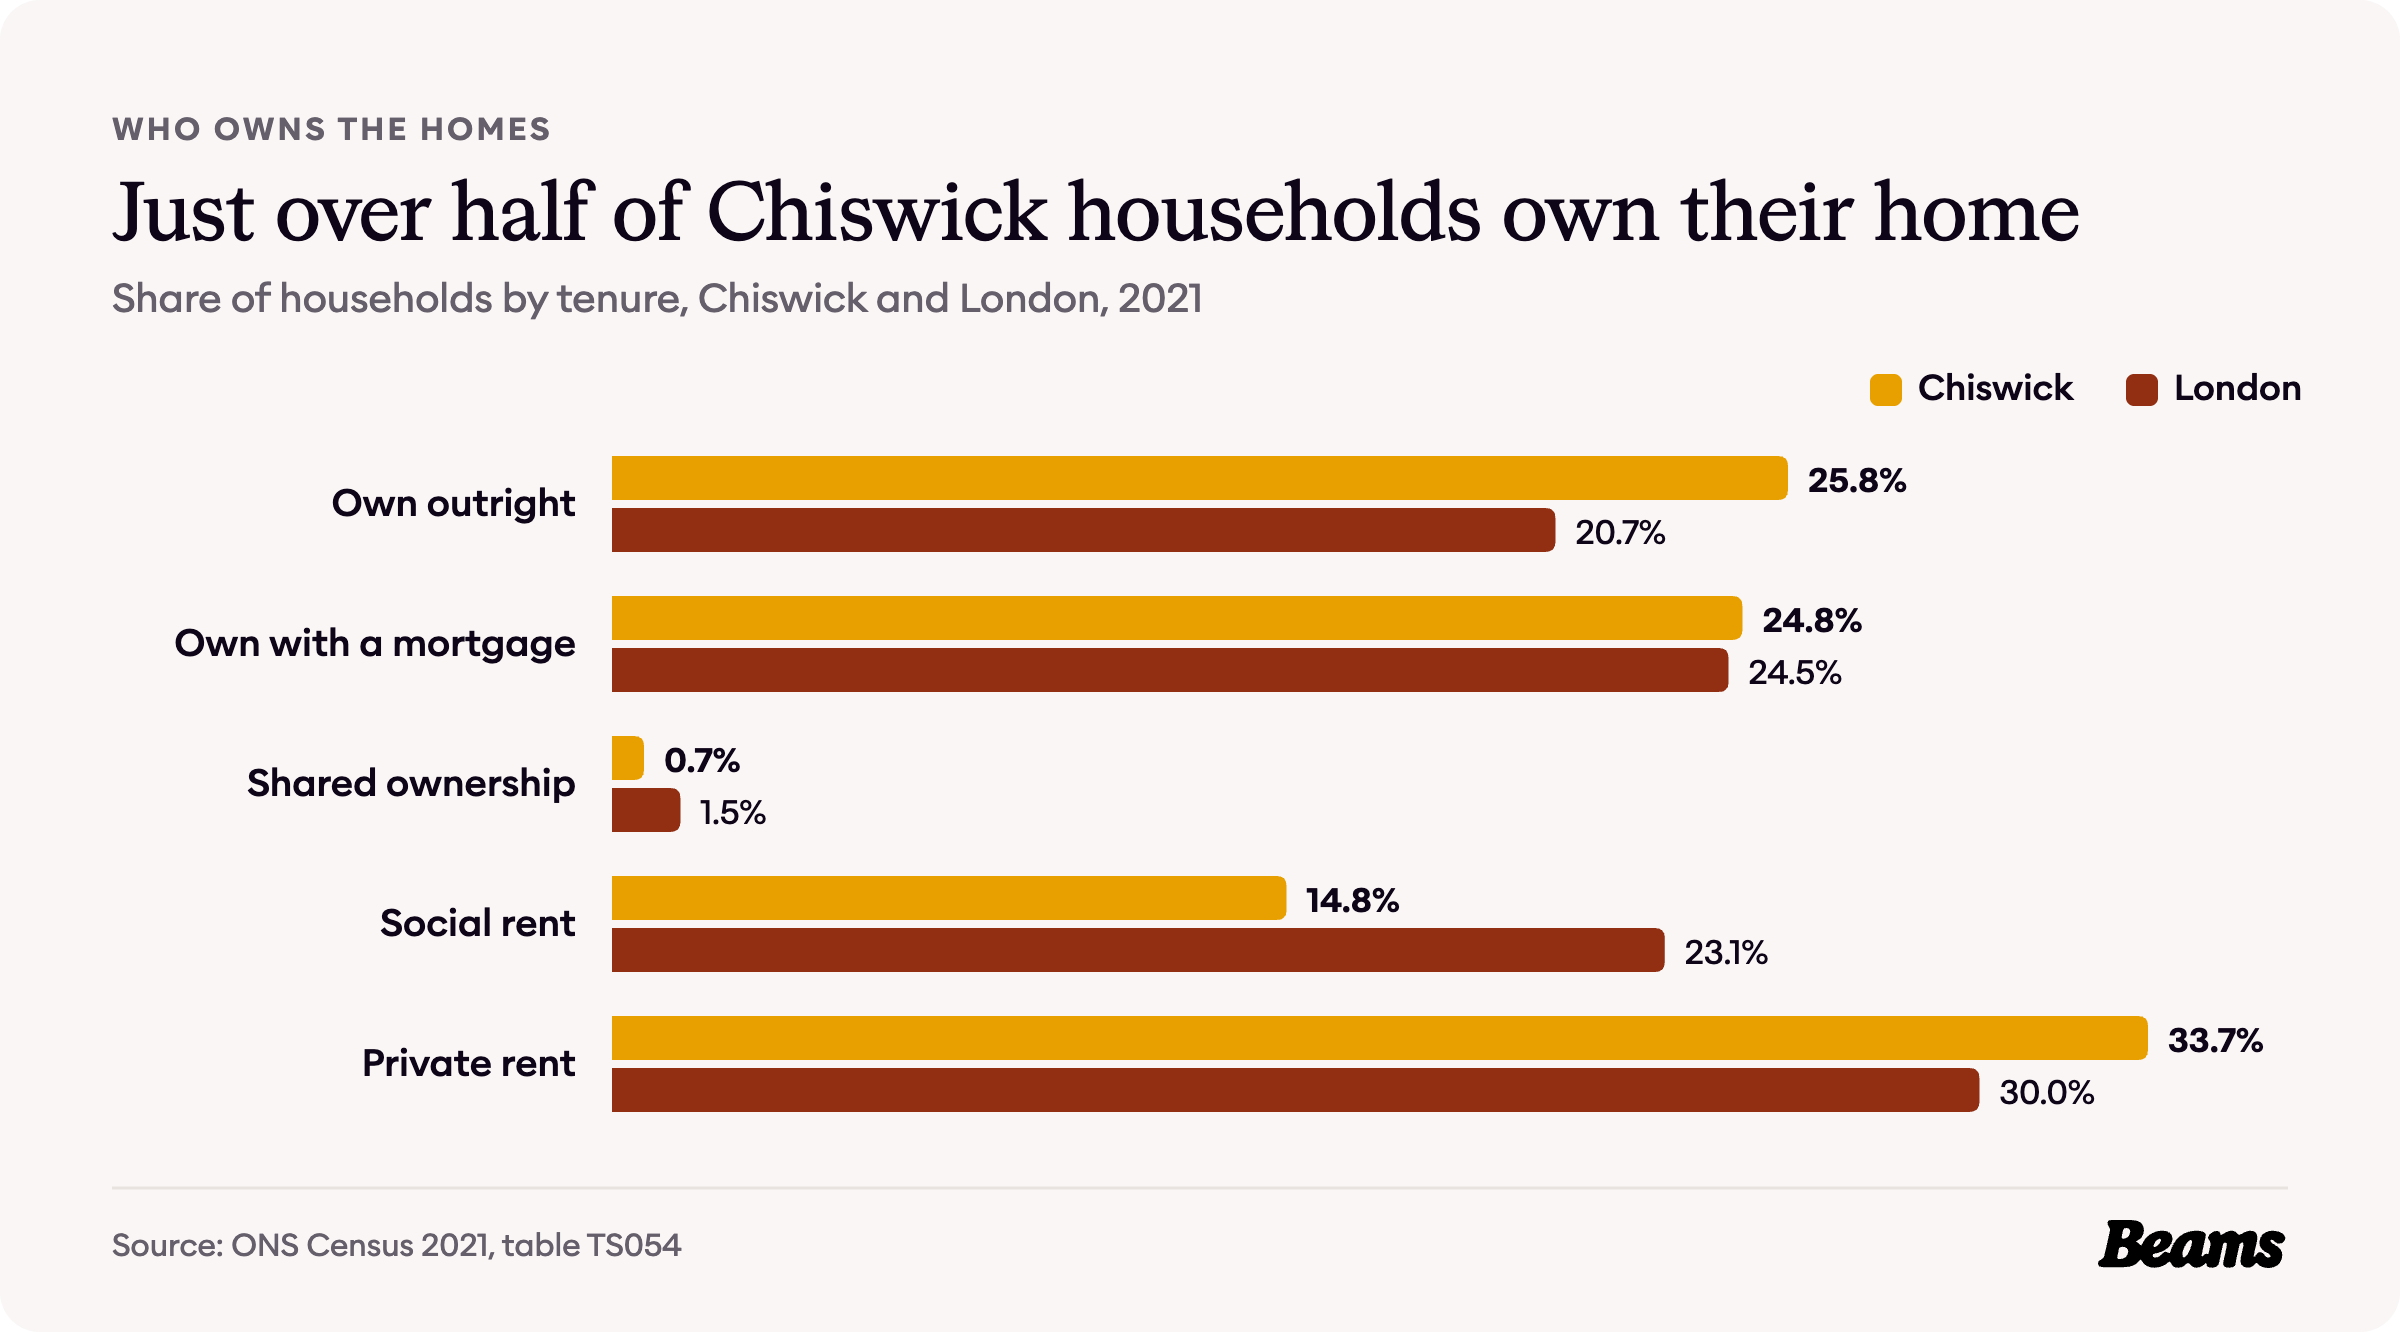
Just over half of Chiswick households own their home. 25.8% own outright and 24.8% with a mortgage, 50.6% in all, against 45.2% across London [4].
Private renters make up 33.7% of households, a little above London's 30.0%, while 14.8% rent from the council or a housing association, well below London's 23.1% [4].
What a home costs in Chiswick
The UK House Price Index and the rent figures below cover the whole borough of Hounslow, which stretches well beyond Chiswick. The census and VOA figures on this page cover the Chiswick North East, Chiswick South East, Chiswick South West and Chiswick Park areas, and the local sale prices cover the W4 postcode district.
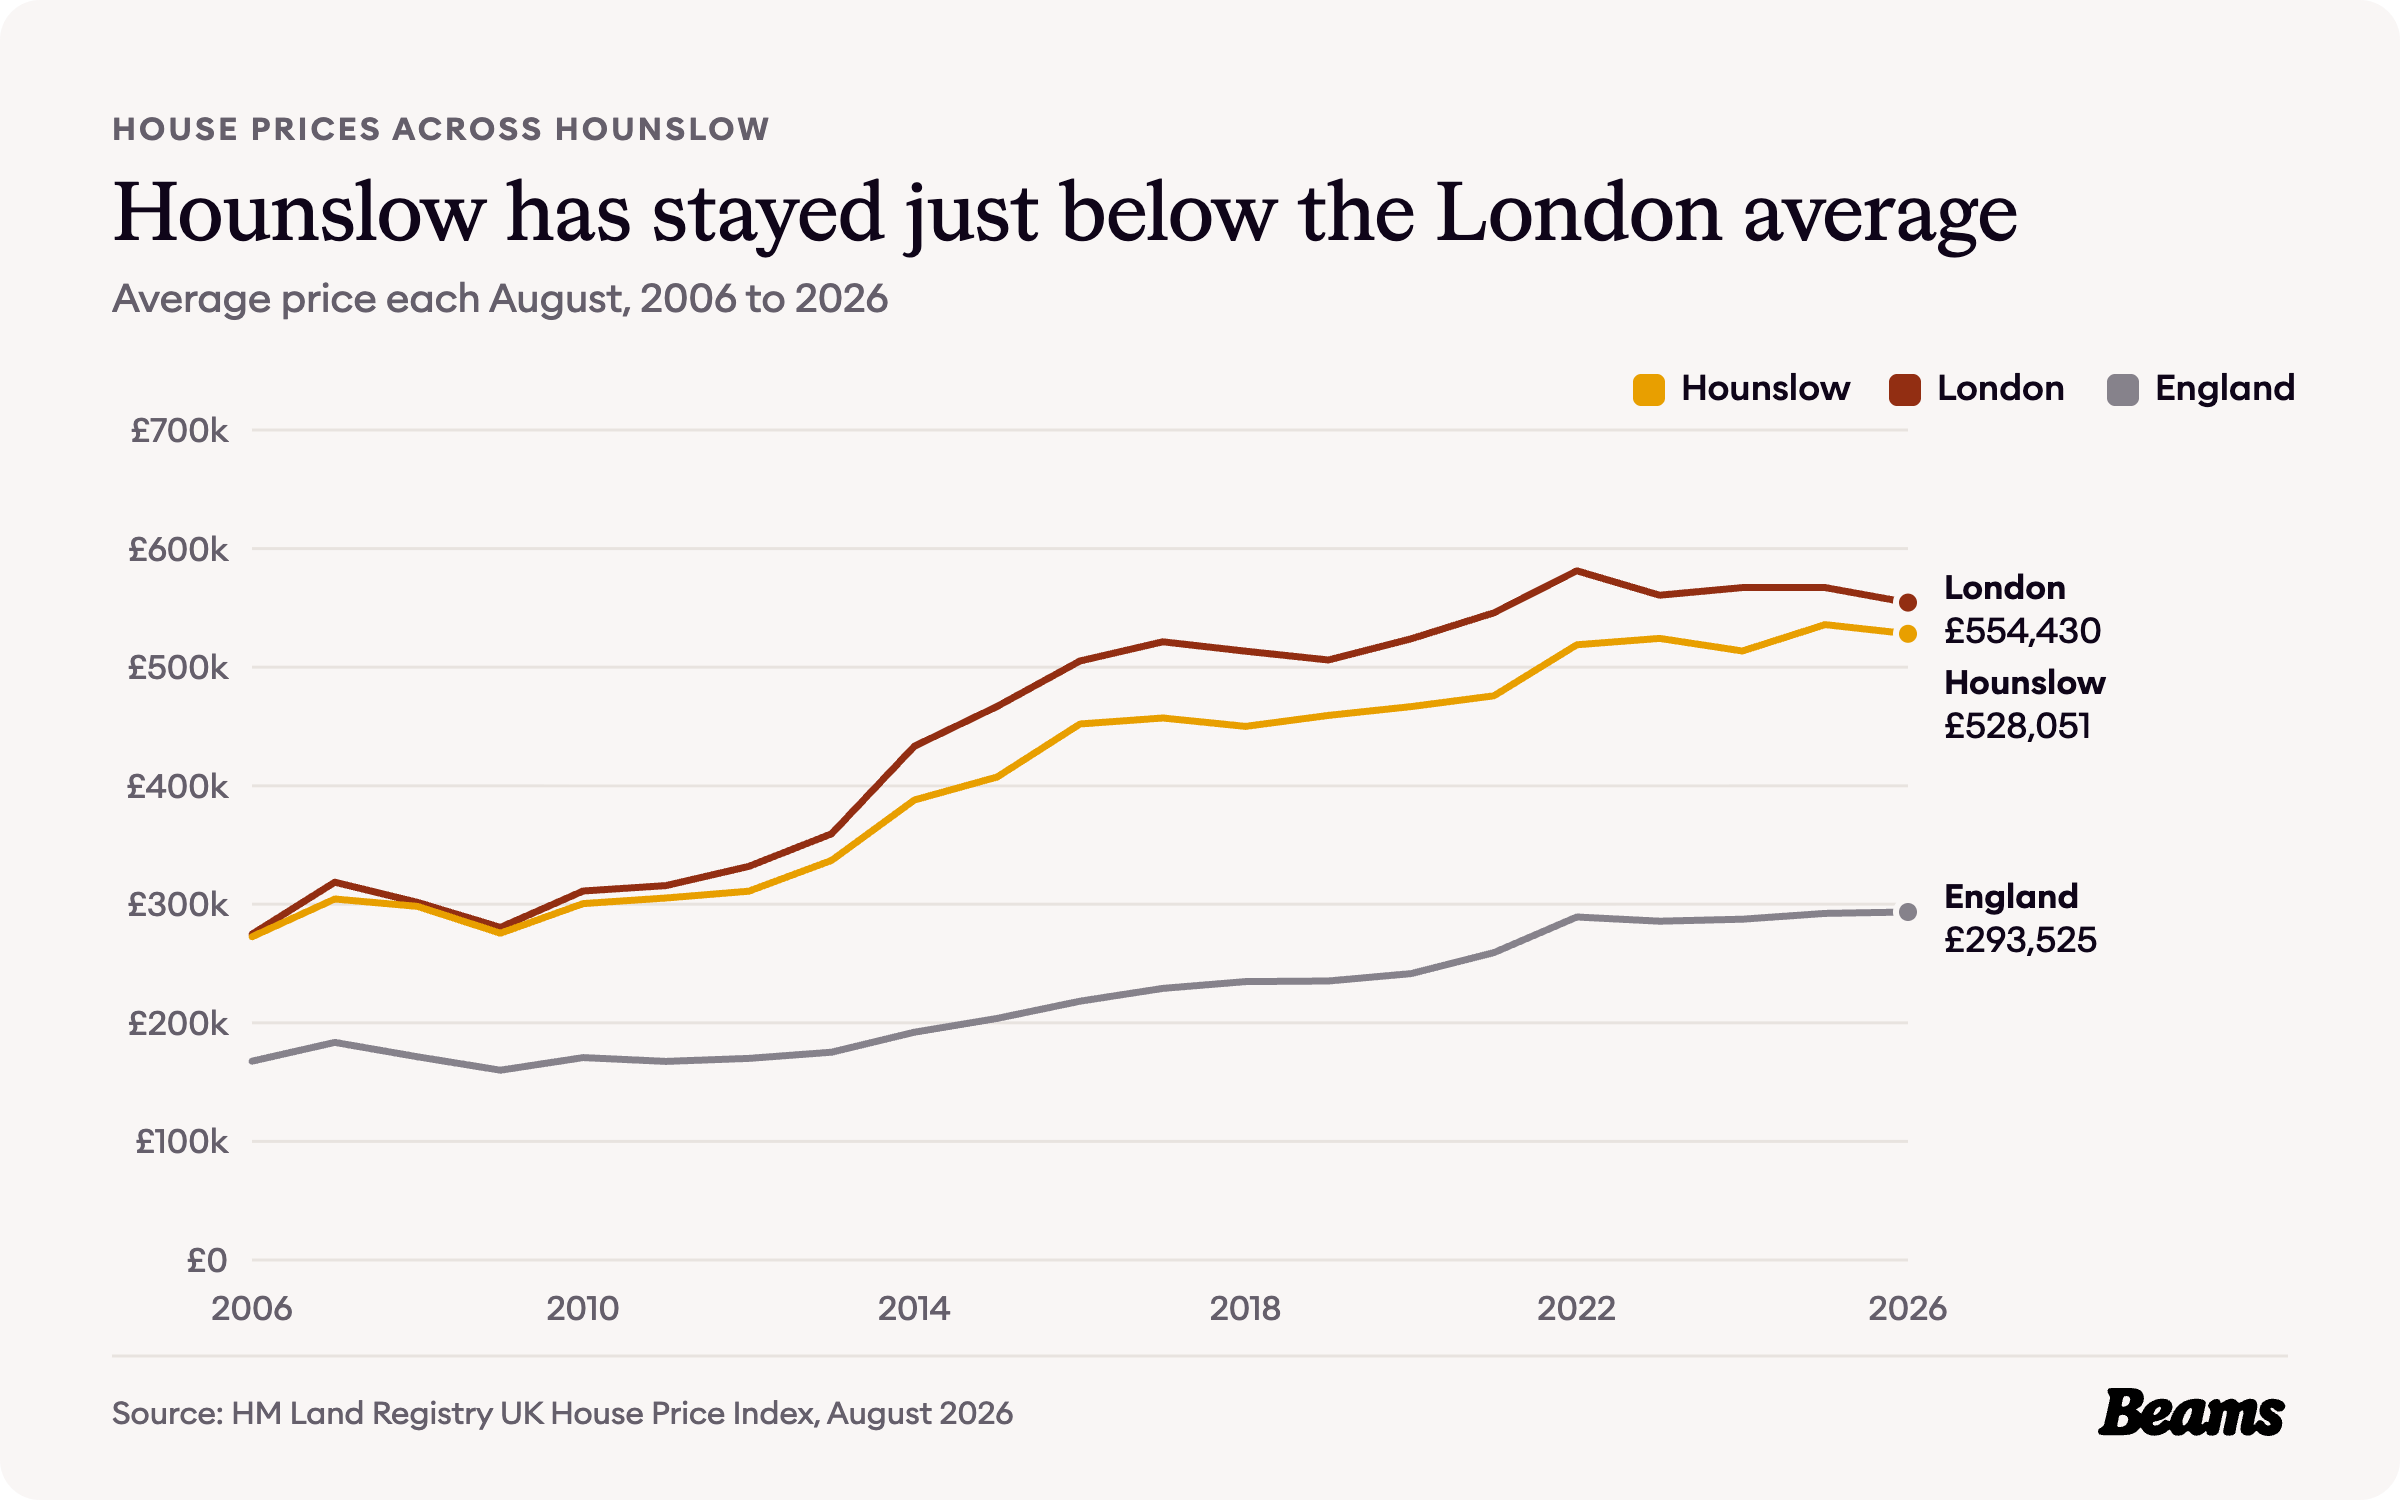
Across Hounslow the average home cost £528,051 in August 2026, 1.5% less than a year earlier [5]. That is about 5% below the London average of £554,430 and 1.8 times the England average of £293,525 [6].
The borough has tracked just below London for 20 years. In August 2006 its average home cost £272,531, against £274,815 for London, and it has stayed below the London average every August since. Prices across Hounslow peaked at £535,825 in 2025 [6].
Flats, terraces and the gap between them
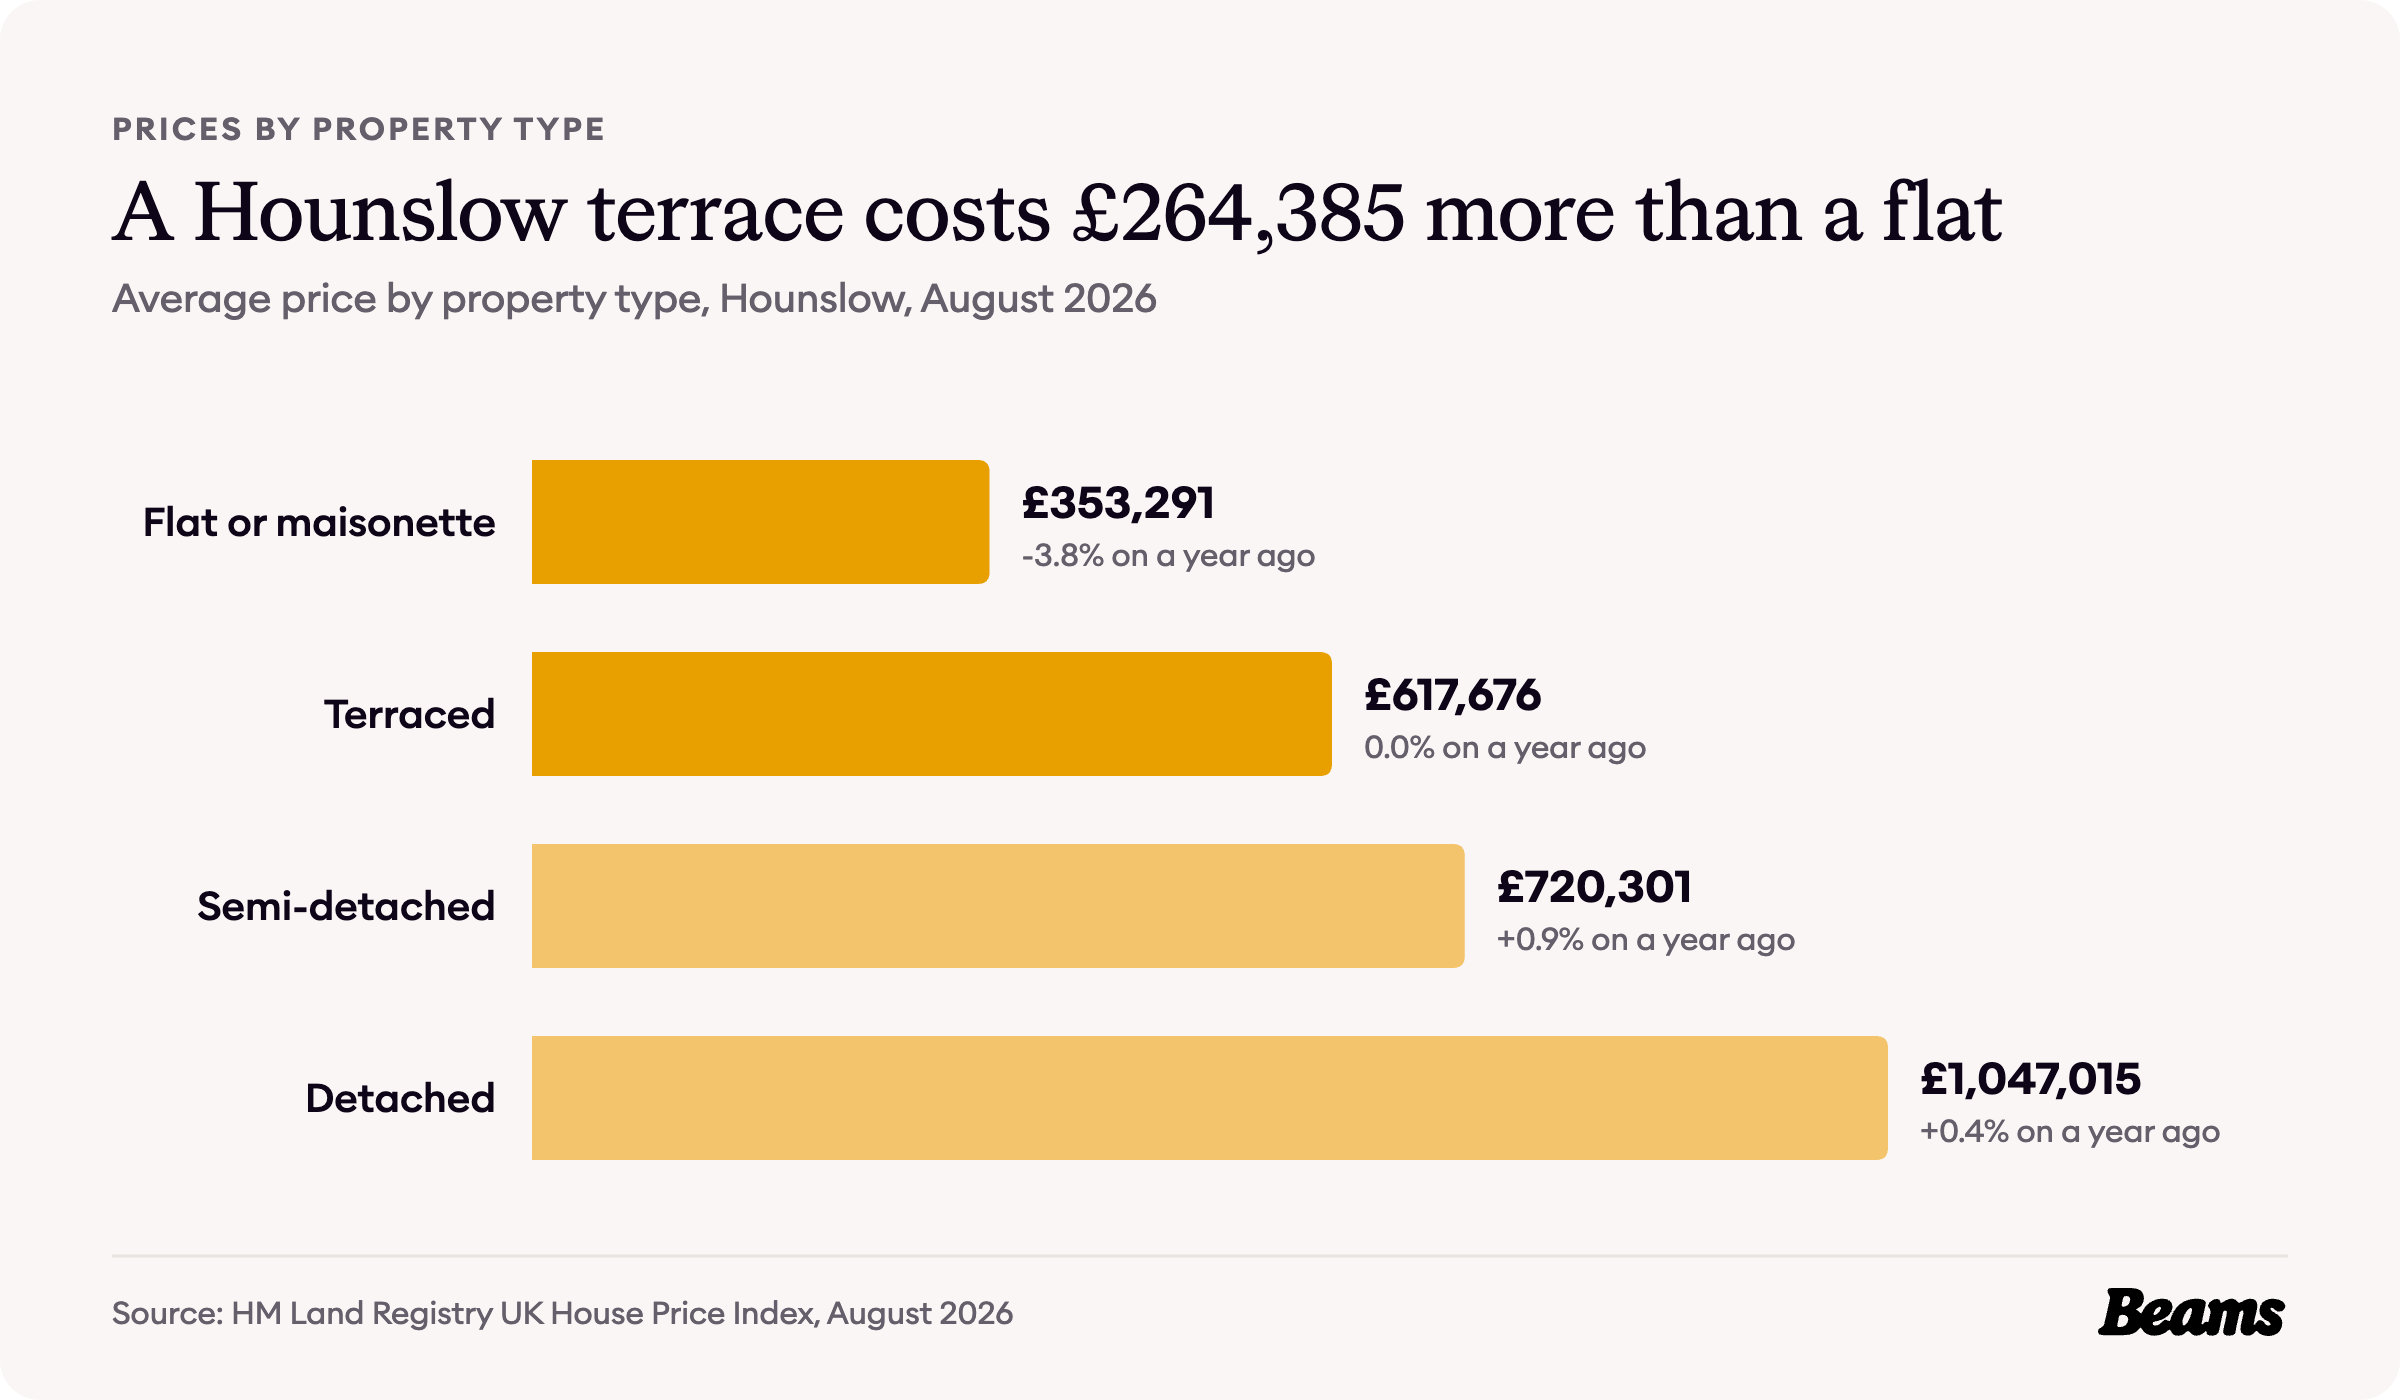
Across the borough a flat or maisonette averaged £353,291 in August 2026 and a terraced house £617,676, a gap of £264,385 [5]. Semi-detached homes averaged £720,301 and detached homes £1,047,015. First-time buyers paid an average of £460,699, while owners moving home paid £649,599 [5].
What homes sold for in W4
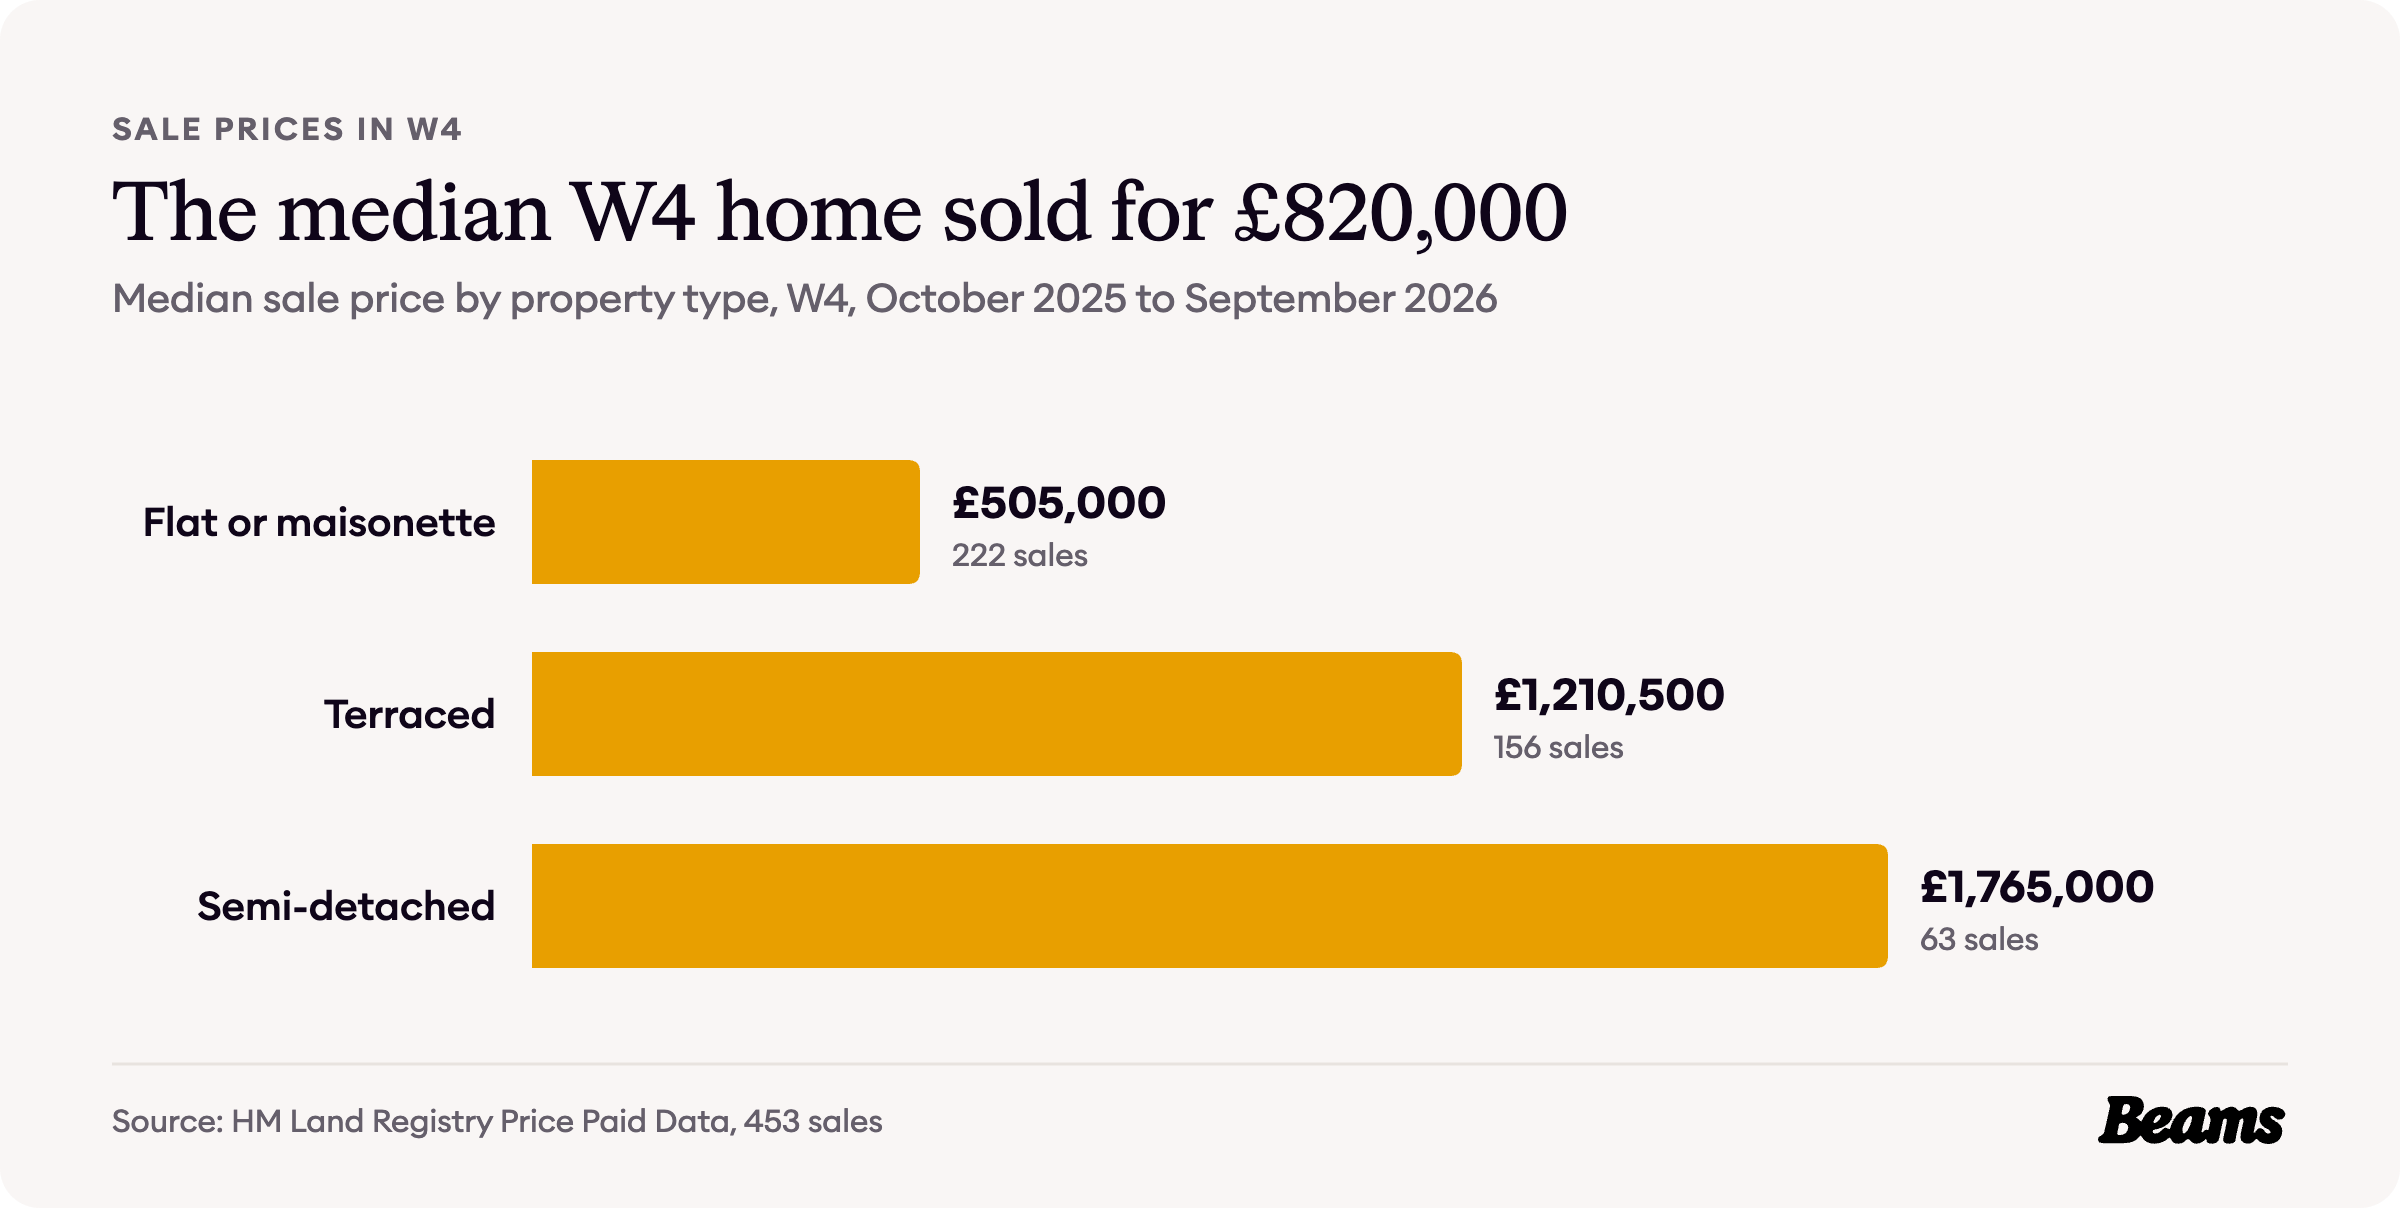
Chiswick prices run well above those borough averages. Land Registry recorded 453 sales in the W4 postcode district between October 2025 and September 2026, at a median price of £820,000 [7].
Flats made up 222 of those sales, at a median of £505,000. The 156 terraced houses sold for a median of £1,210,500 and the 63 semi-detached houses for £1,765,000 [7]. With £705,500 between the median flat and the median terrace, and another £554,500 between a terrace and a semi, a house extension in Chiswick adds room without paying for the next rung of the ladder.
What it costs to rent
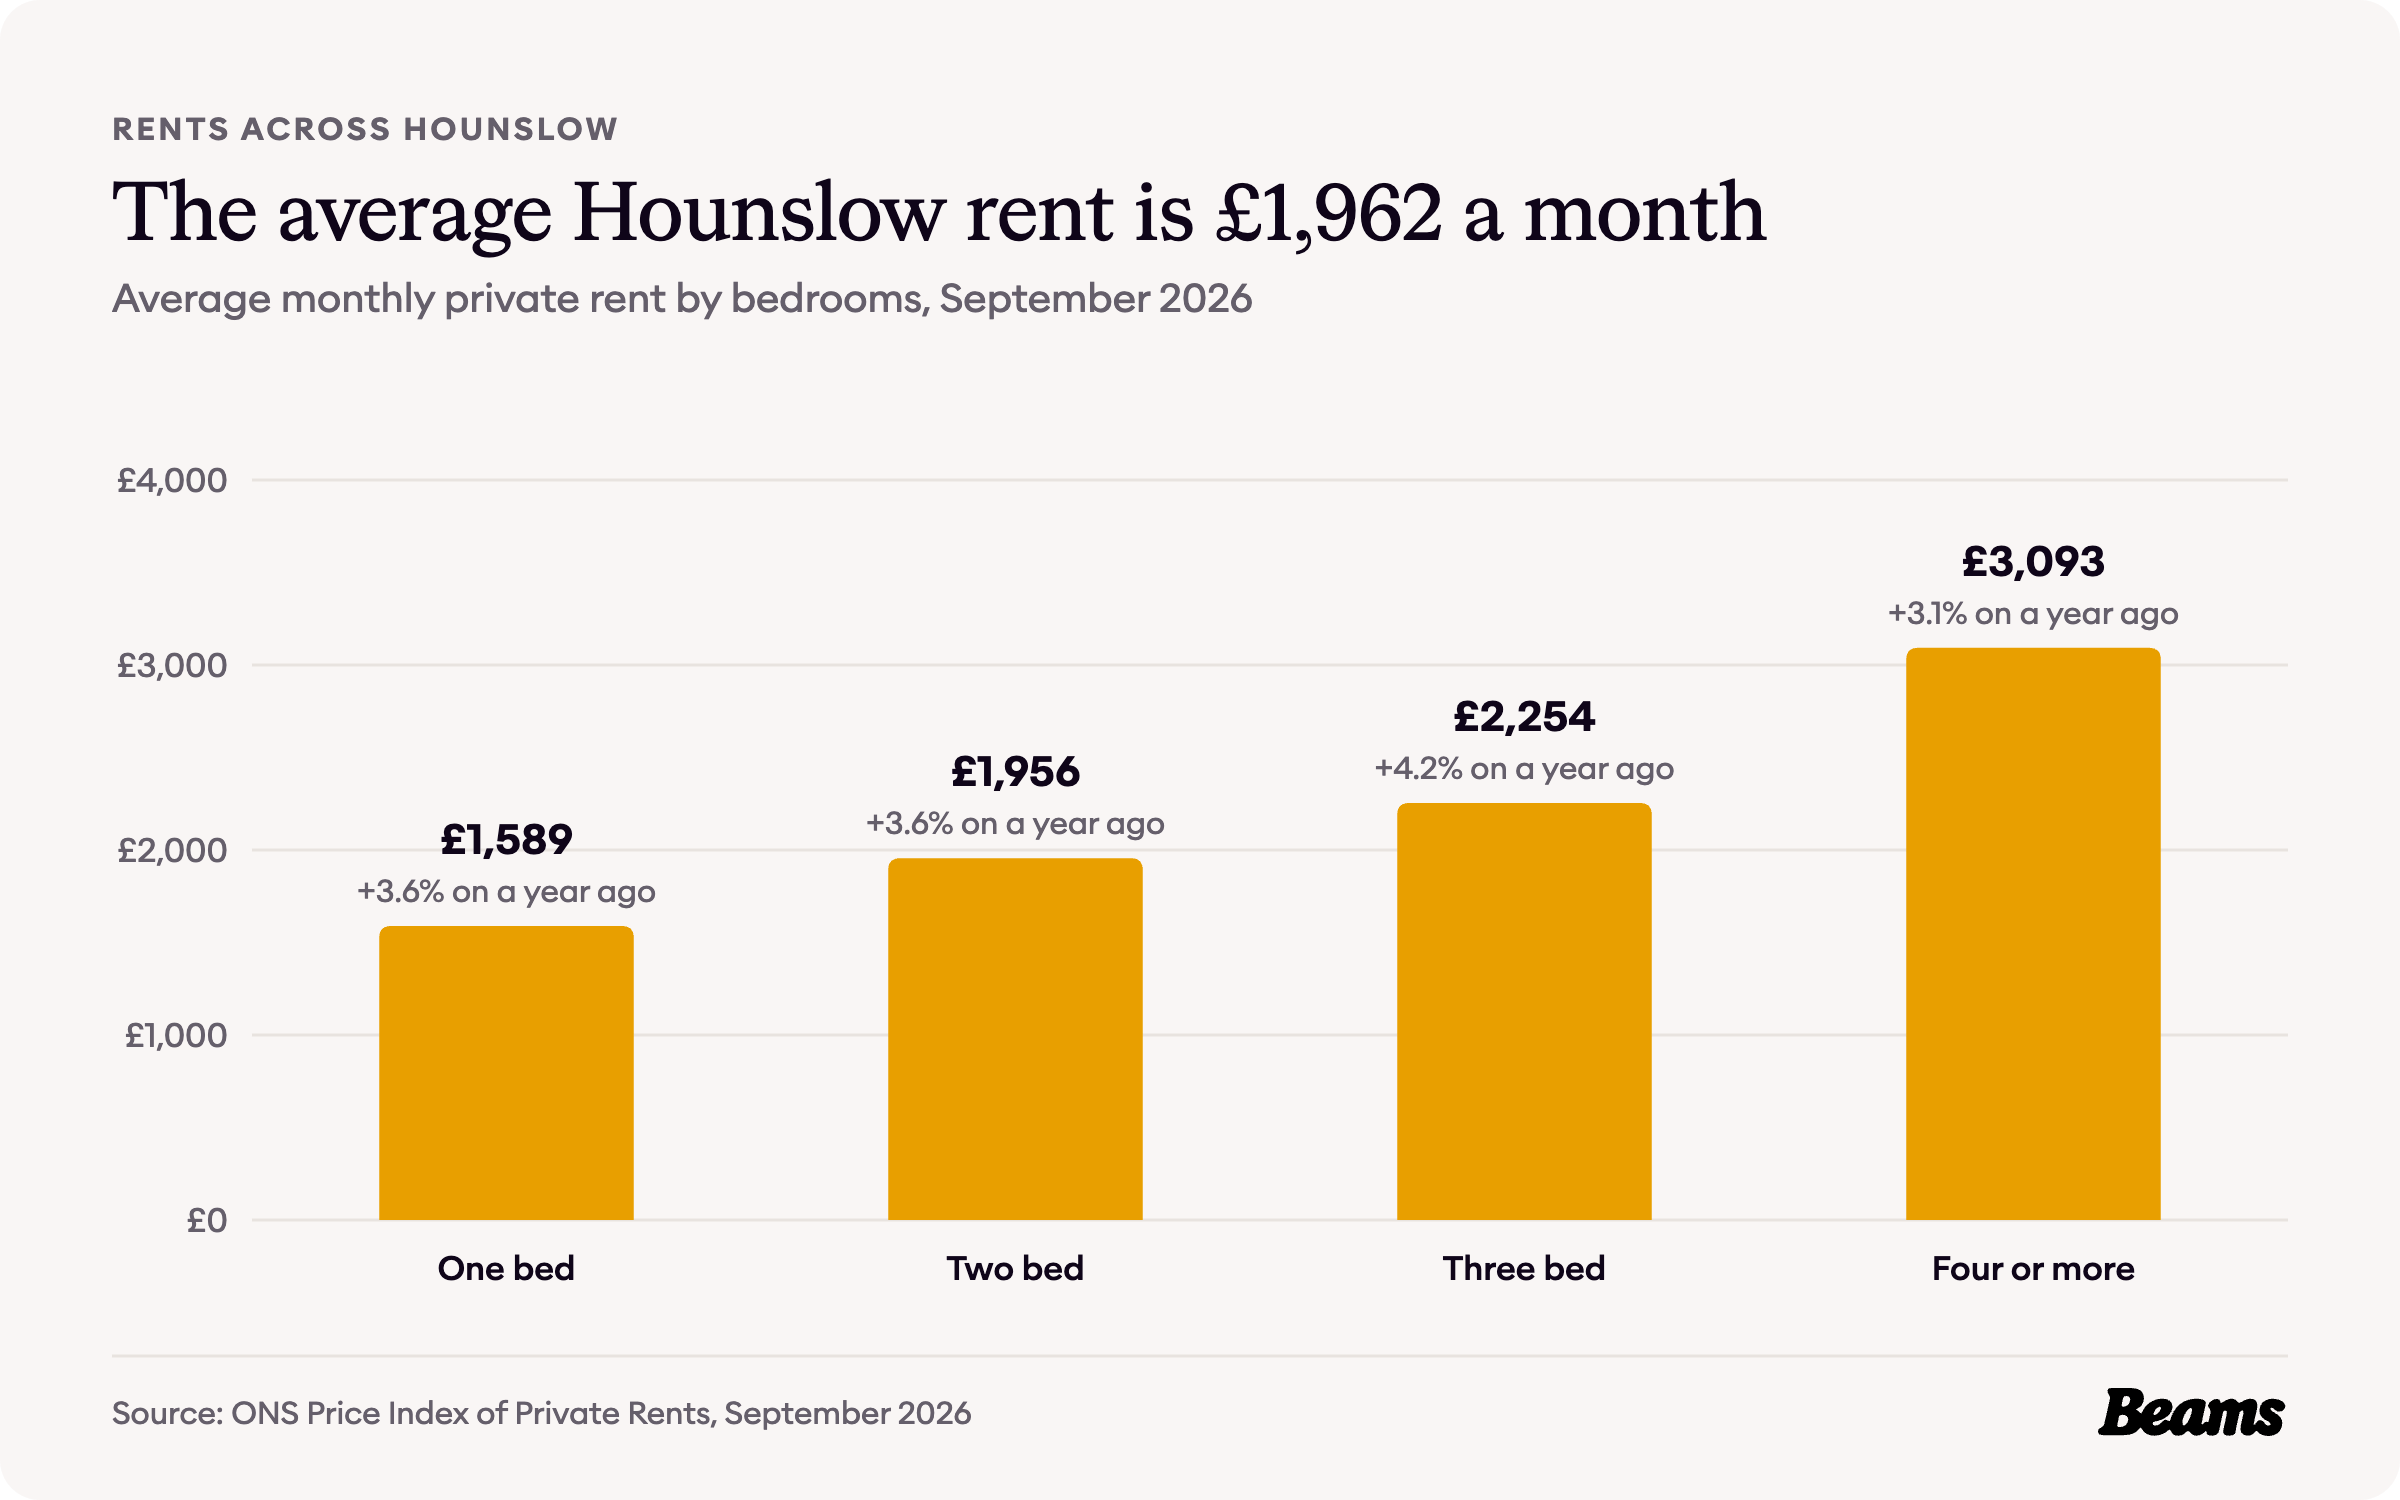
The average private rent across Hounslow was £1,962 a month in September 2026, up 3.6% on a year earlier [5]. A one-bedroom home averaged £1,589 a month, a three-bedroom home £2,254 and a home with four or more bedrooms £3,093. These are borough figures, so they cover Hounslow as a whole rather than Chiswick alone.
Council Tax bands
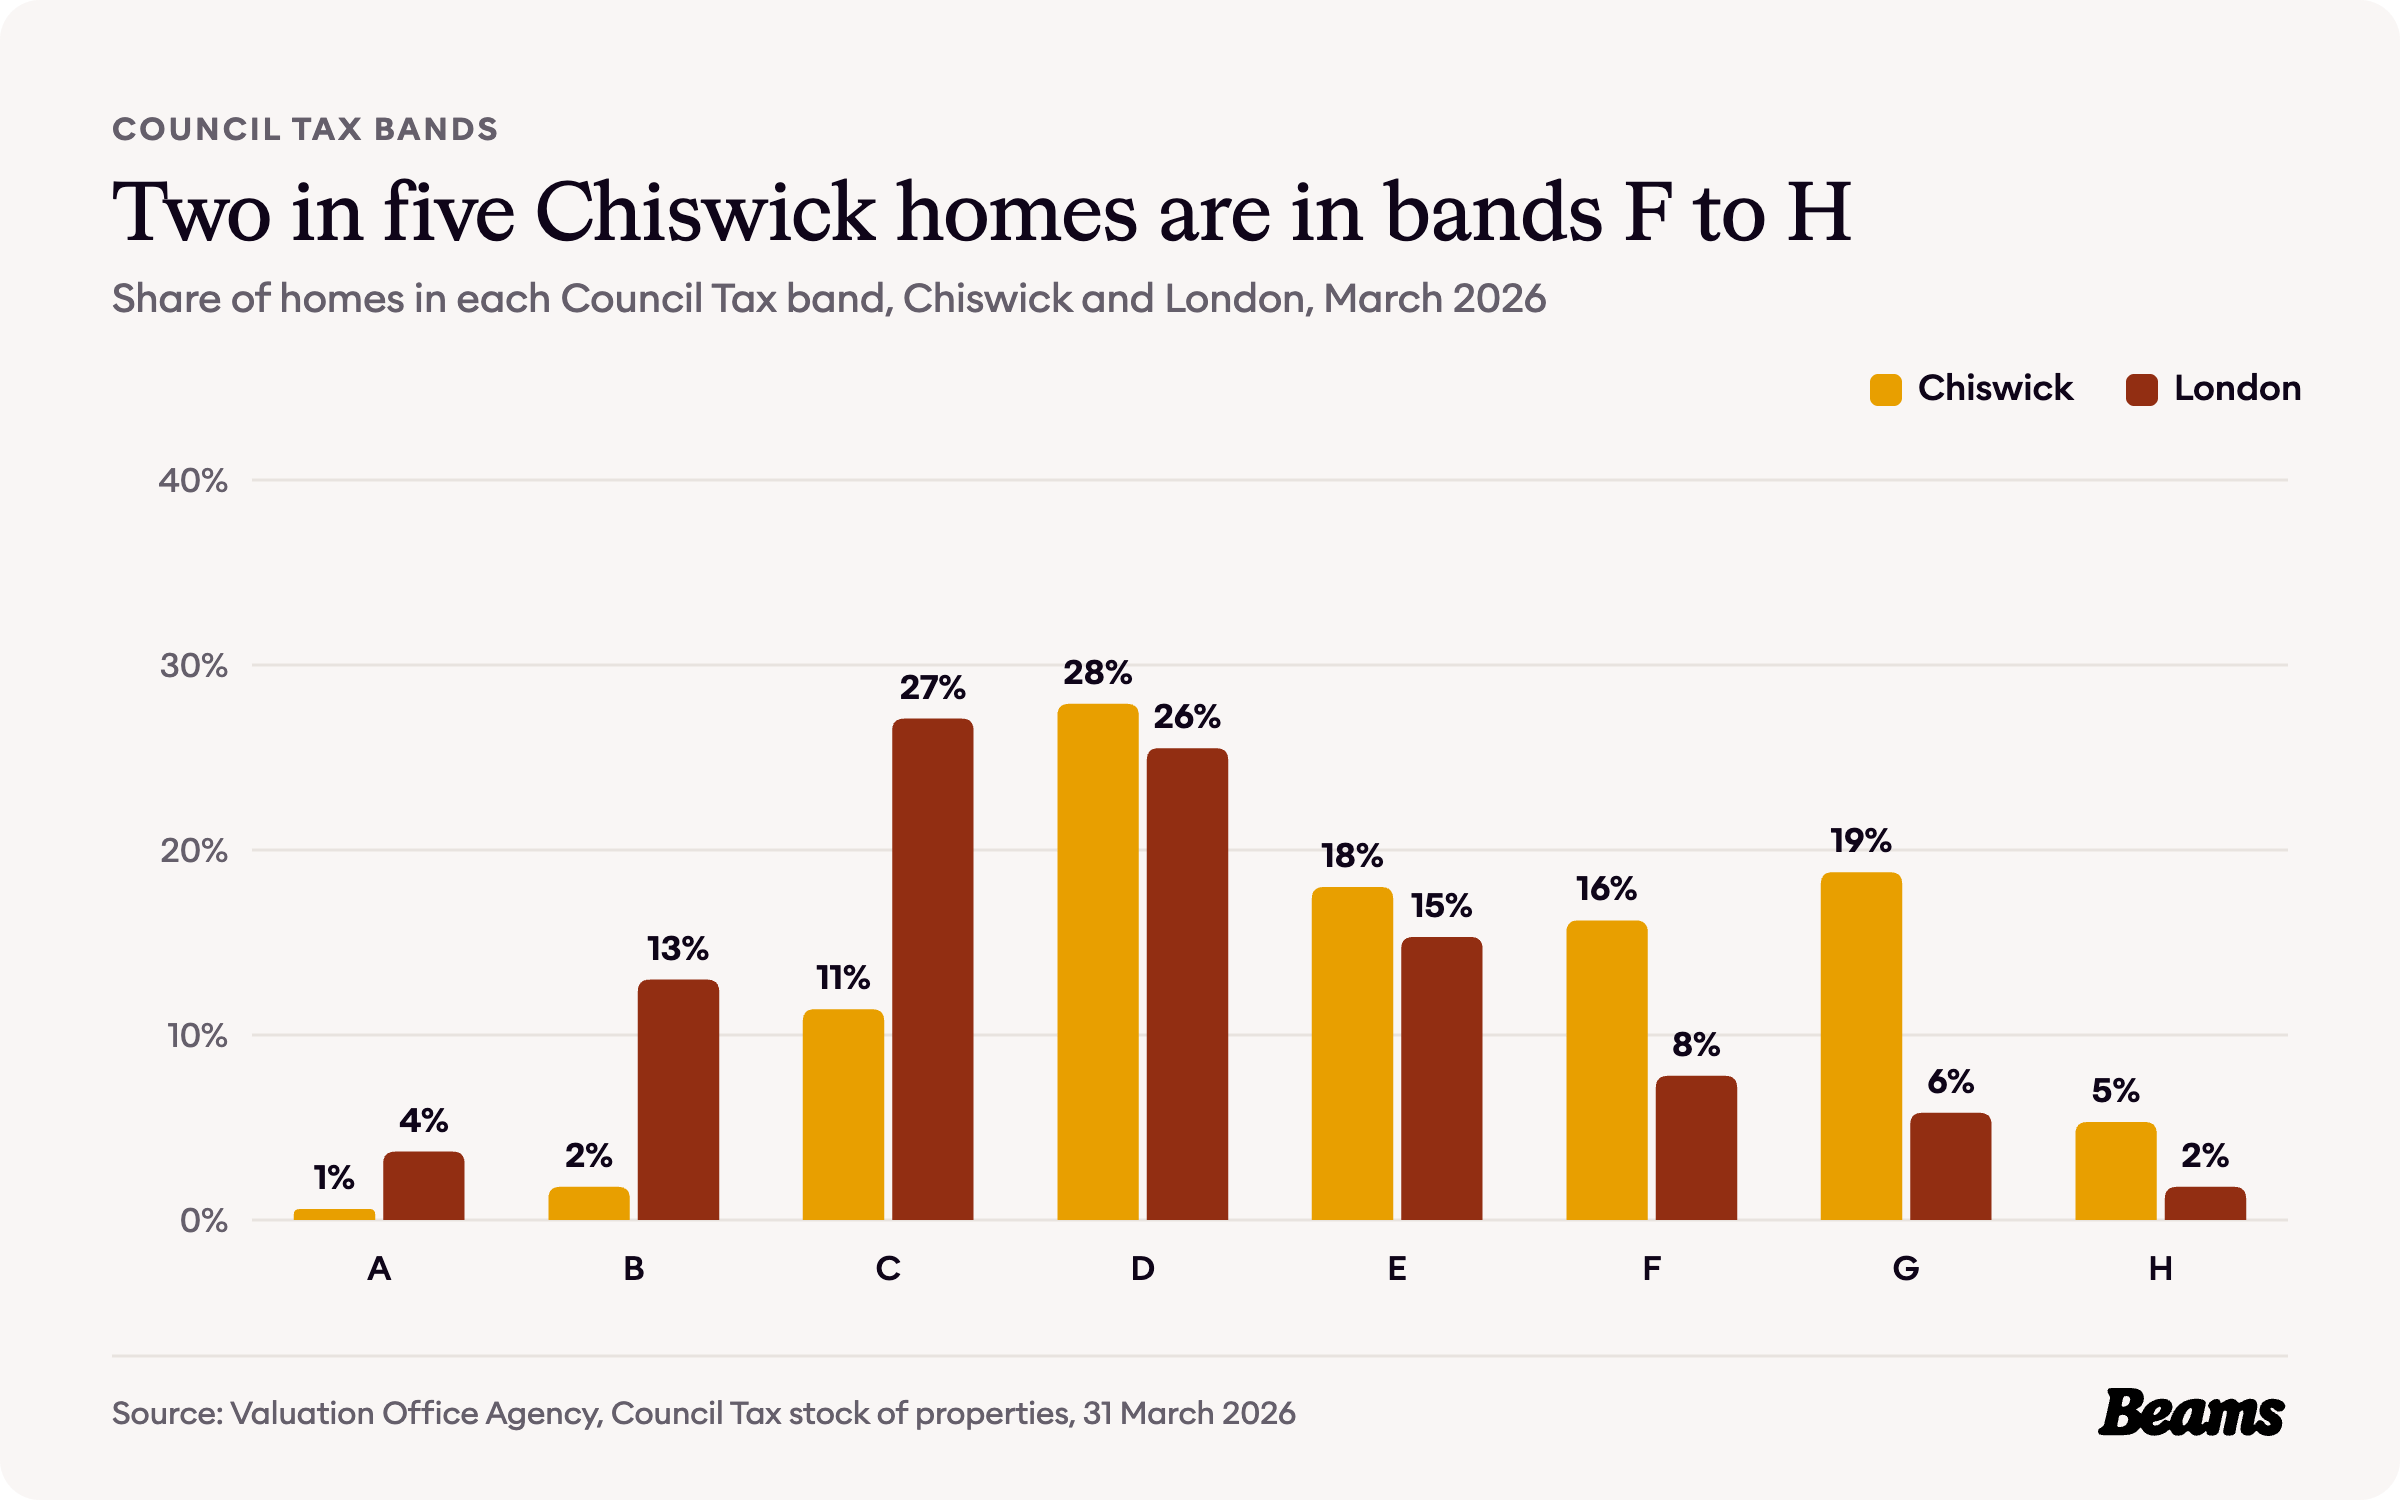
Chiswick's homes sit high up the Council Tax scale. Band D is the most common band, at 27.9% of homes, but 40.3% are in bands F to H, against 15.4% across London. Band G alone covers 18.8% of homes, more than three times London's 5.8% [2].
Only 2.4% of Chiswick homes are in bands A and B, compared with 16.7% for London [2]. Larger, higher-value period homes are often where interior design in Chiswick makes the biggest difference, settling the layout and finishes before building starts.
The rules on your street
Hounslow has 29 conservation areas [8]. The council's list includes Bedford Park, Chiswick High Road, Chiswick House, Grove Park, Old Chiswick, Stamford Brook, Strand on the Green and Turnham Green [9].
Bedford Park has extra protection. Article 4 Directions cover all properties in the Bedford Park and Gunnersbury Park conservation areas, so owners need planning permission for many changes that would not need it elsewhere, and the council pays close attention to windows, doors, roofs and porches [10]. In any conservation area, demolishing a building always needs planning permission [8]. Since 4 September 2023 a further Article 4 Direction across most of the borough has meant that turning a family house into a small house in multiple occupation needs planning permission too [10]. Digging down is one of the jobs where these rules matter most, so a basement conversion in Chiswick starts with a check of the address.
Hounslow gives 8 to 13 weeks as its standard timescale for a decision. For an extra £600, its fast-track service decides householder applications that fit its local plan and design guidance within one week of the consultation period ending [11]. Our builders in Chiswick and planners check what applies to your address before any work begins.
Chiswick housing statistics at a glance
- Average house price, Hounslow, August 2026: £528,051 (London £554,430) [5] [6]
- Change on a year earlier: -1.5% (London -2.2%) [5] [6]
- Median sale price, W4, October 2025 to September 2026: £820,000 [7]
- Median terraced house sale, W4: £1,210,500 [7]
- Average private rent, Hounslow, September 2026: £1,962 a month [5]
- Homes built before 1919: 51.1% (London 29.0%) [2]
- Homes in Council Tax bands F to H: 40.3% (London 15.4%) [2]
- Households living in a flat: 56.6% (London 54.0%) [3]
- Households who own their home: 50.6% (London 45.2%) [4]
- Conservation areas in Hounslow: 29 [8]
Frequently asked questions
References
- British History Online, Chiswick: Growth. Victoria County History of Middlesex, volume 7.
- Valuation Office Agency, Council Tax: stock of properties 2026. Properties by build period and by Council Tax band at 31 March 2026, Chiswick census areas and London.
- ONS, Census 2021 table TS044: Accommodation type. Households by type of home, Chiswick census areas and London.
- ONS, Census 2021 table TS054: Tenure. Households by tenure, Chiswick census areas and London.
- ONS, Housing prices in Hounslow. UK House Price Index for August 2026 and Price Index of Private Rents for September 2026, published 21 October 2026.
- HM Land Registry, UK House Price Index. Average prices for Hounslow, London and England, August 2006 to August 2026.
- HM Land Registry, Price Paid Data. Sales in the W4 postcode district, October 2025 to September 2026.
- Hounslow Council, Conservation areas. Number of conservation areas and the controls that apply in them. Accessed 29 October 2026.
- Hounslow Council, Conservation area appraisals and maps. List of conservation area appraisals. Accessed 29 October 2026.
- Hounslow Council, Article 4 Directions. Bedford Park and Gunnersbury Park directions and the borough-wide HMO direction. Accessed 29 October 2026.
- Hounslow Council, Fast track planning service. Standard and fast-track decision times. Accessed 29 October 2026.
Thinking of improving rather than moving?
Tell us about your Chiswick home and what you want to change. We'll give you a free estimate, then up to three vetted builders quote against the same specification.