
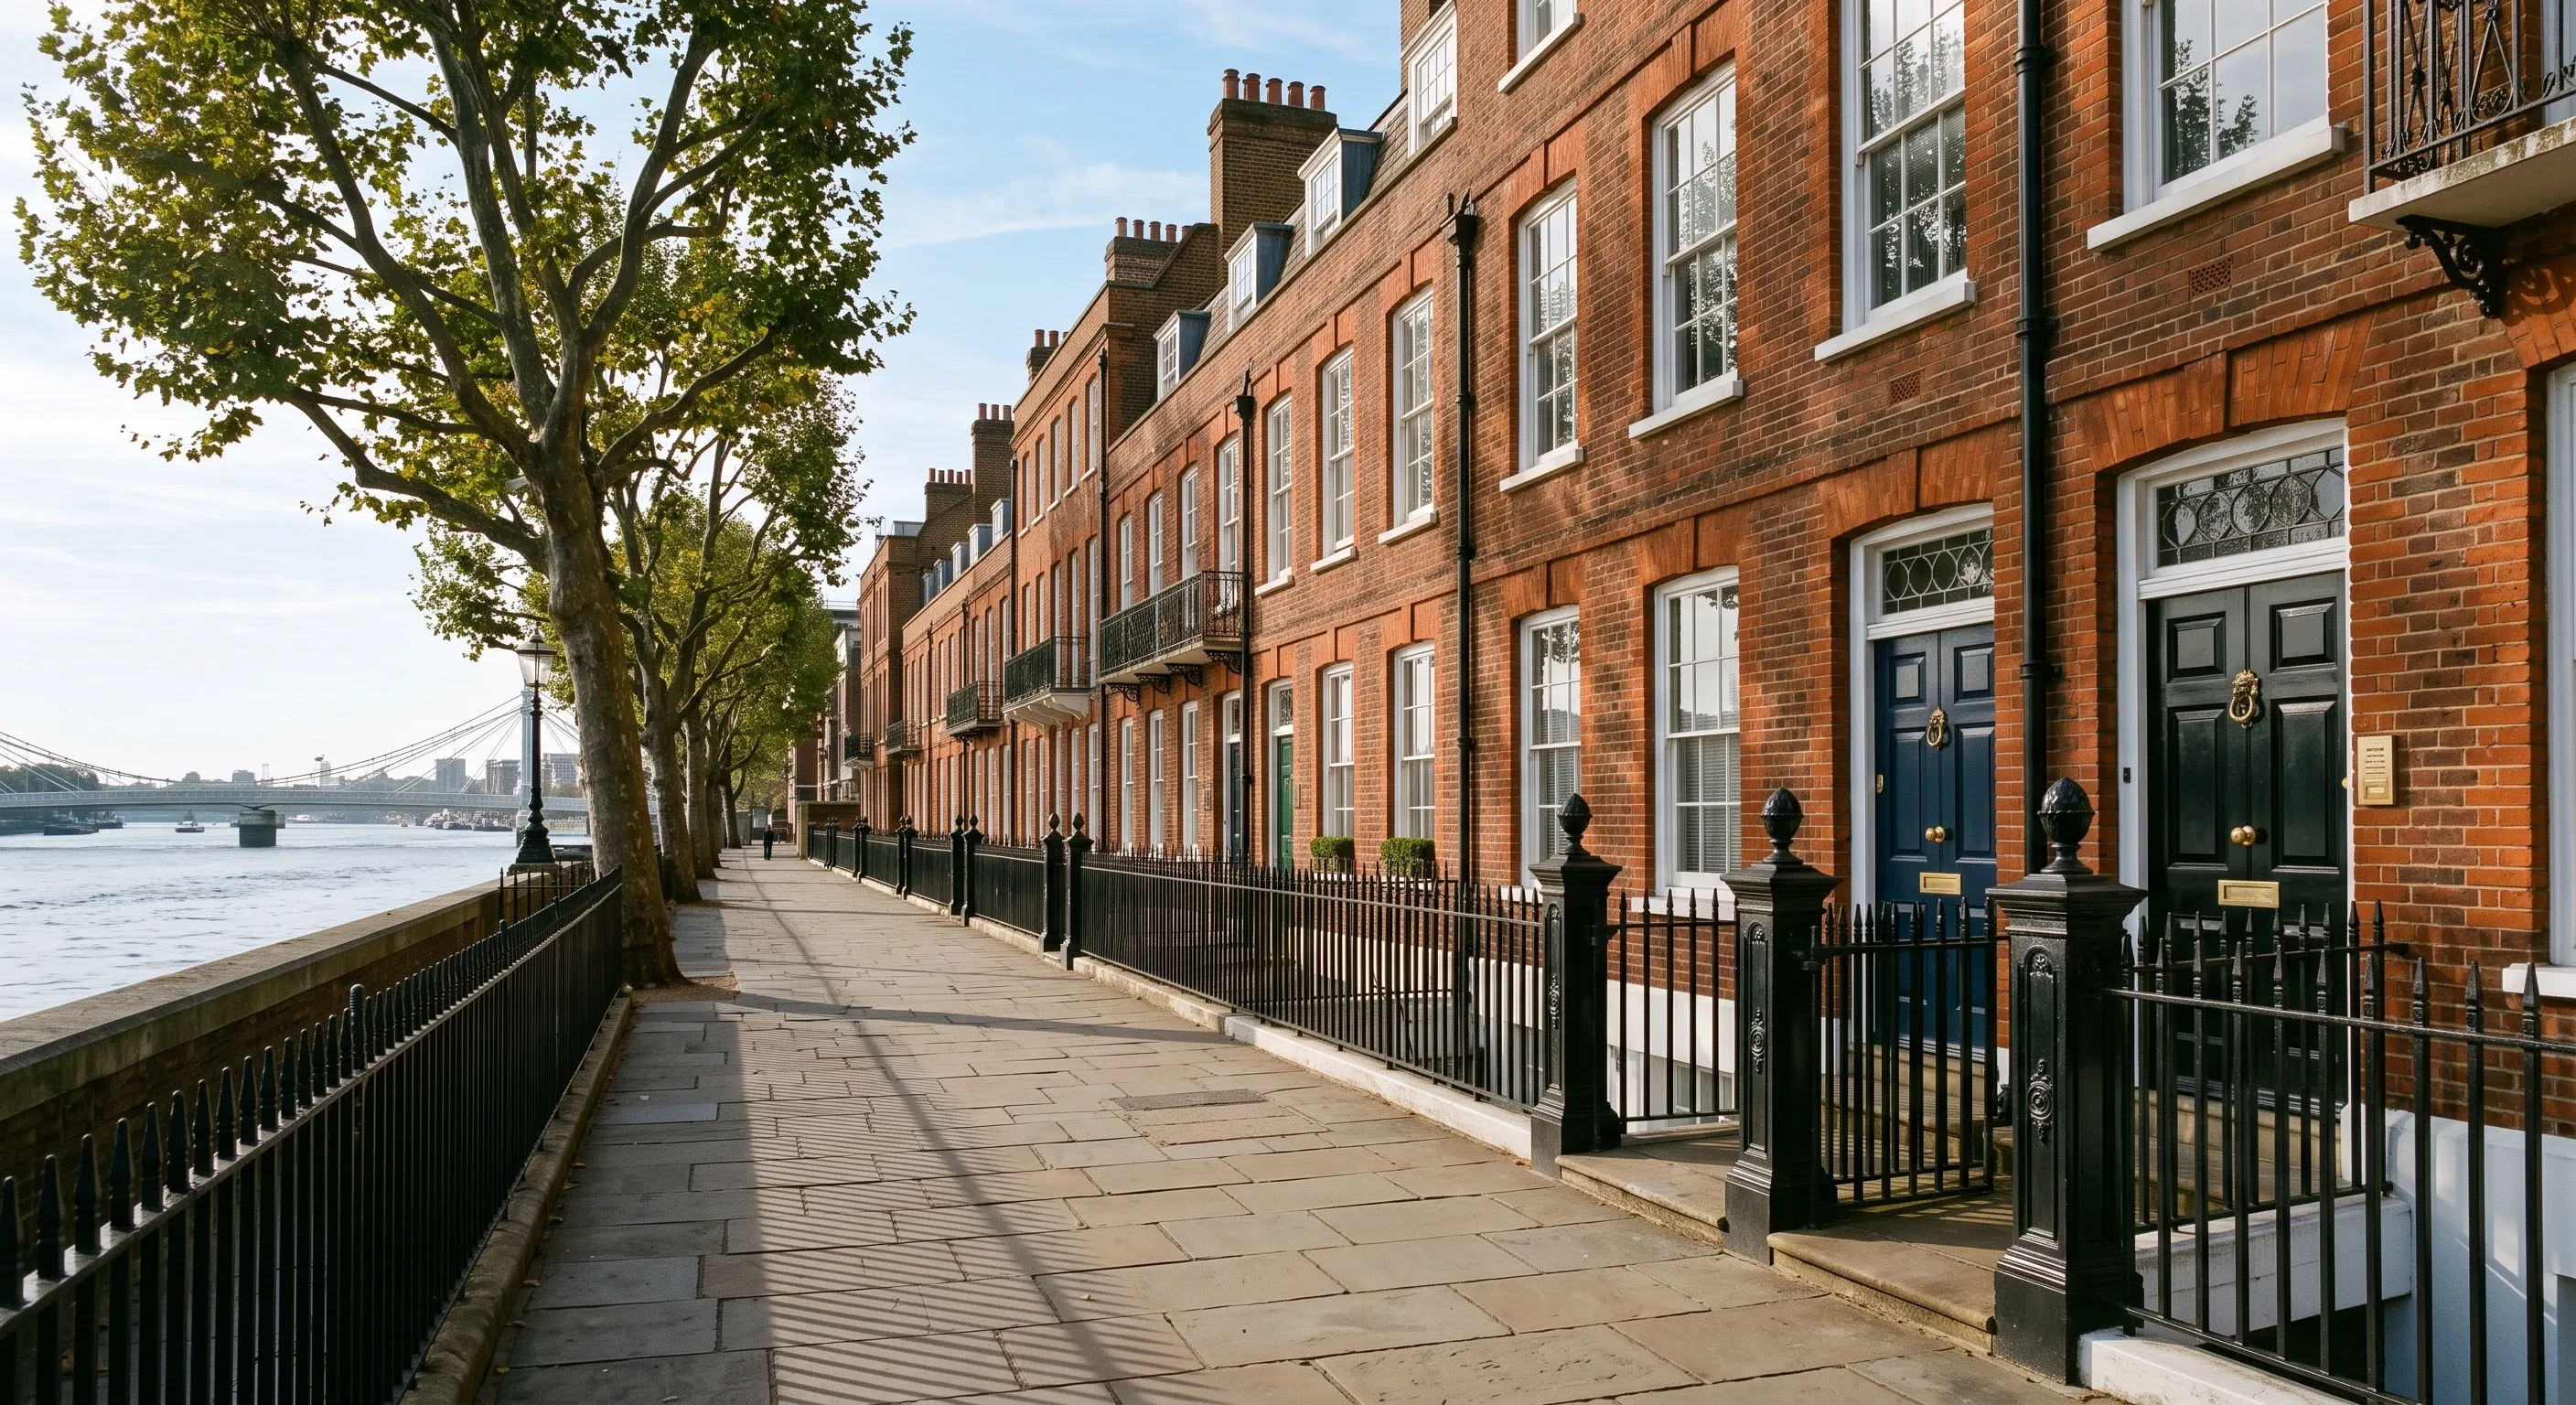
Chelsea housing statistics 2026
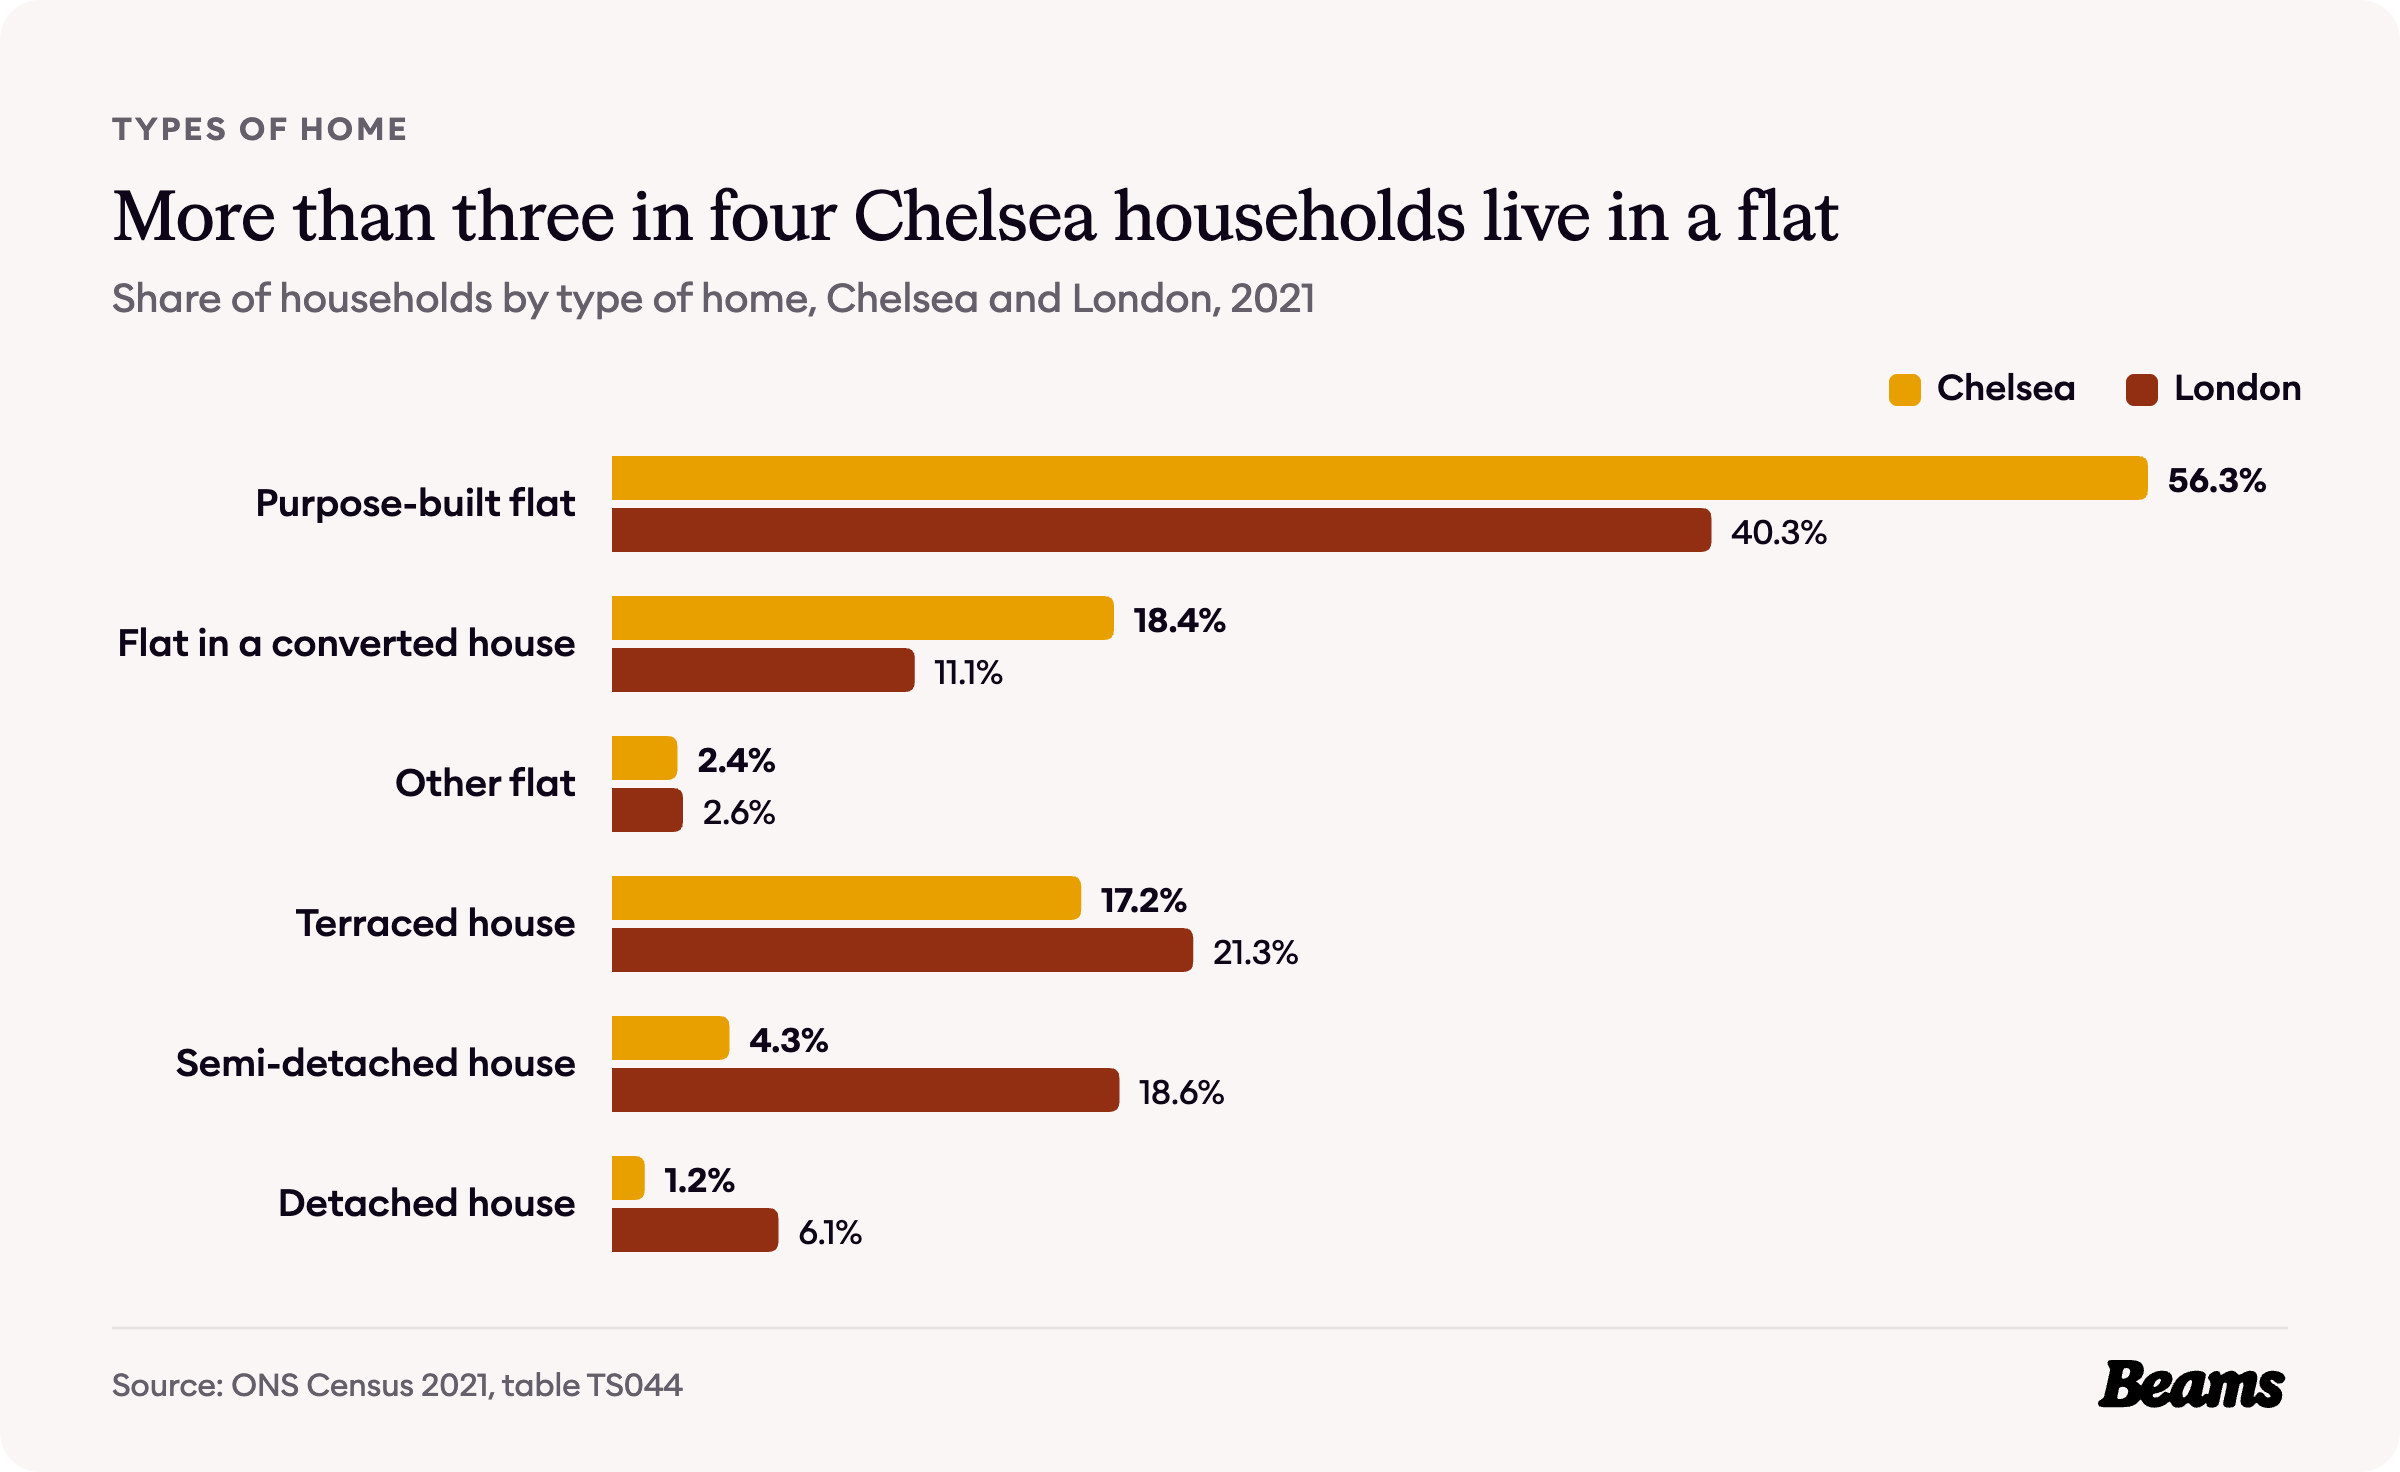
Chelsea filled up around a royal hospital, grew a planned new town and was then rebuilt in red brick, and more than half of its homes now sit in the top two Council Tax bands. These are the numbers behind that story, from Henry Holland's Hans Town to the £1,040,000 median sale price in SW3 and SW10 today.
Each figure below comes from an official source and carries its date, so you know what you are working with before you plan a home renovation in Chelsea. The sources are numbered in brackets and listed in full at the end of the page.
How Chelsea was built
The Royal Hospital changed Chelsea. Its building from 1682 set off a wave of speculative building on land that had never been built on, on a scale new to Chelsea [1]. The number of houses rose from about 172 in 1674 to 350 in 1717, 741 in 1777 and 1,350 in 1795 [1].
Hans Town, which gives one of this page's census areas its name, began as a single scheme. In 1771 Henry Holland the elder, a builder, and his son Henry, an architect, put forward a plan for 89 acres of fields along the eastern edge of the parish, land that belonged to the heirs of Sir Hans Sloane and later became part of the Cadogan estate. By 1791 Holland said 340 houses had been built, with a population of about 1,500. The houses that survive are mostly stock brick, two bays wide and two or three storeys high, with basements and attics [2].
A century later the Cadogan Estate started again. After 1874, rebuilding in the Queen Anne style took place piecemeal over most of the estate, in red brick and terracotta that was radically different from the stock brick and stucco already there. The 54 houses of Lennox Gardens were under construction in 1882 and finished by 1886 [3].
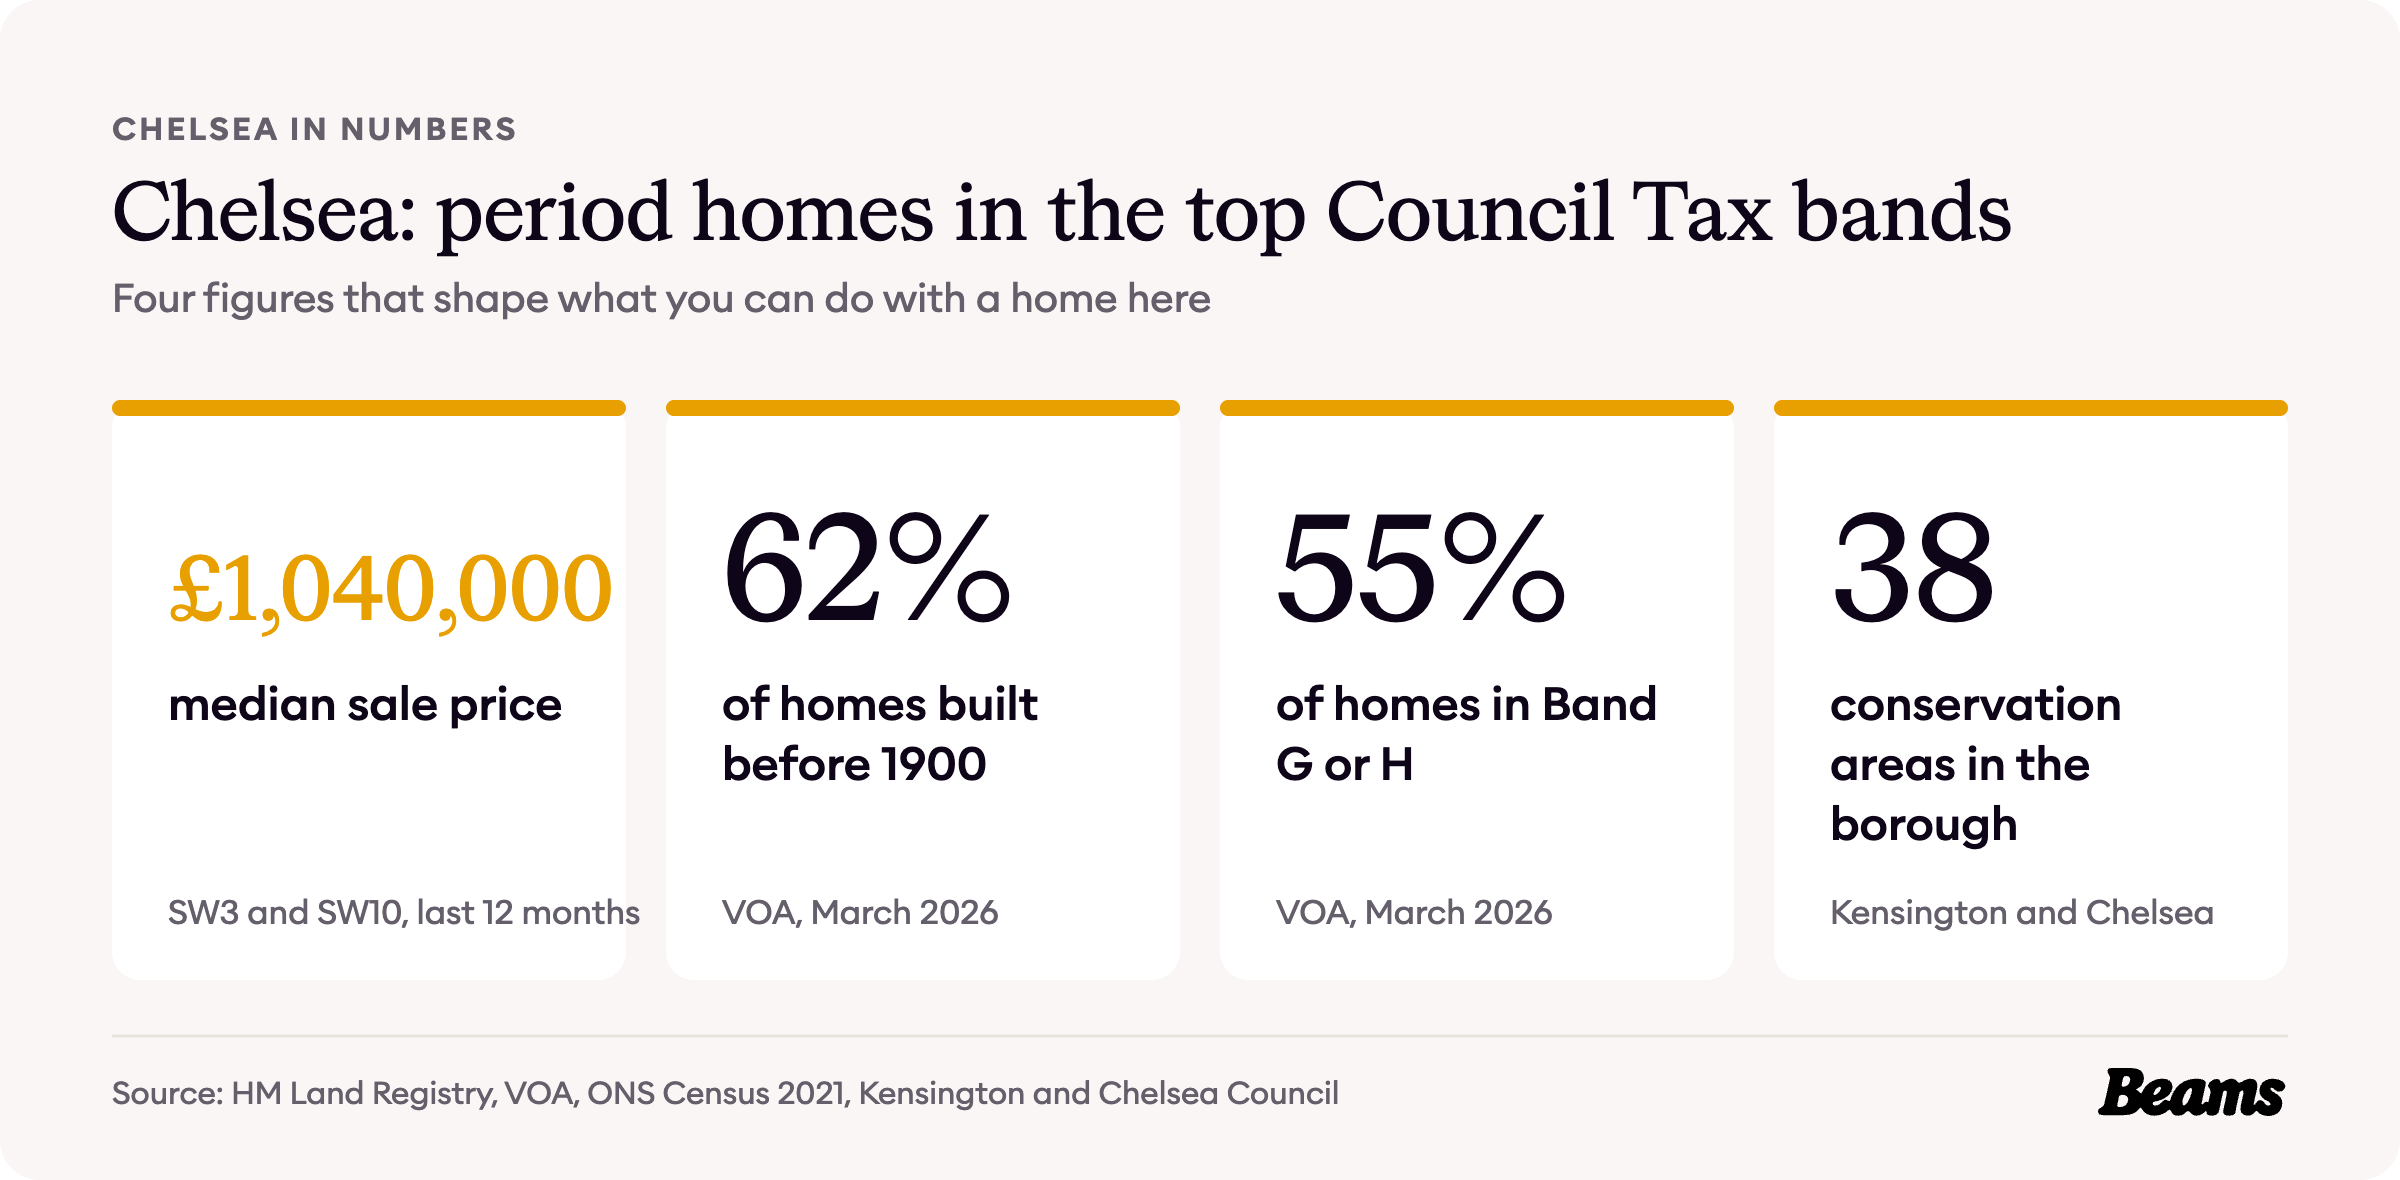
The Valuation Office Agency counts 61.6% of the 22,320 homes in the Hans Town, Chelsea Manor and Royal Hospital, Chelsea Riverside East, Fulham Road and Chelsea Riverside West areas as built before 1900, almost three times London's 20.8%. Only 8.7% went up between the wars, against 22.0% for London, and 6.6% have been built since 2000, against 18.5% [4].
Houses built with attics are natural candidates for a loft conversion in Chelsea, although in a conservation area any change to the roofline needs checking first.
How Chelsea households live
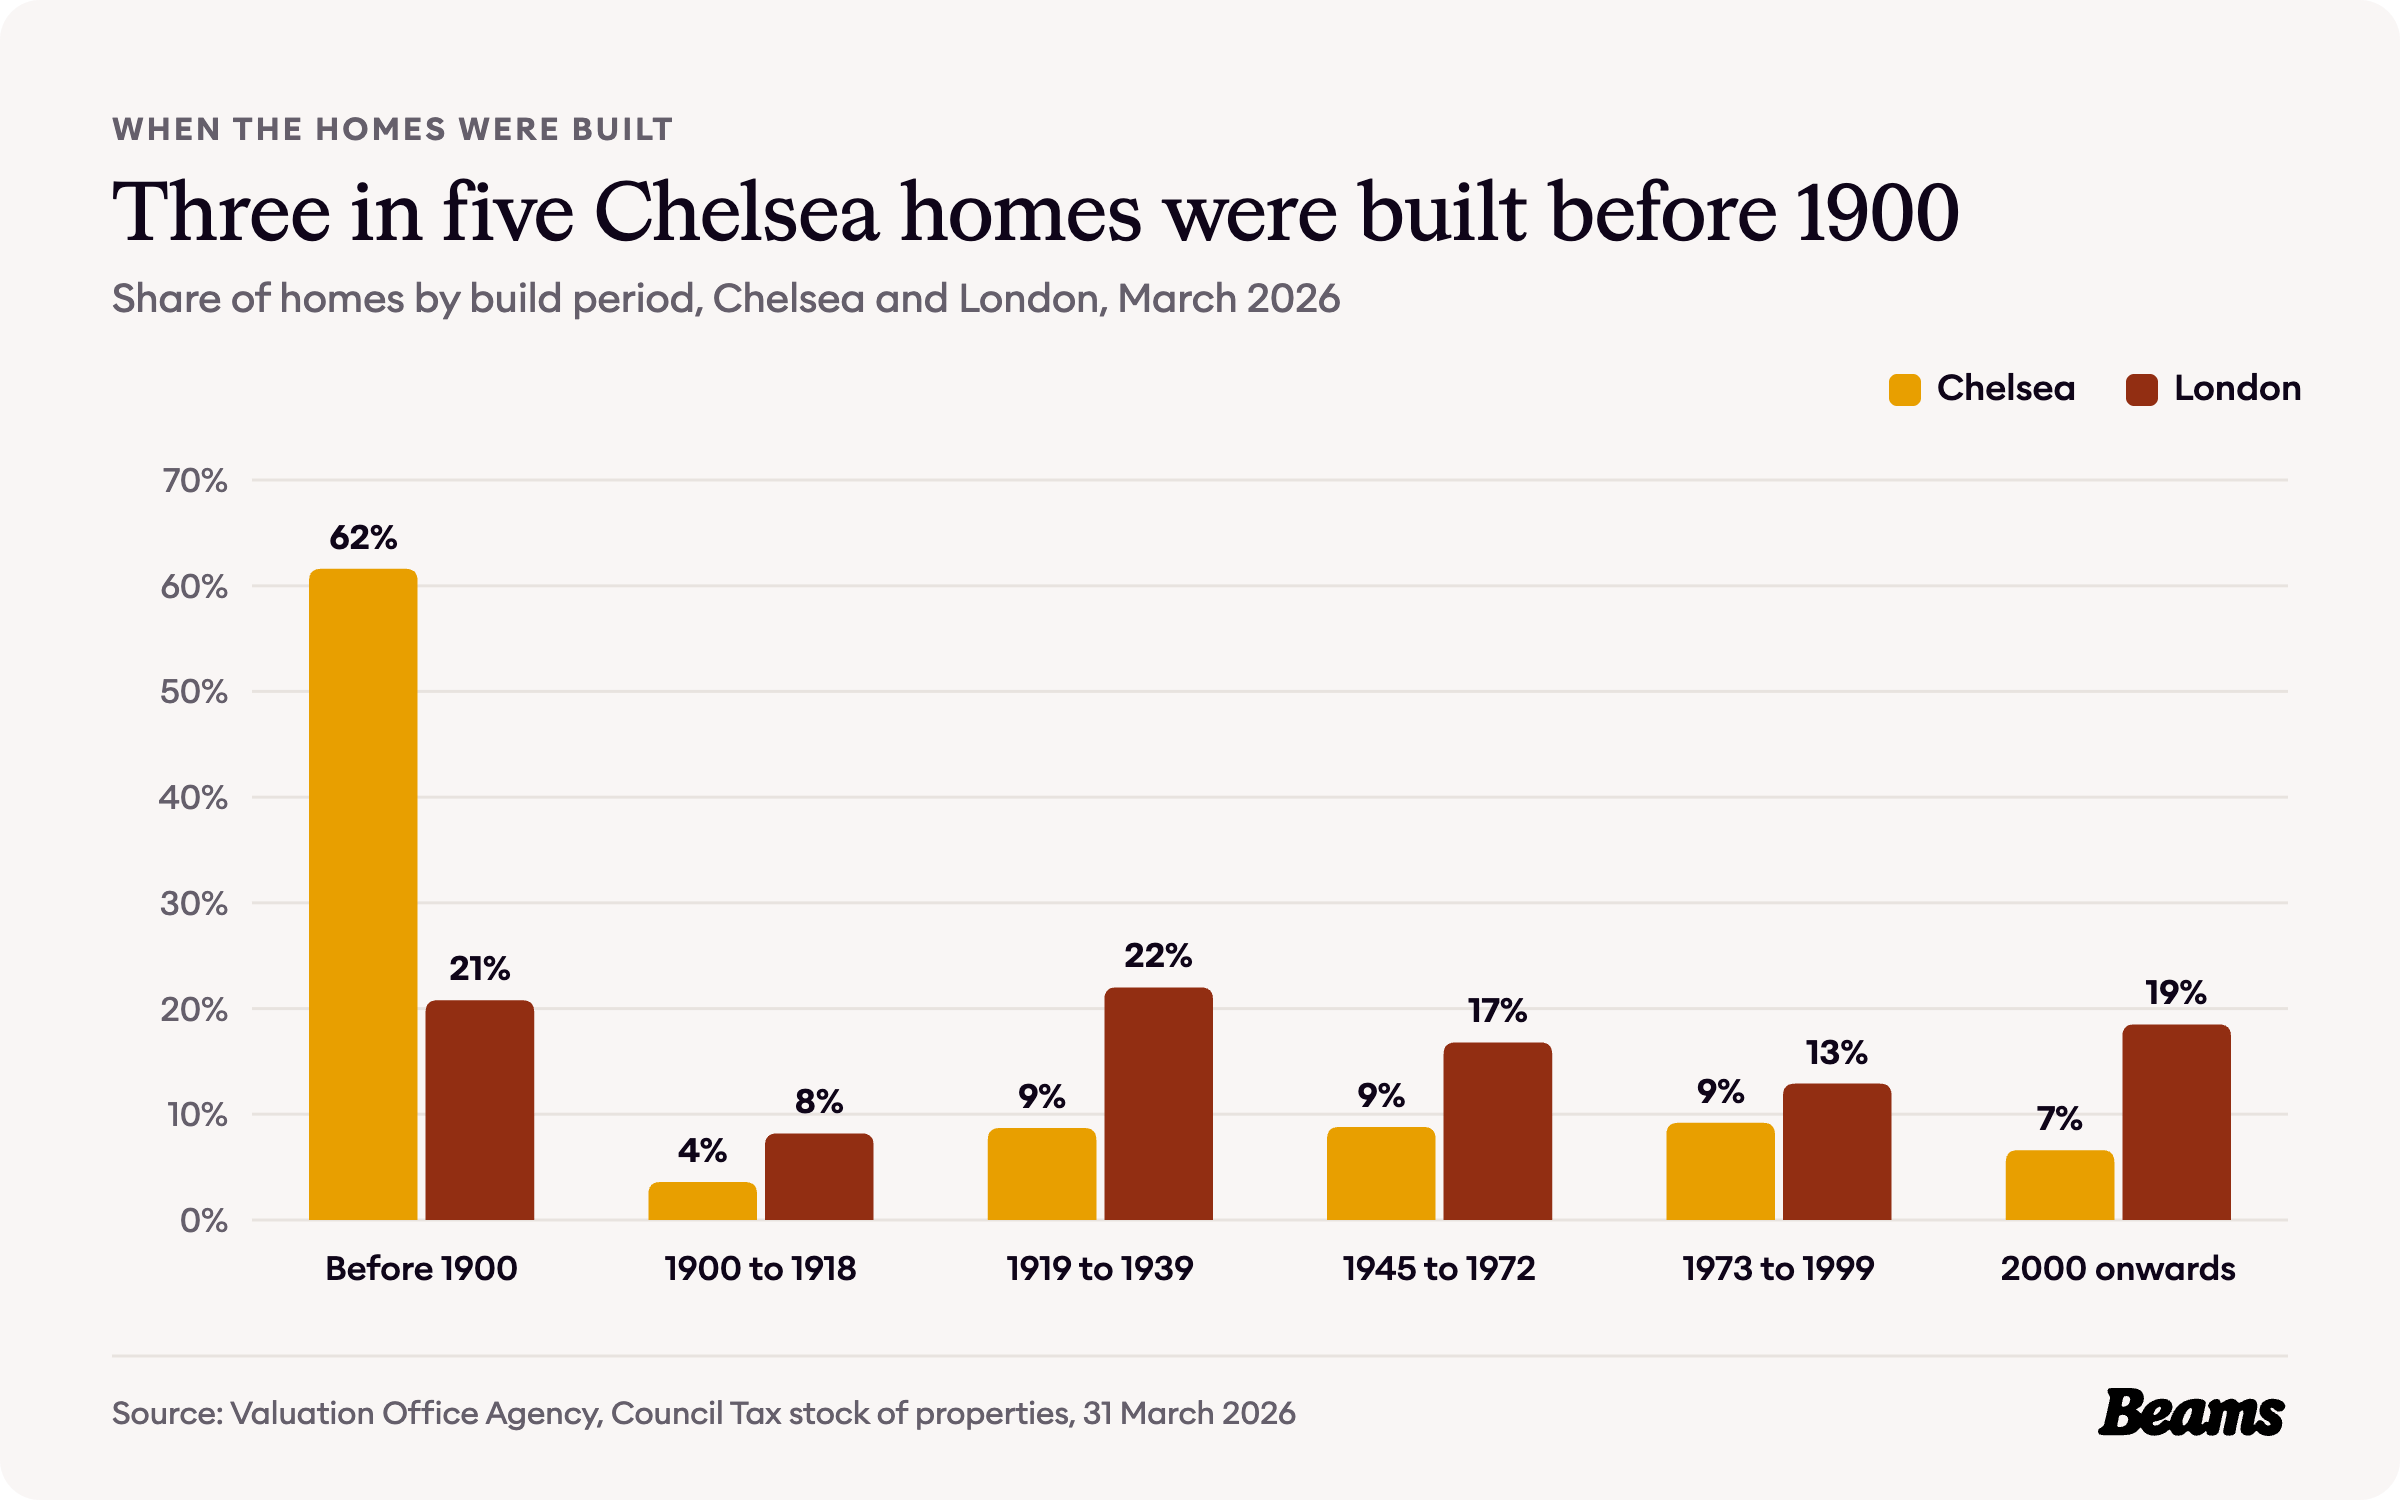
The 2021 Census counted 15,095 households across the five Chelsea areas. 56.3% live in a purpose-built flat and 18.4% in a flat inside a converted house, against 40.3% and 11.1% across London [5].
In all, 77.1% of Chelsea households live in a flat, against 54.0% for London. Terraced houses are the next biggest group at 17.2%, while semi-detached and detached houses together account for just 5.5% [5].
Some of those purpose-built flats are Victorian. Mansion flats went up in or near Cheyne Walk in 1888, and Kings Mansions was built in Lawrence Street by 1894 [3]. In flats of that age, a bathroom renovation in Chelsea often means working around old pipe runs and shared walls.
Who owns Chelsea's homes
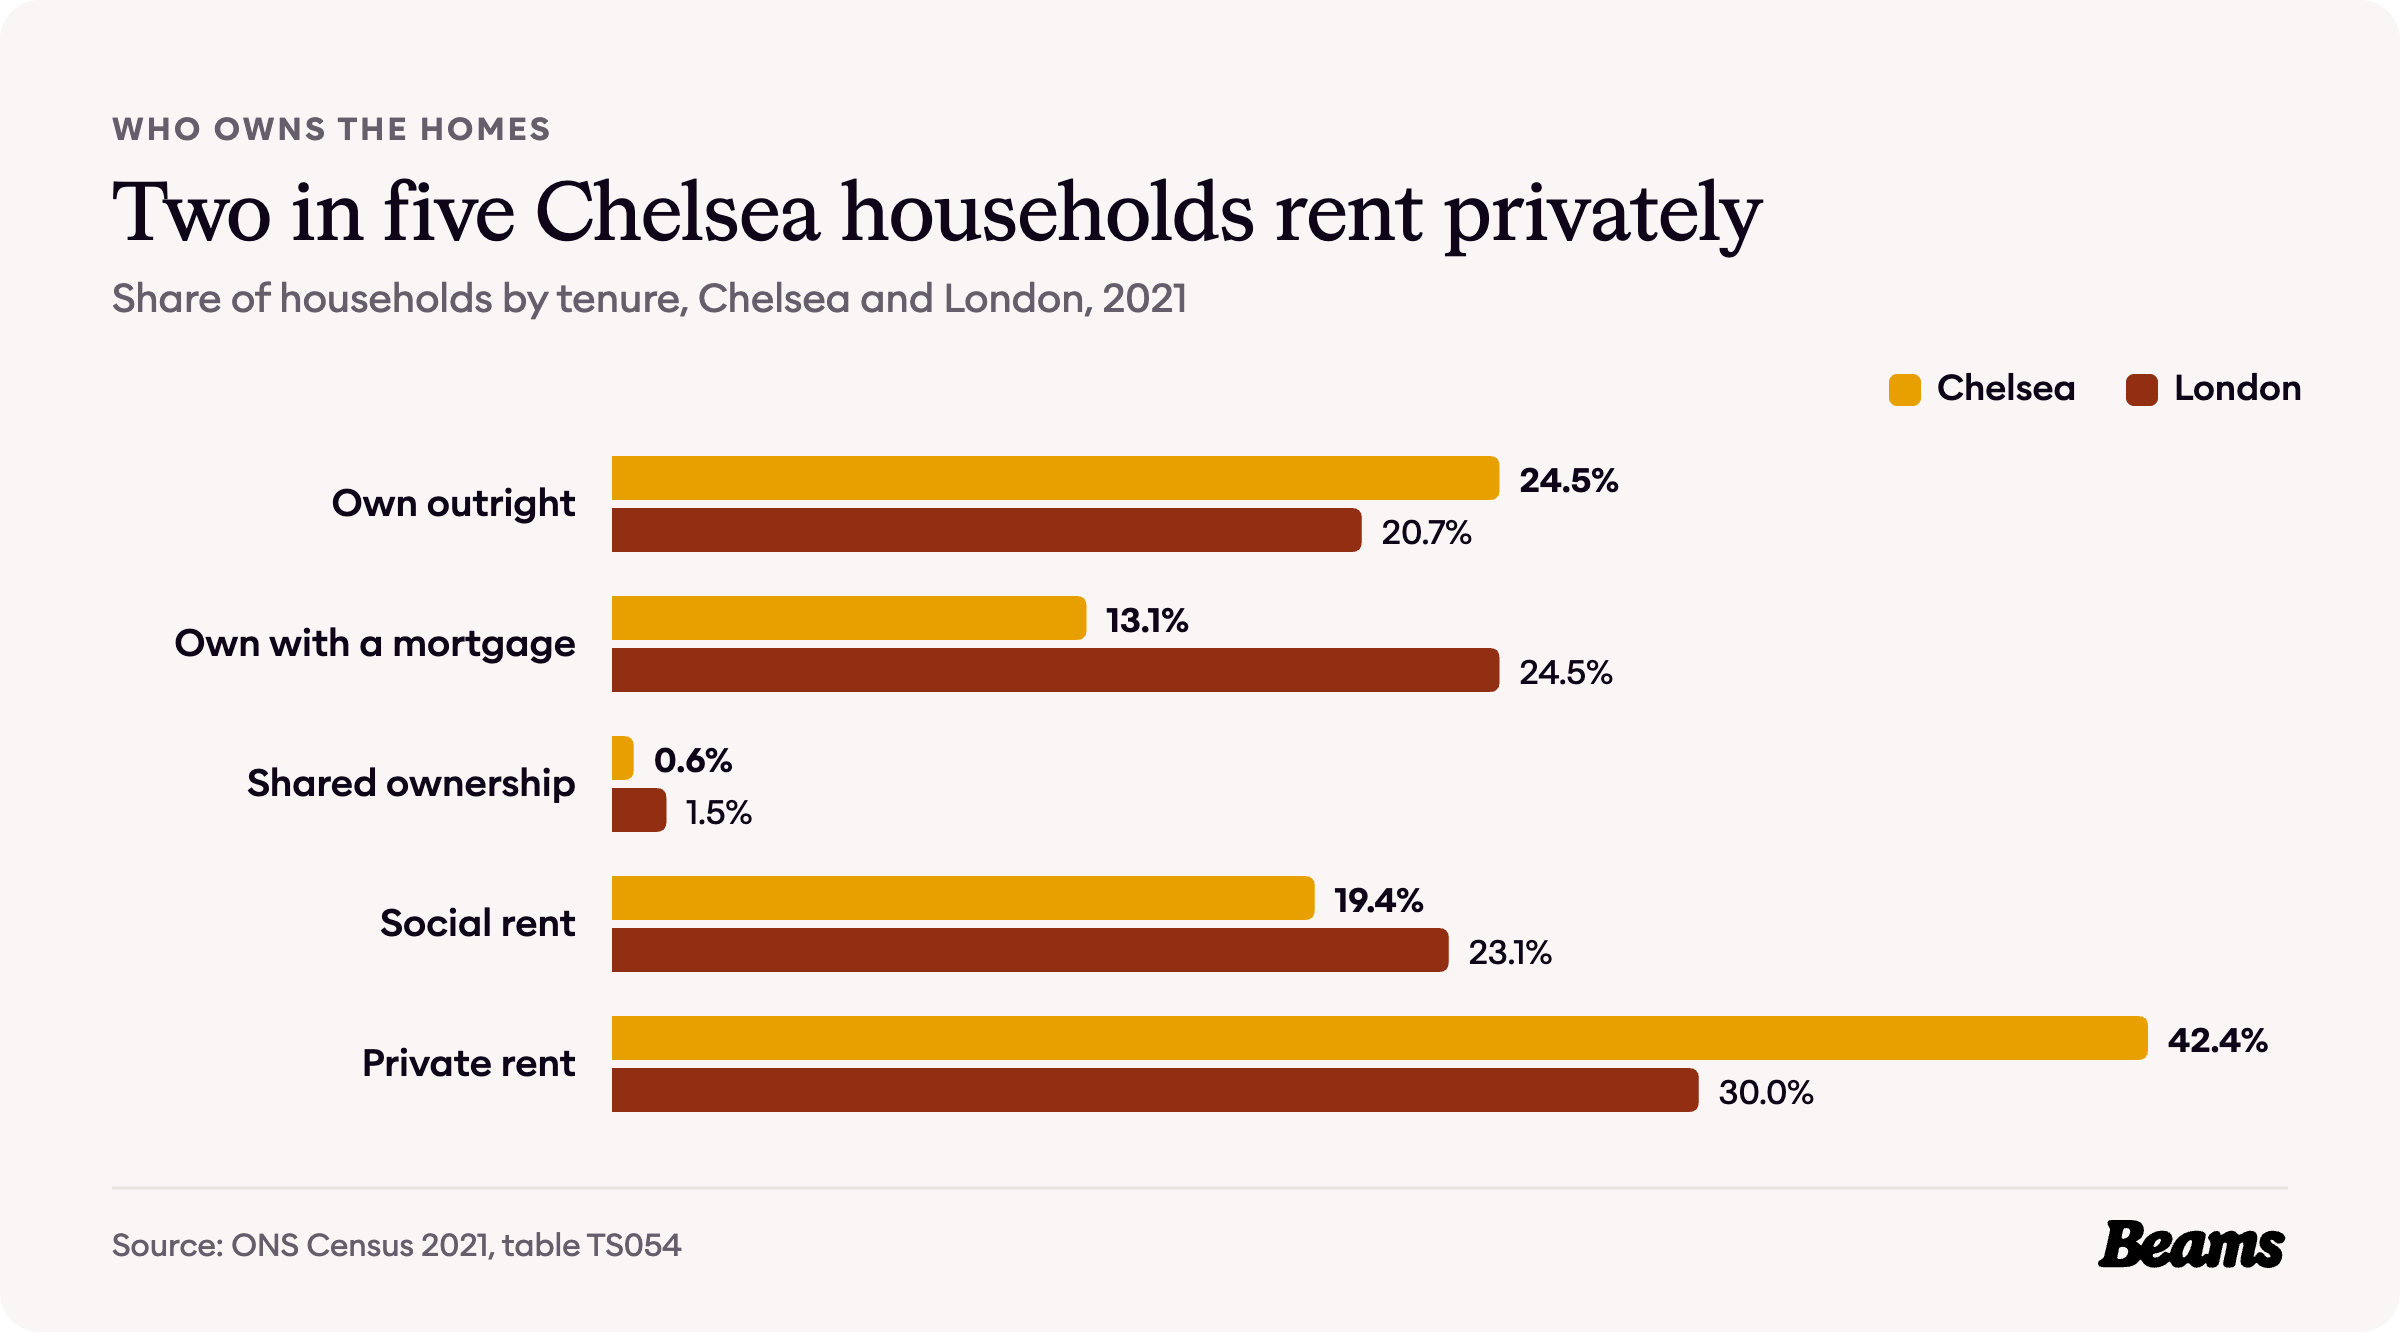
37.6% of Chelsea households own their home, 24.5% outright and 13.1% with a mortgage, against 45.2% across London [6]. Outright ownership is above the London rate of 20.7%, but far fewer owners have a mortgage: 13.1% against 24.5%.
Private renting is the largest tenure, at 42.4% of households against 30.0% for London. Social renting is below the London average but still covers 19.4% of households, about one in five, against 23.1% across London [6].
What a Chelsea home costs
The figures on this page cover three different areas, so it helps to know which is which. The UK House Price Index and the rent figures cover the whole Royal Borough of Kensington and Chelsea. The census and Valuation Office figures cover the Hans Town, Chelsea Manor and Royal Hospital, Chelsea Riverside East, Fulham Road and Chelsea Riverside West areas, and the sale prices cover the SW3 and SW10 postcode districts.
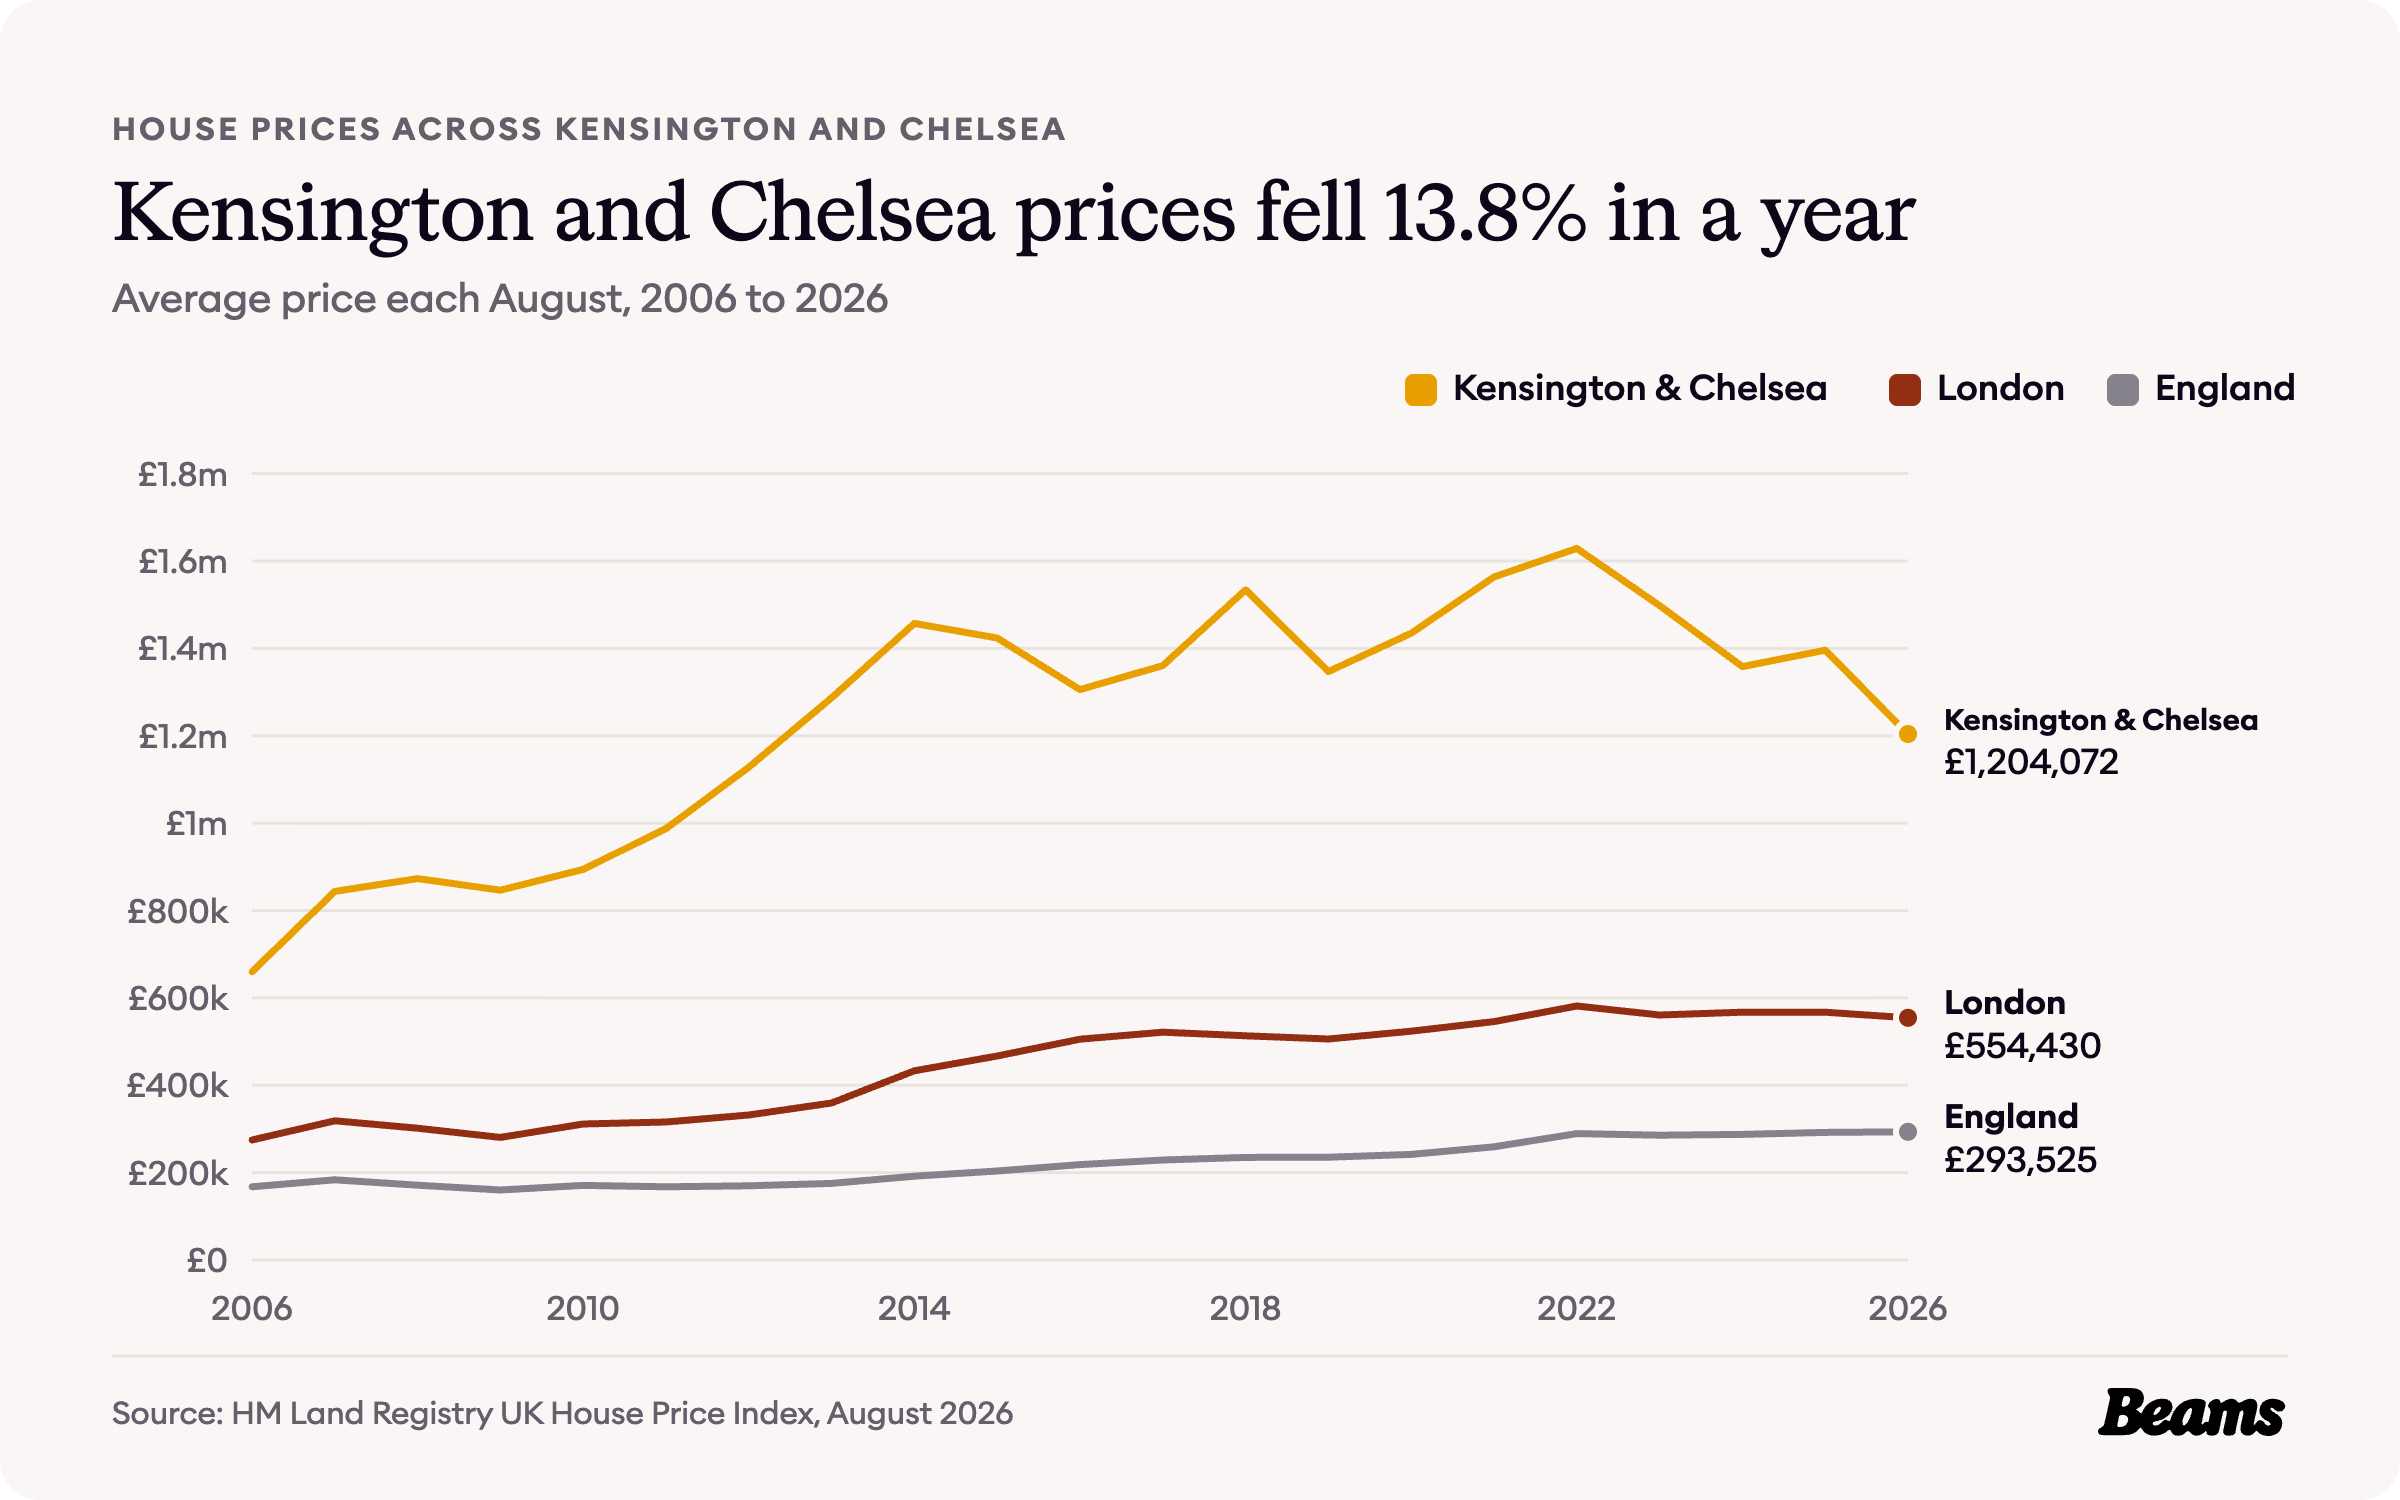
The average home in Kensington and Chelsea cost £1,204,072 in August 2026, 13.8% less than a year earlier [7]. That is more than twice the London average of £554,430 and about four times the England average of £293,525 [8].
Twenty years ago the borough average was £659,832, against £274,815 for London. It passed £1 million in August 2012 and peaked at £1,628,847 in August 2022. It has fallen in three of the four years since, and this year's figure is the lowest for any August since 2012, about a quarter below the peak [8].
The jump from a flat to a house
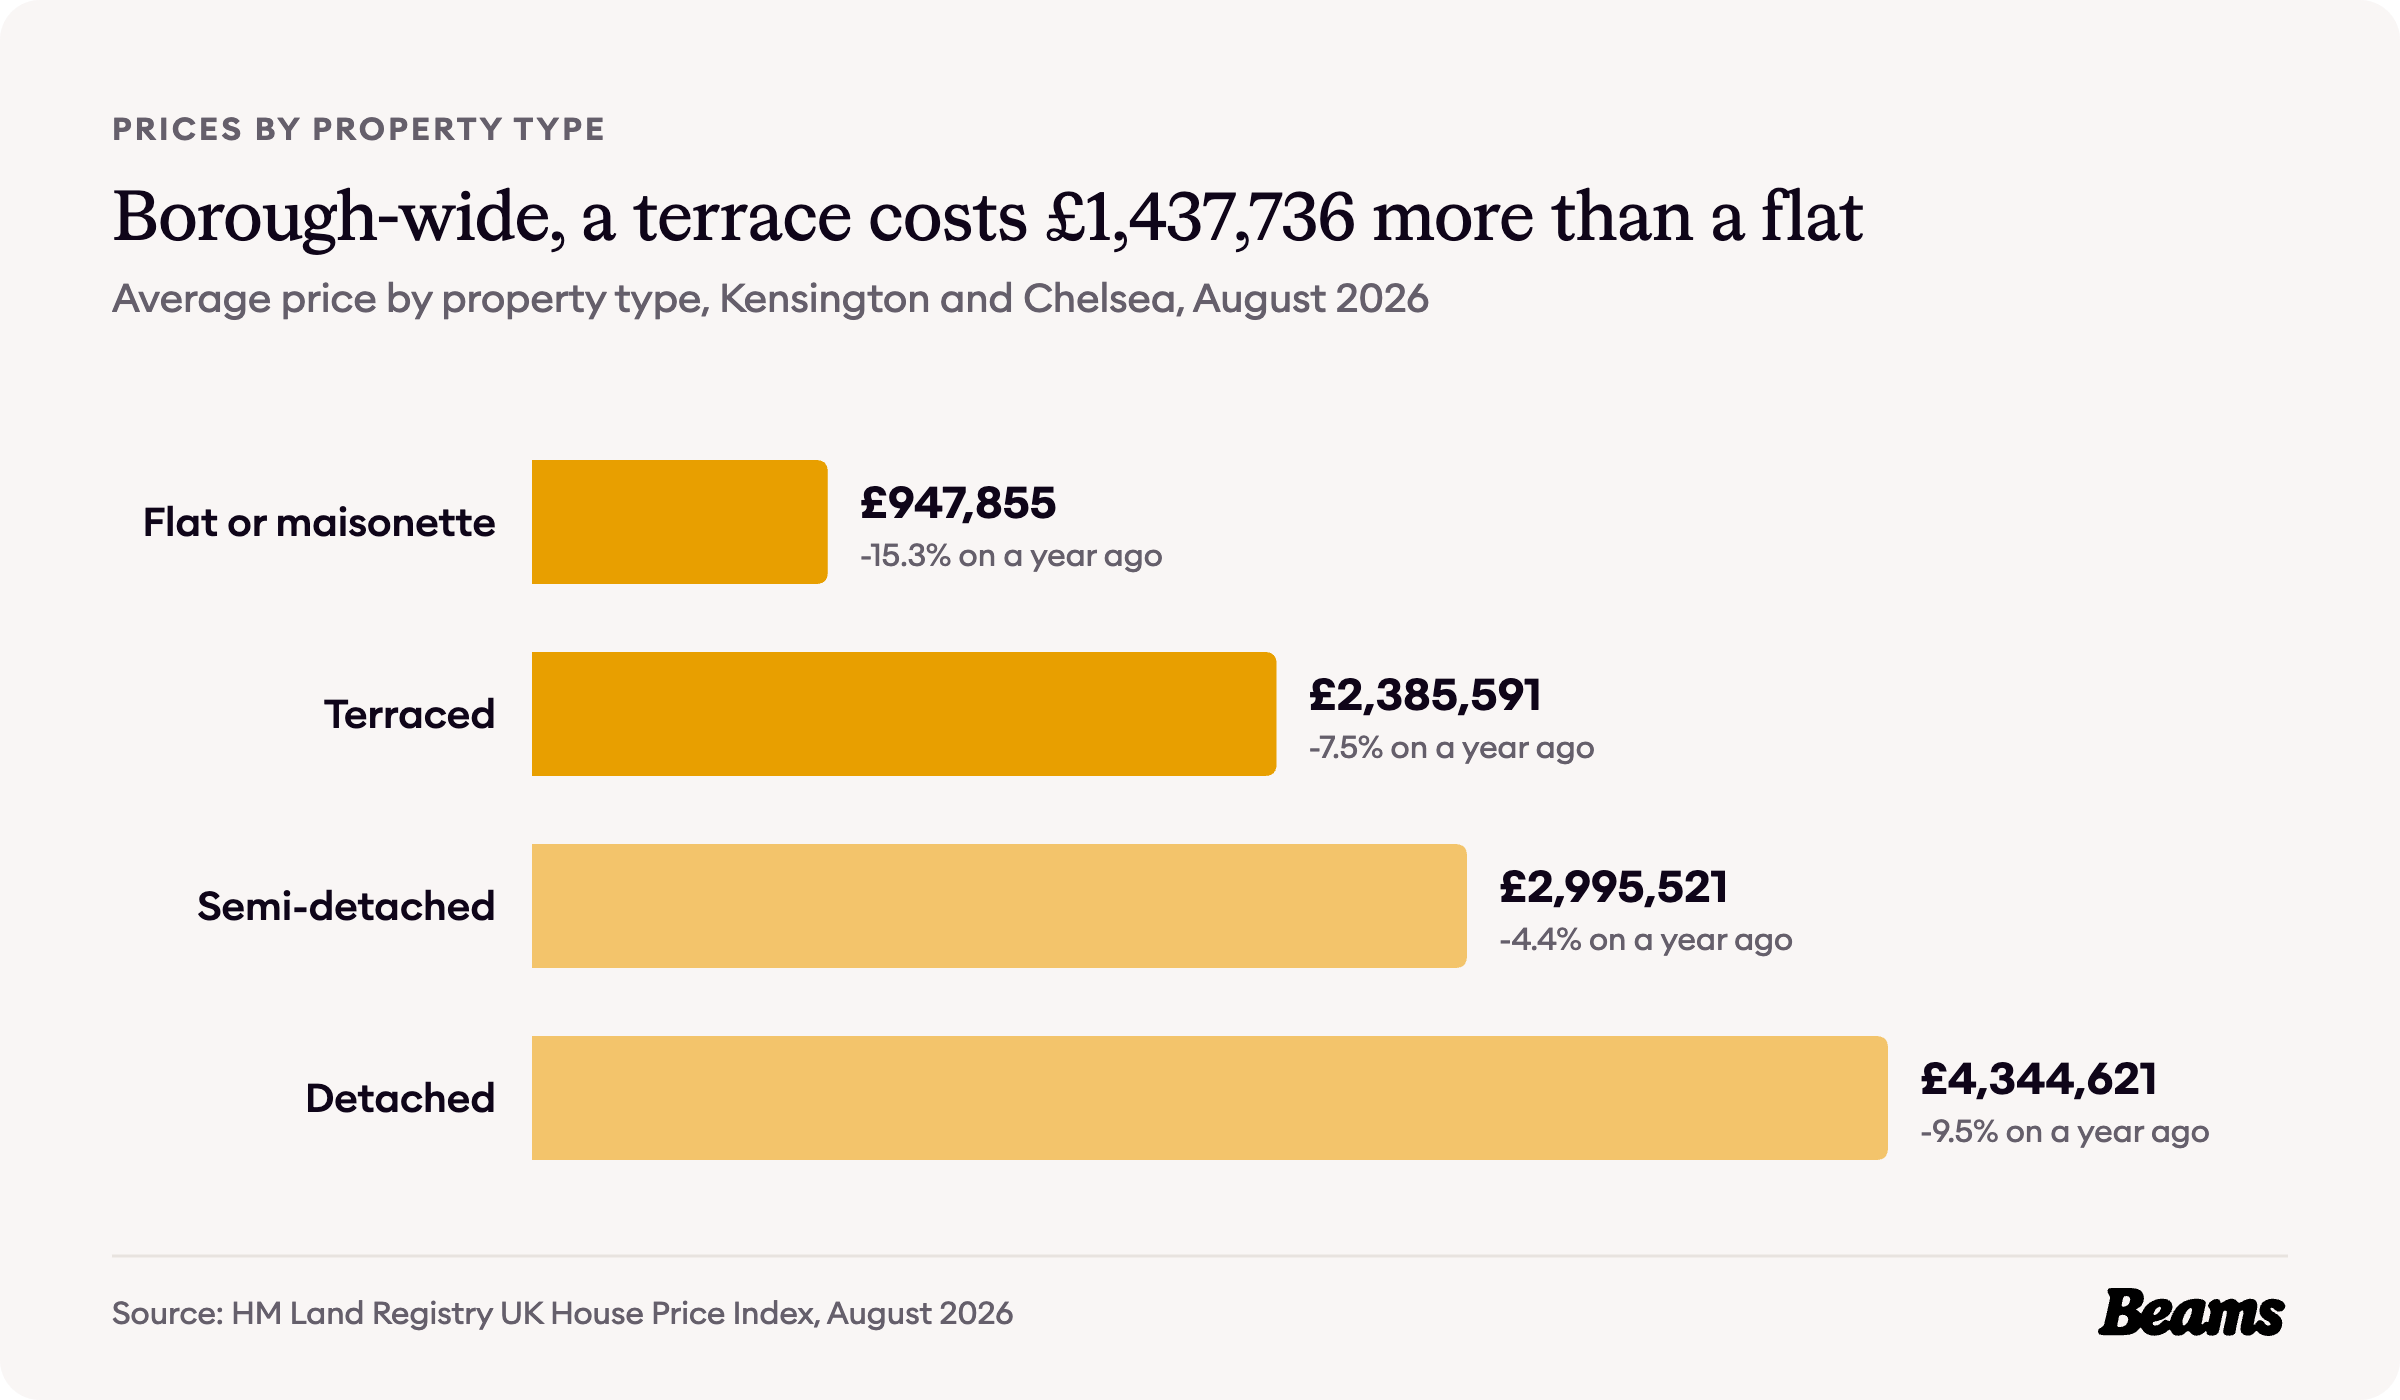
Across the borough, a flat or maisonette averaged £947,855 in August 2026 and a terraced house £2,385,591, a gap of £1,437,736 [7]. Semi-detached homes averaged £2,995,521 and detached homes £4,344,621. First-time buyers paid an average of £1,020,436 and owners moving home £1,436,238 [7].
With a gap of more than £1.4 million between a flat and a terrace, few owners trade up lightly. For a family already in a Chelsea terrace, a house extension in Chelsea adds space without paying for the next rung of the ladder.
What homes sell for in SW3 and SW10
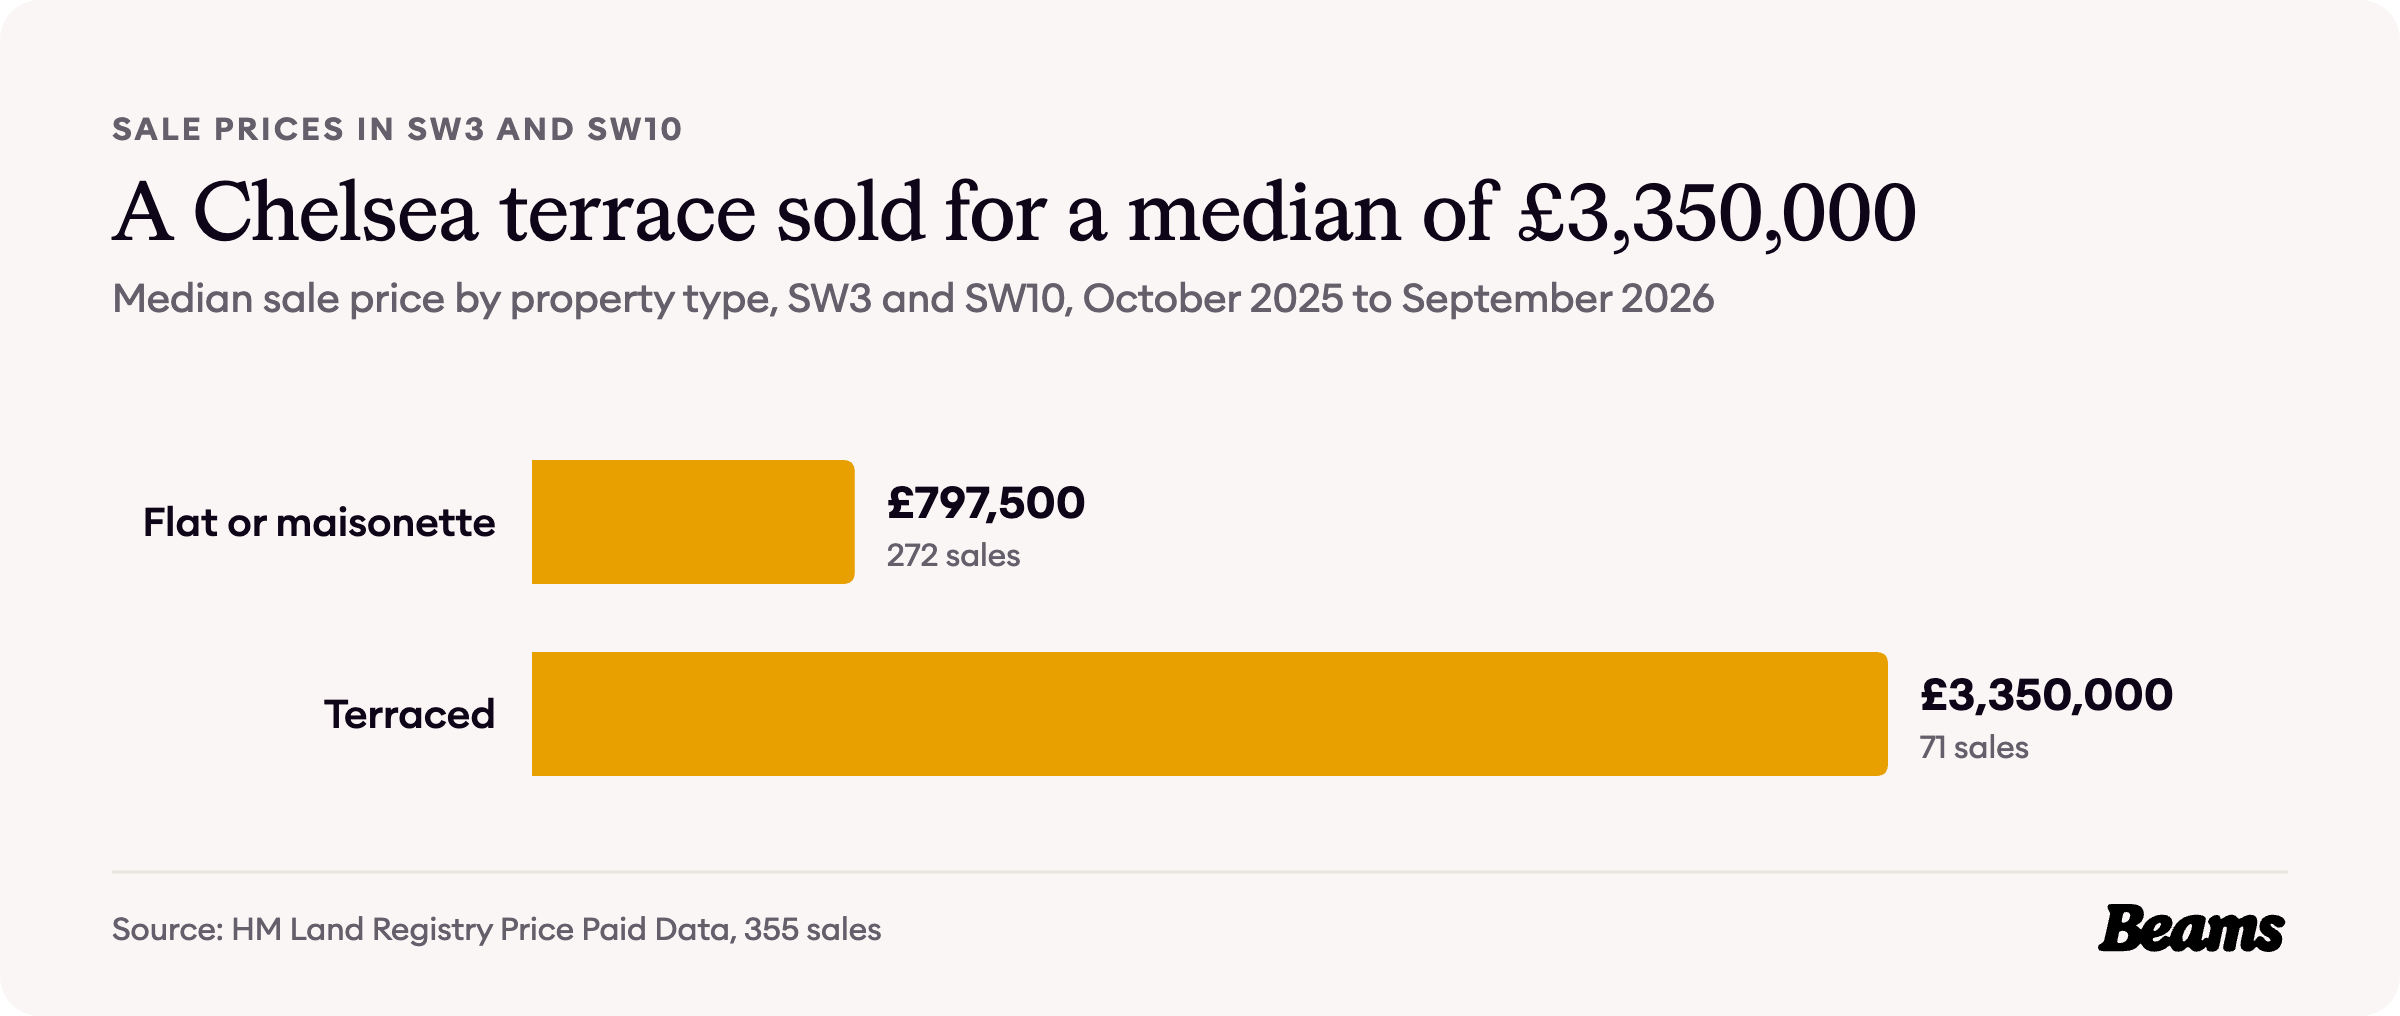
HM Land Registry records 355 sales in the SW3 and SW10 postcode districts between October 2025 and September 2026, at a median of £1,040,000 [9]. Flats made up 272 of them, at a median of £797,500, and the 71 terraced houses sold had a median of £3,350,000 [9].
A median is the middle sale in each group, so it is not directly comparable with the index averages above. Even so, the gap stands out: in SW3 and SW10 the median terrace sold for 4.2 times the median flat, while across the borough the average terrace costs 2.5 times the average flat.
Renting in Chelsea
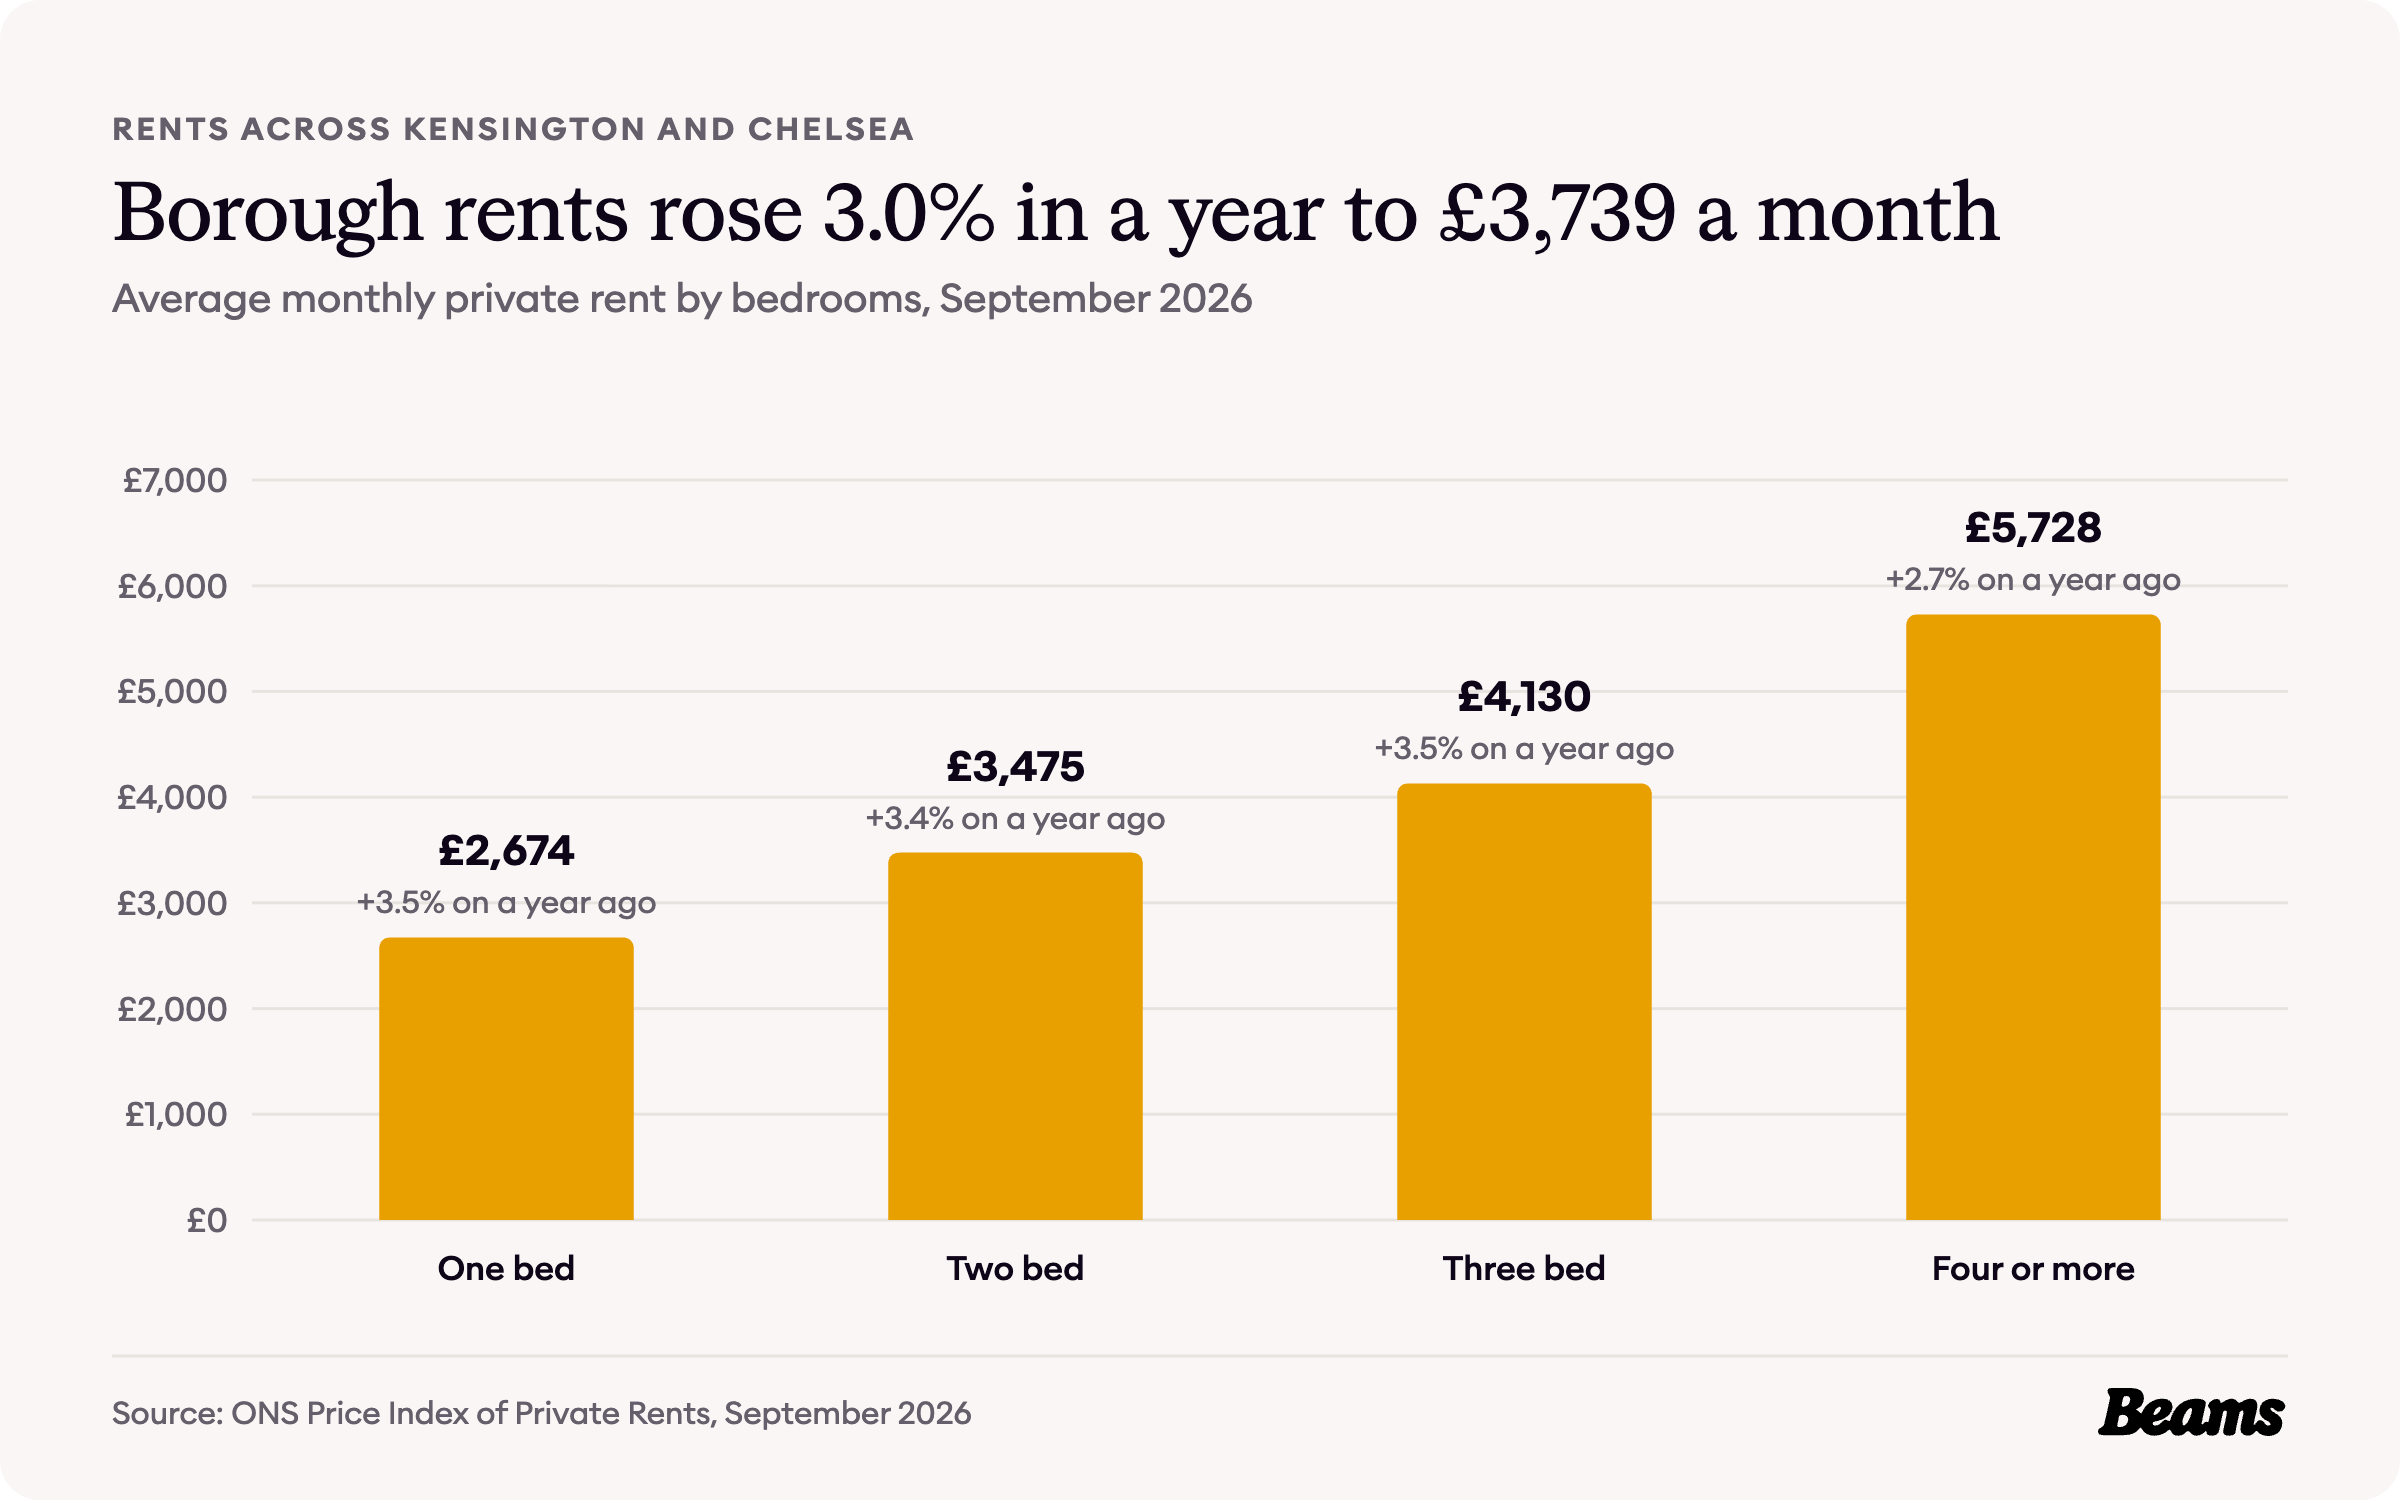
Rents are published for the borough as a whole. The average private rent in Kensington and Chelsea was £3,739 a month in September 2026, up 3.0% on a year earlier, even as average prices fell [7]. A one-bedroom home averaged £2,674 a month, a two-bedroom home £3,475 and a home with four or more bedrooms £5,728 [7].
That matters in Chelsea, where 42.4% of households rent from a private landlord [6].
Council Tax bands in Chelsea
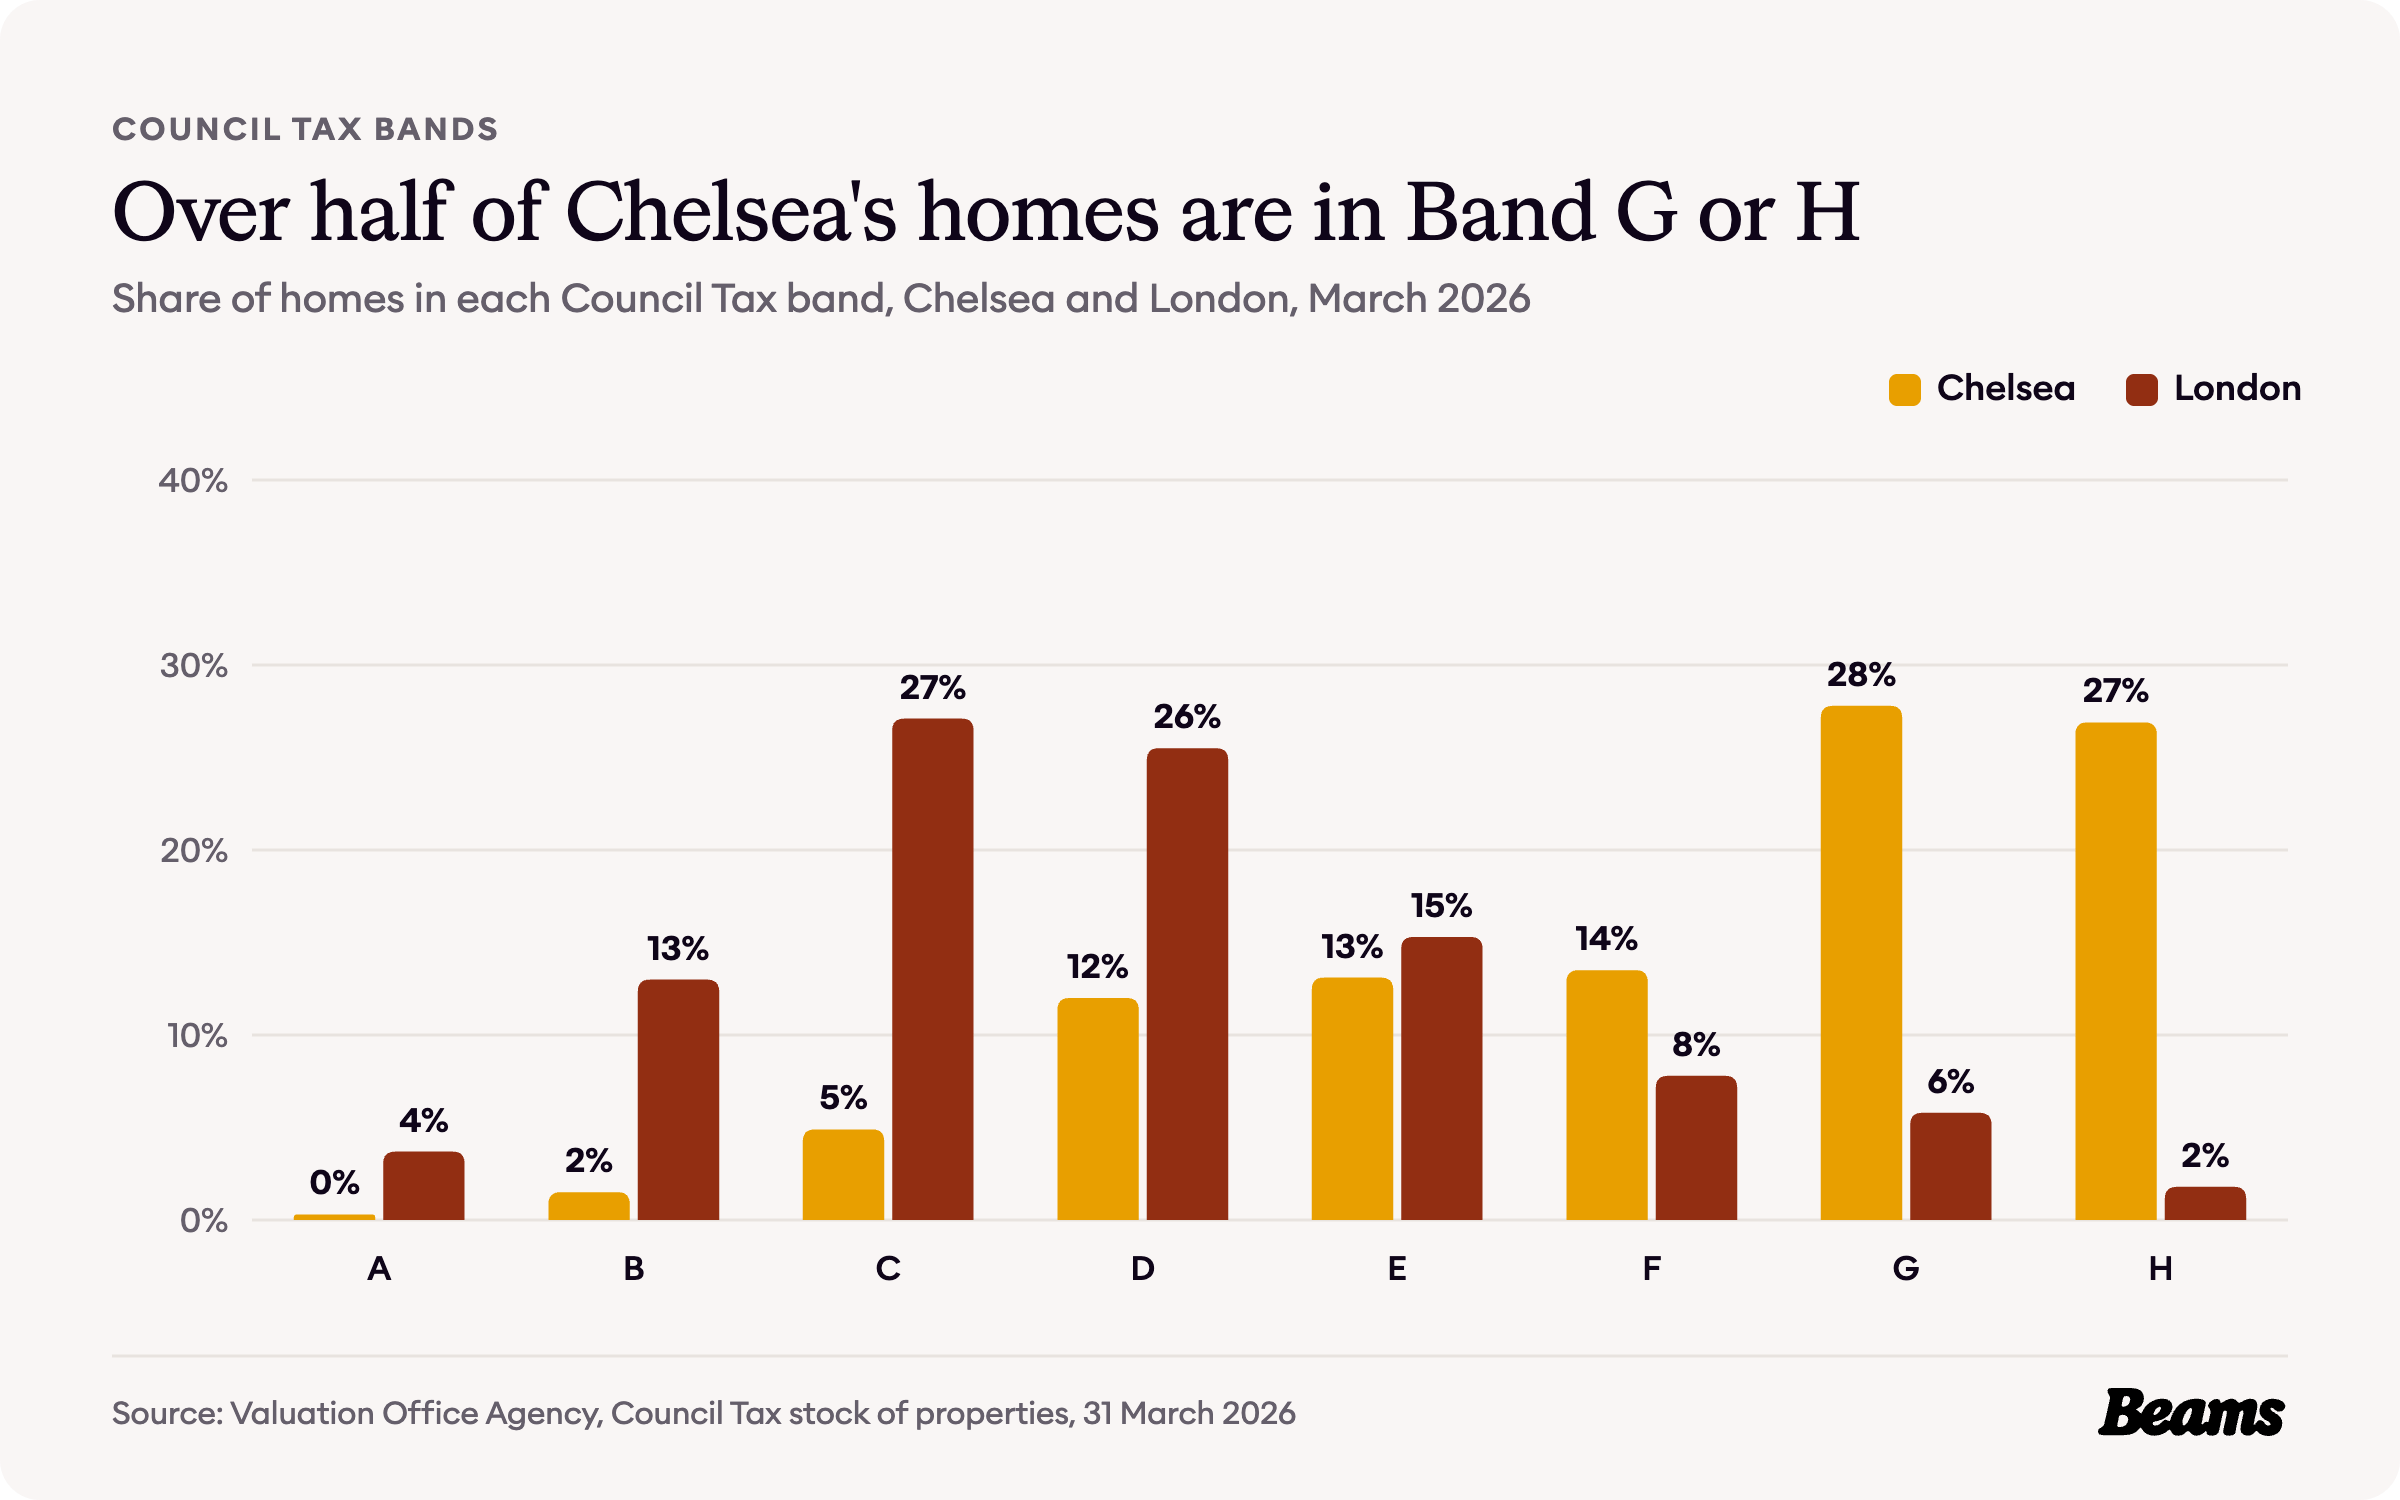
Council Tax bands in England are based on what a home would have sold for on the open market on 1 April 1991 [10], so they are a rough guide to the size and value of the housing.
More than a quarter of Chelsea homes, 26.9%, are in Band H, the top band, against 1.8% across London. Another 27.8% are in Band G, so 54.7% of homes sit in the top two bands, against 7.6% for London. Only 6.7% are in Bands A to C [4].
Homes at the top of the banding are often large period houses and flats where the detail matters, and interior design in Chelsea can make the most of original features rather than strip them out.
The rules on your street
Kensington and Chelsea has 38 conservation areas, which together protect nearly three quarters of the borough [11]. Those covering Chelsea include Chelsea, Cheyne, Royal Hospital, Sloane Square, Sloane Stanley and Chelsea Park Carlyle, each with its own appraisal [12]. Living in a conservation area does not stop you changing your home, but the council assesses whether a proposal preserves or enhances the area's character or appearance, and stricter controls apply to permitted development [11].
One rule applies everywhere in the borough. An Article 4 direction that came into force on 28 April 2016 removes permitted development rights for basement extensions to single dwelling houses across the whole of Kensington and Chelsea [13]. In practice that means a basement conversion in Chelsea under a house needs planning permission, whichever street it is on.
The council says householder applications usually take seven to eight weeks to decide once they are validated, provided no complications arise, and it normally allows three weeks for comments on an application [14]. Check whether your street is in a conservation area or covered by an Article 4 direction before you ask builders in Chelsea for a fixed price.
Chelsea housing statistics at a glance
- Median sale price, SW3 and SW10, October 2025 to September 2026: £1,040,000 (355 sales) [9]
- Average house price, Kensington and Chelsea, August 2026: £1,204,072 (London £554,430) [7] [8]
- Change on a year earlier, Kensington and Chelsea: -13.8% (London -2.2%) [7] [8]
- Average terraced house, Kensington and Chelsea: £2,385,591 (London £648,650) [7] [8]
- Average private rent, Kensington and Chelsea, September 2026: £3,739 a month [7]
- Homes built before 1900: 61.6% (London 20.8%) [4]
- Households living in a flat: 77.1% (London 54.0%) [5]
- Households renting from a social landlord: 19.4% (London 23.1%) [6]
- Homes in Council Tax Band G or H: 54.7% (London 7.6%) [4]
- Conservation areas in Kensington and Chelsea: 38 [11]
Frequently asked questions
References
- British History Online, Settlement and building: From 1680 to 1865, general introduction. Victoria County History of Middlesex, volume 12, Chelsea.
- British History Online, Settlement and building: From 1680 to 1865, Hans Town. Victoria County History of Middlesex, volume 12, Chelsea.
- British History Online, Settlement and building: From 1865 to 1900. Victoria County History of Middlesex, volume 12, Chelsea.
- Valuation Office Agency, Council Tax: stock of properties 2026. Table CTSOP4.1, properties by build period and Council Tax band at 31 March 2026, the five Chelsea areas and London.
- ONS, Census 2021 table TS044: Accommodation type. Households by type of home, the five Chelsea areas and London.
- ONS, Census 2021 table TS054: Tenure. Households by tenure, the five Chelsea areas and London.
- ONS, Housing prices in Kensington and Chelsea. UK House Price Index for August 2026 and Price Index of Private Rents for September 2026, updated 21 October 2026.
- HM Land Registry, UK House Price Index. Average prices for Kensington and Chelsea, London and England, August 2006 to August 2026.
- HM Land Registry, Price Paid Data. Sales in the SW3 and SW10 postcode districts, October 2025 to September 2026.
- GOV.UK, How domestic properties are assessed for Council Tax bands. Accessed 29 October 2026.
- Kensington and Chelsea Council, Conservation areas. Accessed 29 October 2026.
- Kensington and Chelsea Council, Conservation area appraisals, proposal statements and management plans. Accessed 29 October 2026.
- Kensington and Chelsea Council, Article 4 directions. Accessed 29 October 2026.
- Kensington and Chelsea Council, How we make a decision. Accessed 29 October 2026.
Thinking of improving rather than moving?
Tell us about your Chelsea home and what you want to change. We'll give you a free estimate, then up to three vetted builders quote against the same specification.