
Bromley housing statistics 2026
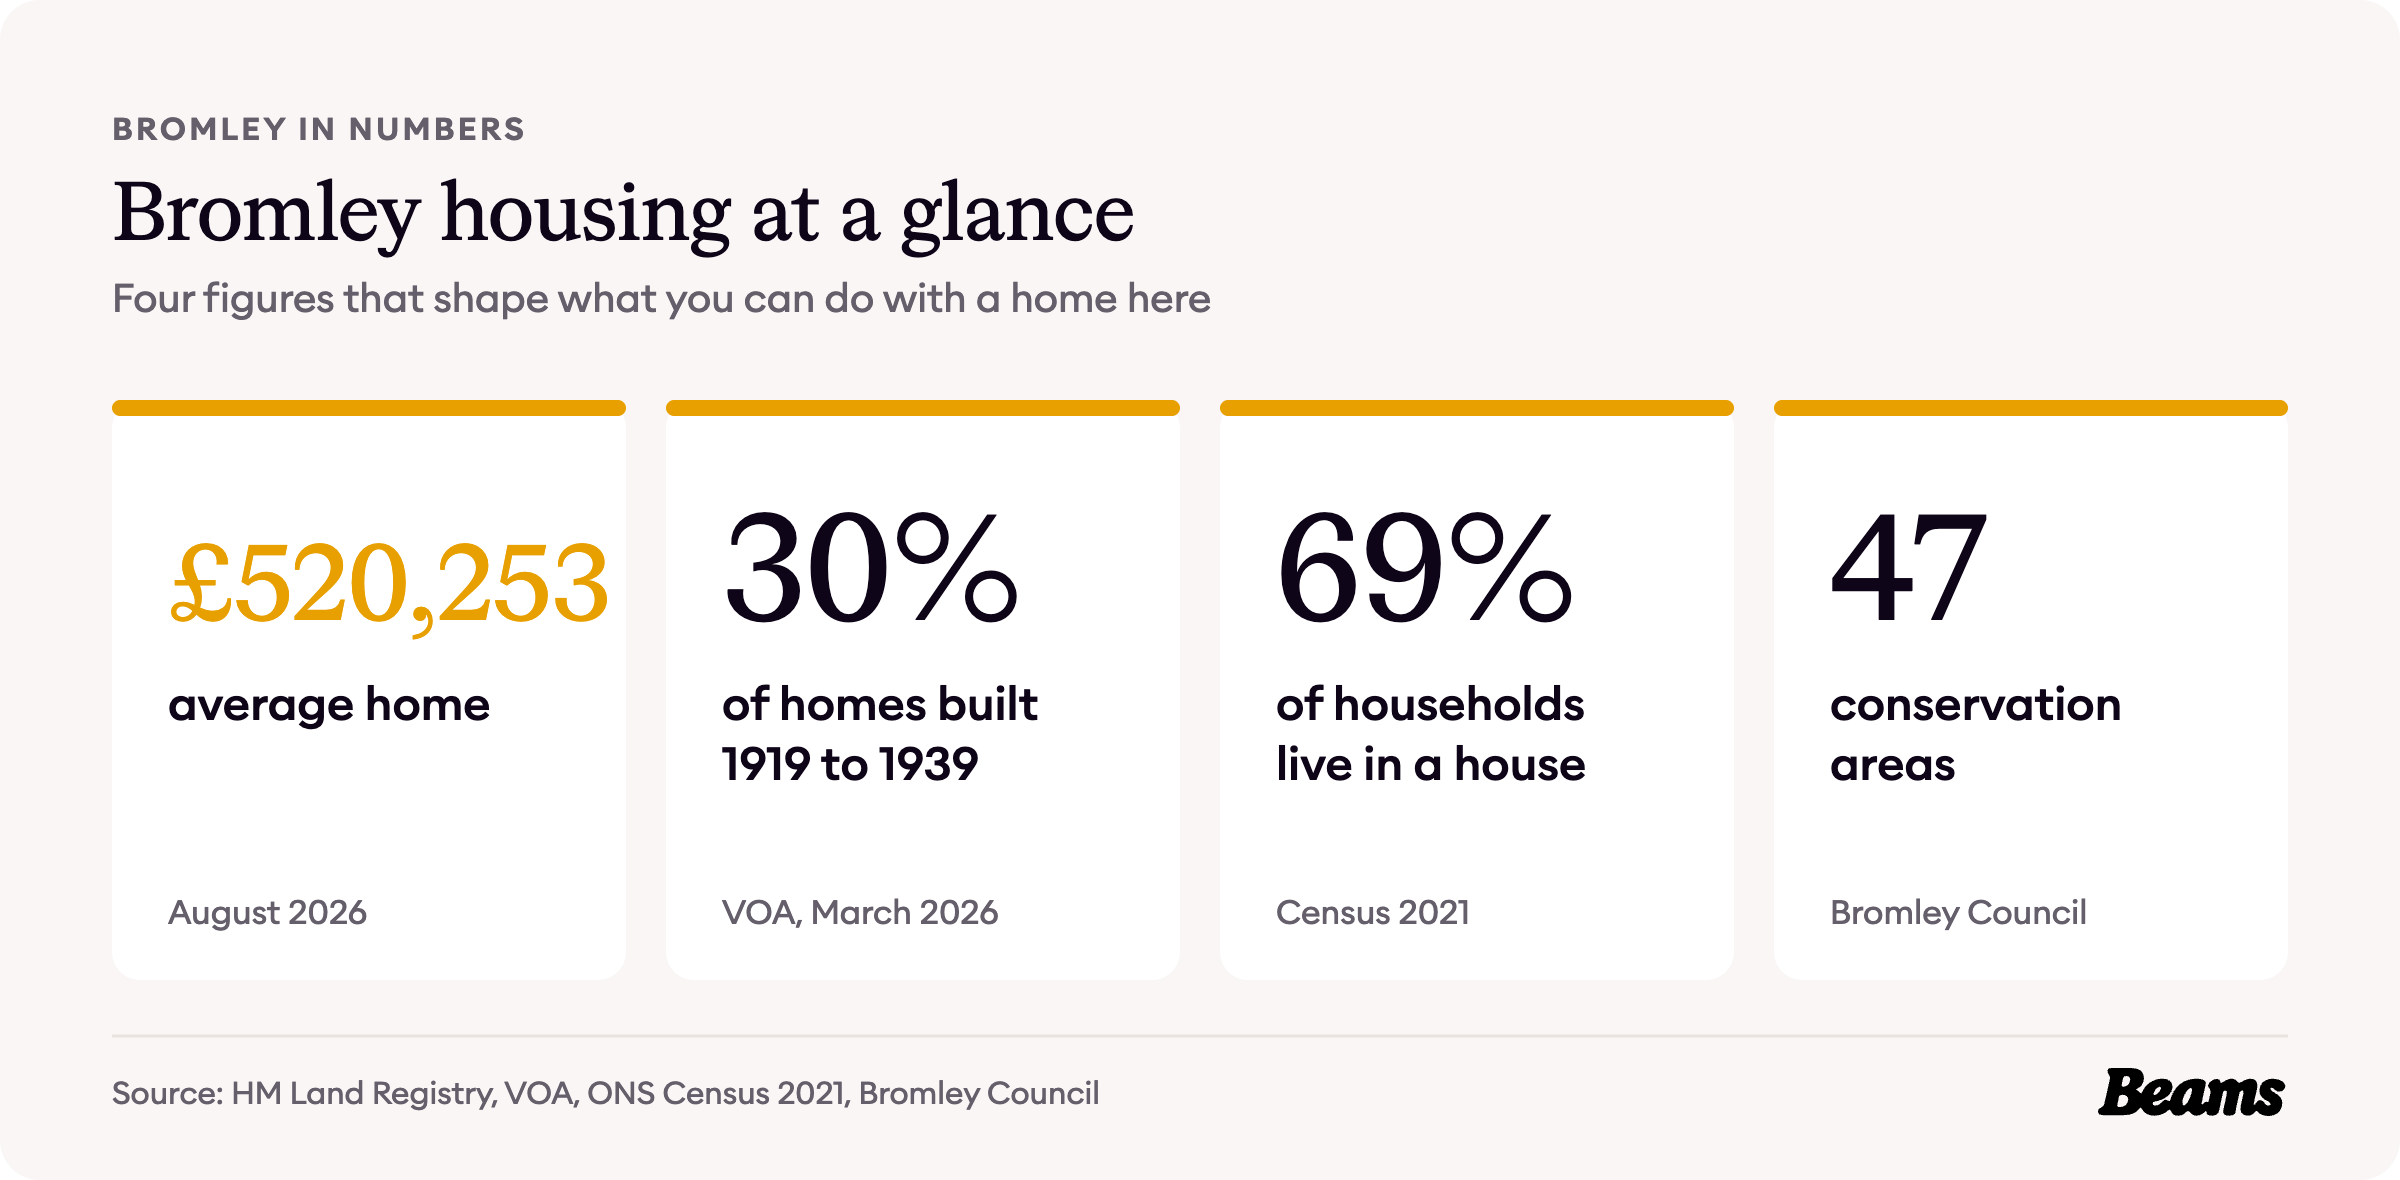
Bromley is the largest London borough by area, and more than half of its homes went up between the end of the First World War and the early 1970s. These are the numbers behind that story, from a medieval market town to today's £520,253 average home.
Every figure comes from an official source and is dated, so you can see exactly what you are working with before you plan a home renovation in Bromley. The sources are numbered in brackets and listed in full at the end of the page.
From market town to suburb
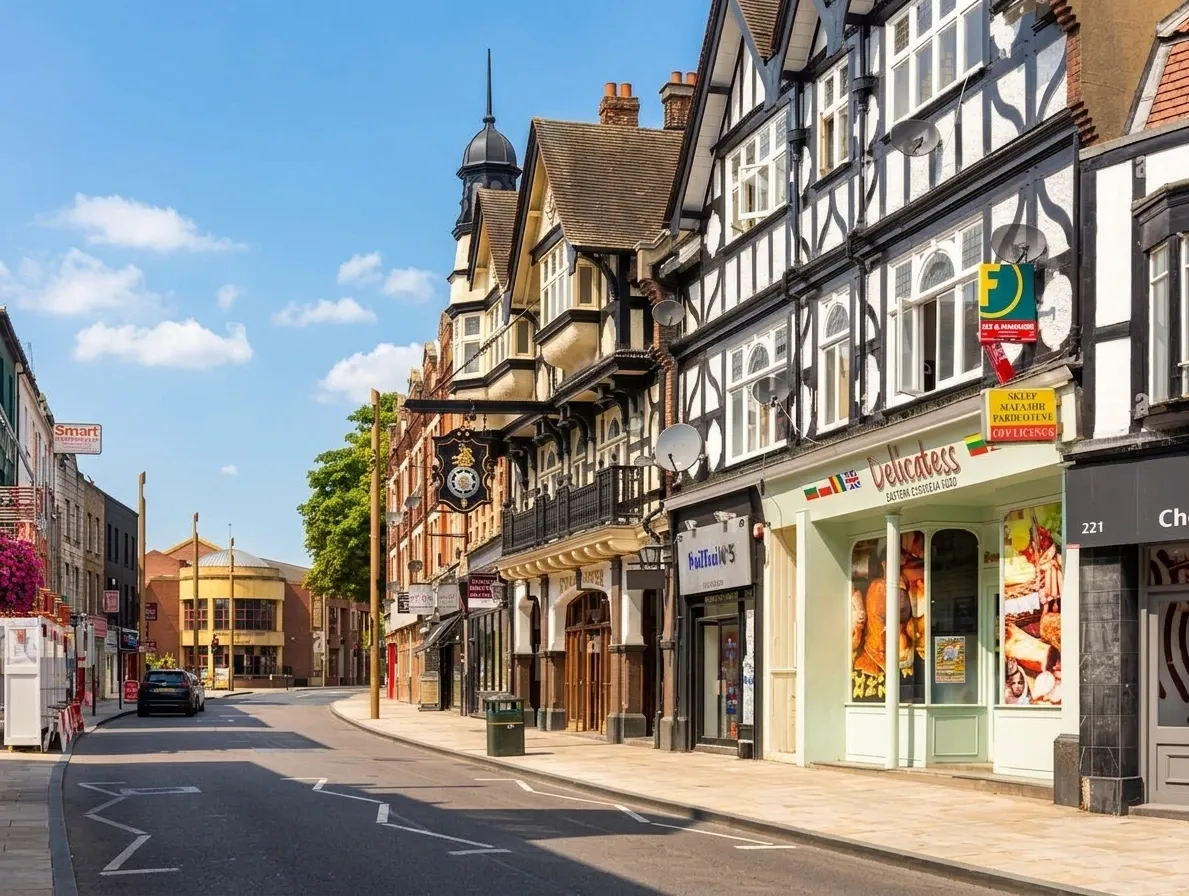
Bromley's first definite mention is in a charter of 862, and in 1205 the Bishop of Rochester established a weekly market in the town that still runs today [1].
The railway arrived comparatively late, in 1858. Once it was running, New Bromley grew to the north of the town from the 1860s, helped by a second line in 1878, and central Bromley was largely built up by the First World War [1]. The modern borough was formed on 1 April 1965 from the boroughs of Bromley and Beckenham, the urban districts of Orpington and Penge and part of Chislehurst, and it is the largest London borough by area [2].
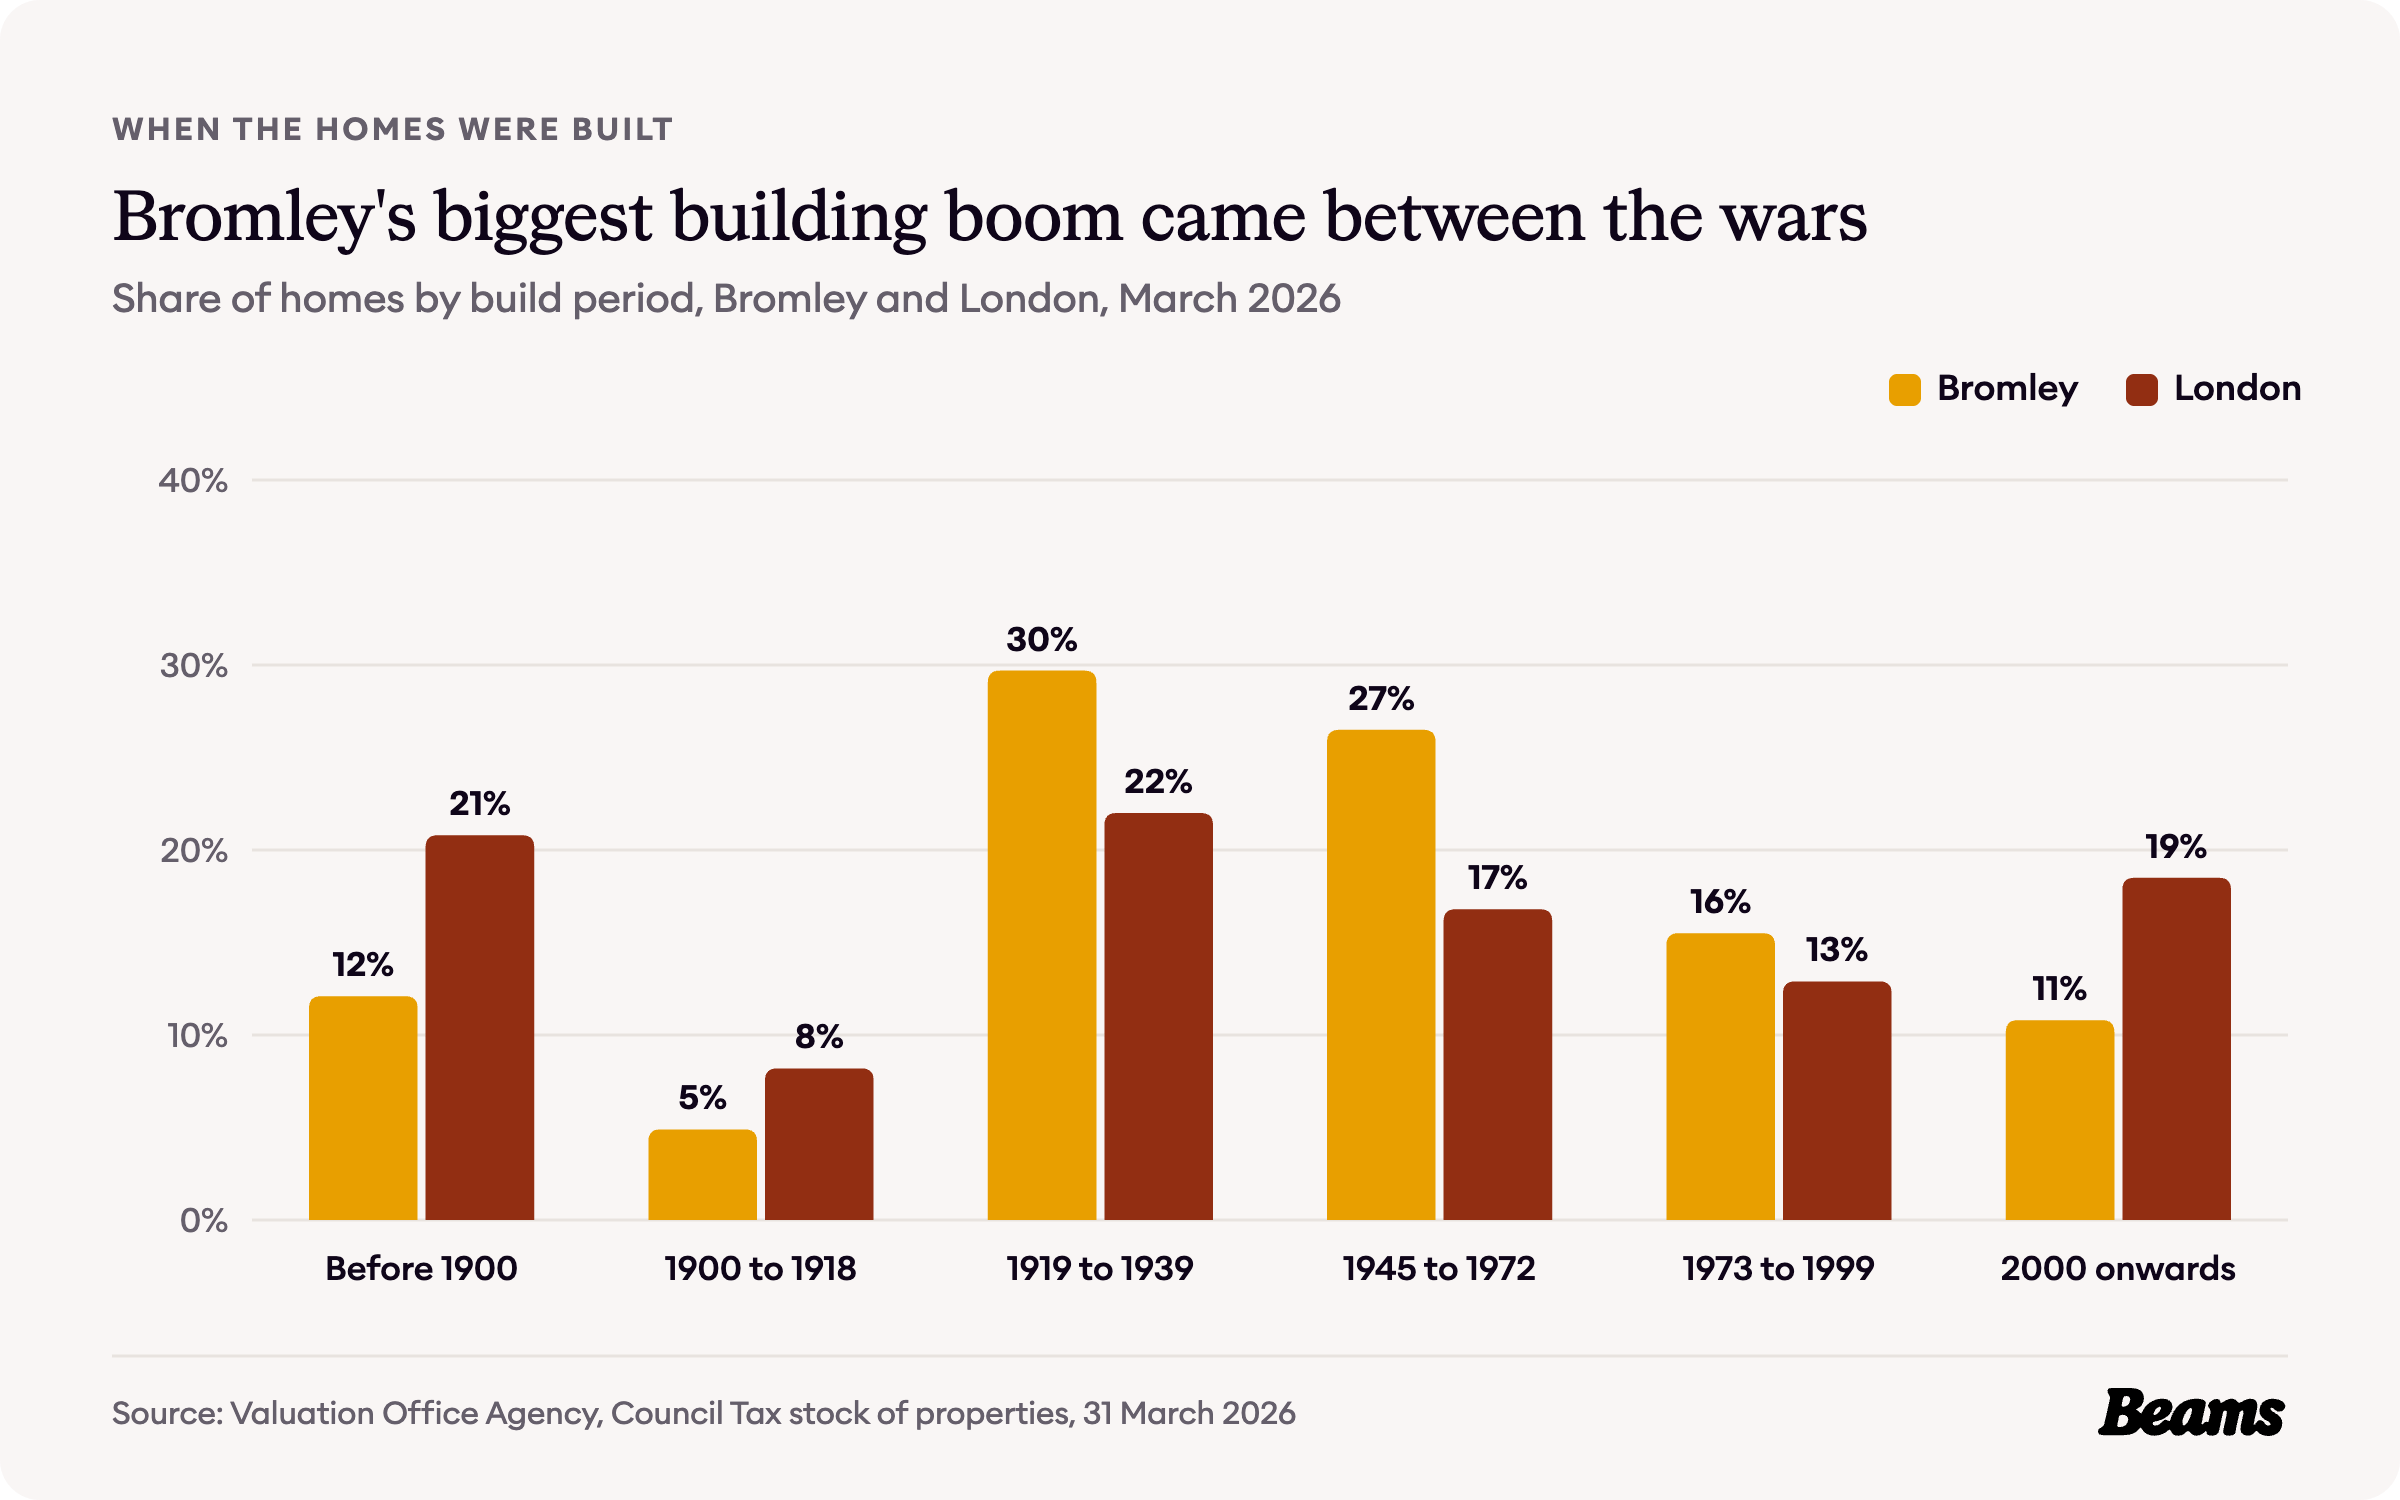
The Valuation Office Agency counts 143,690 homes in the borough. Only 12.1% were built before 1900, against 20.8% for London. The biggest share, 29.7%, went up between 1919 and 1939, and another 26.5% between 1945 and 1972, so 56.2% of Bromley's homes were built between 1919 and 1972 [3].
Since then the pace has slowed, with 15.5% built between 1973 and 1999 and 10.8% since 2000, against 18.5% across London [3]. For the owner of an inter-war or post-war house, a loft conversion in Bromley is often the simplest way to add a bedroom, although some streets have extra rules on roofs, covered below.
How Bromley households live
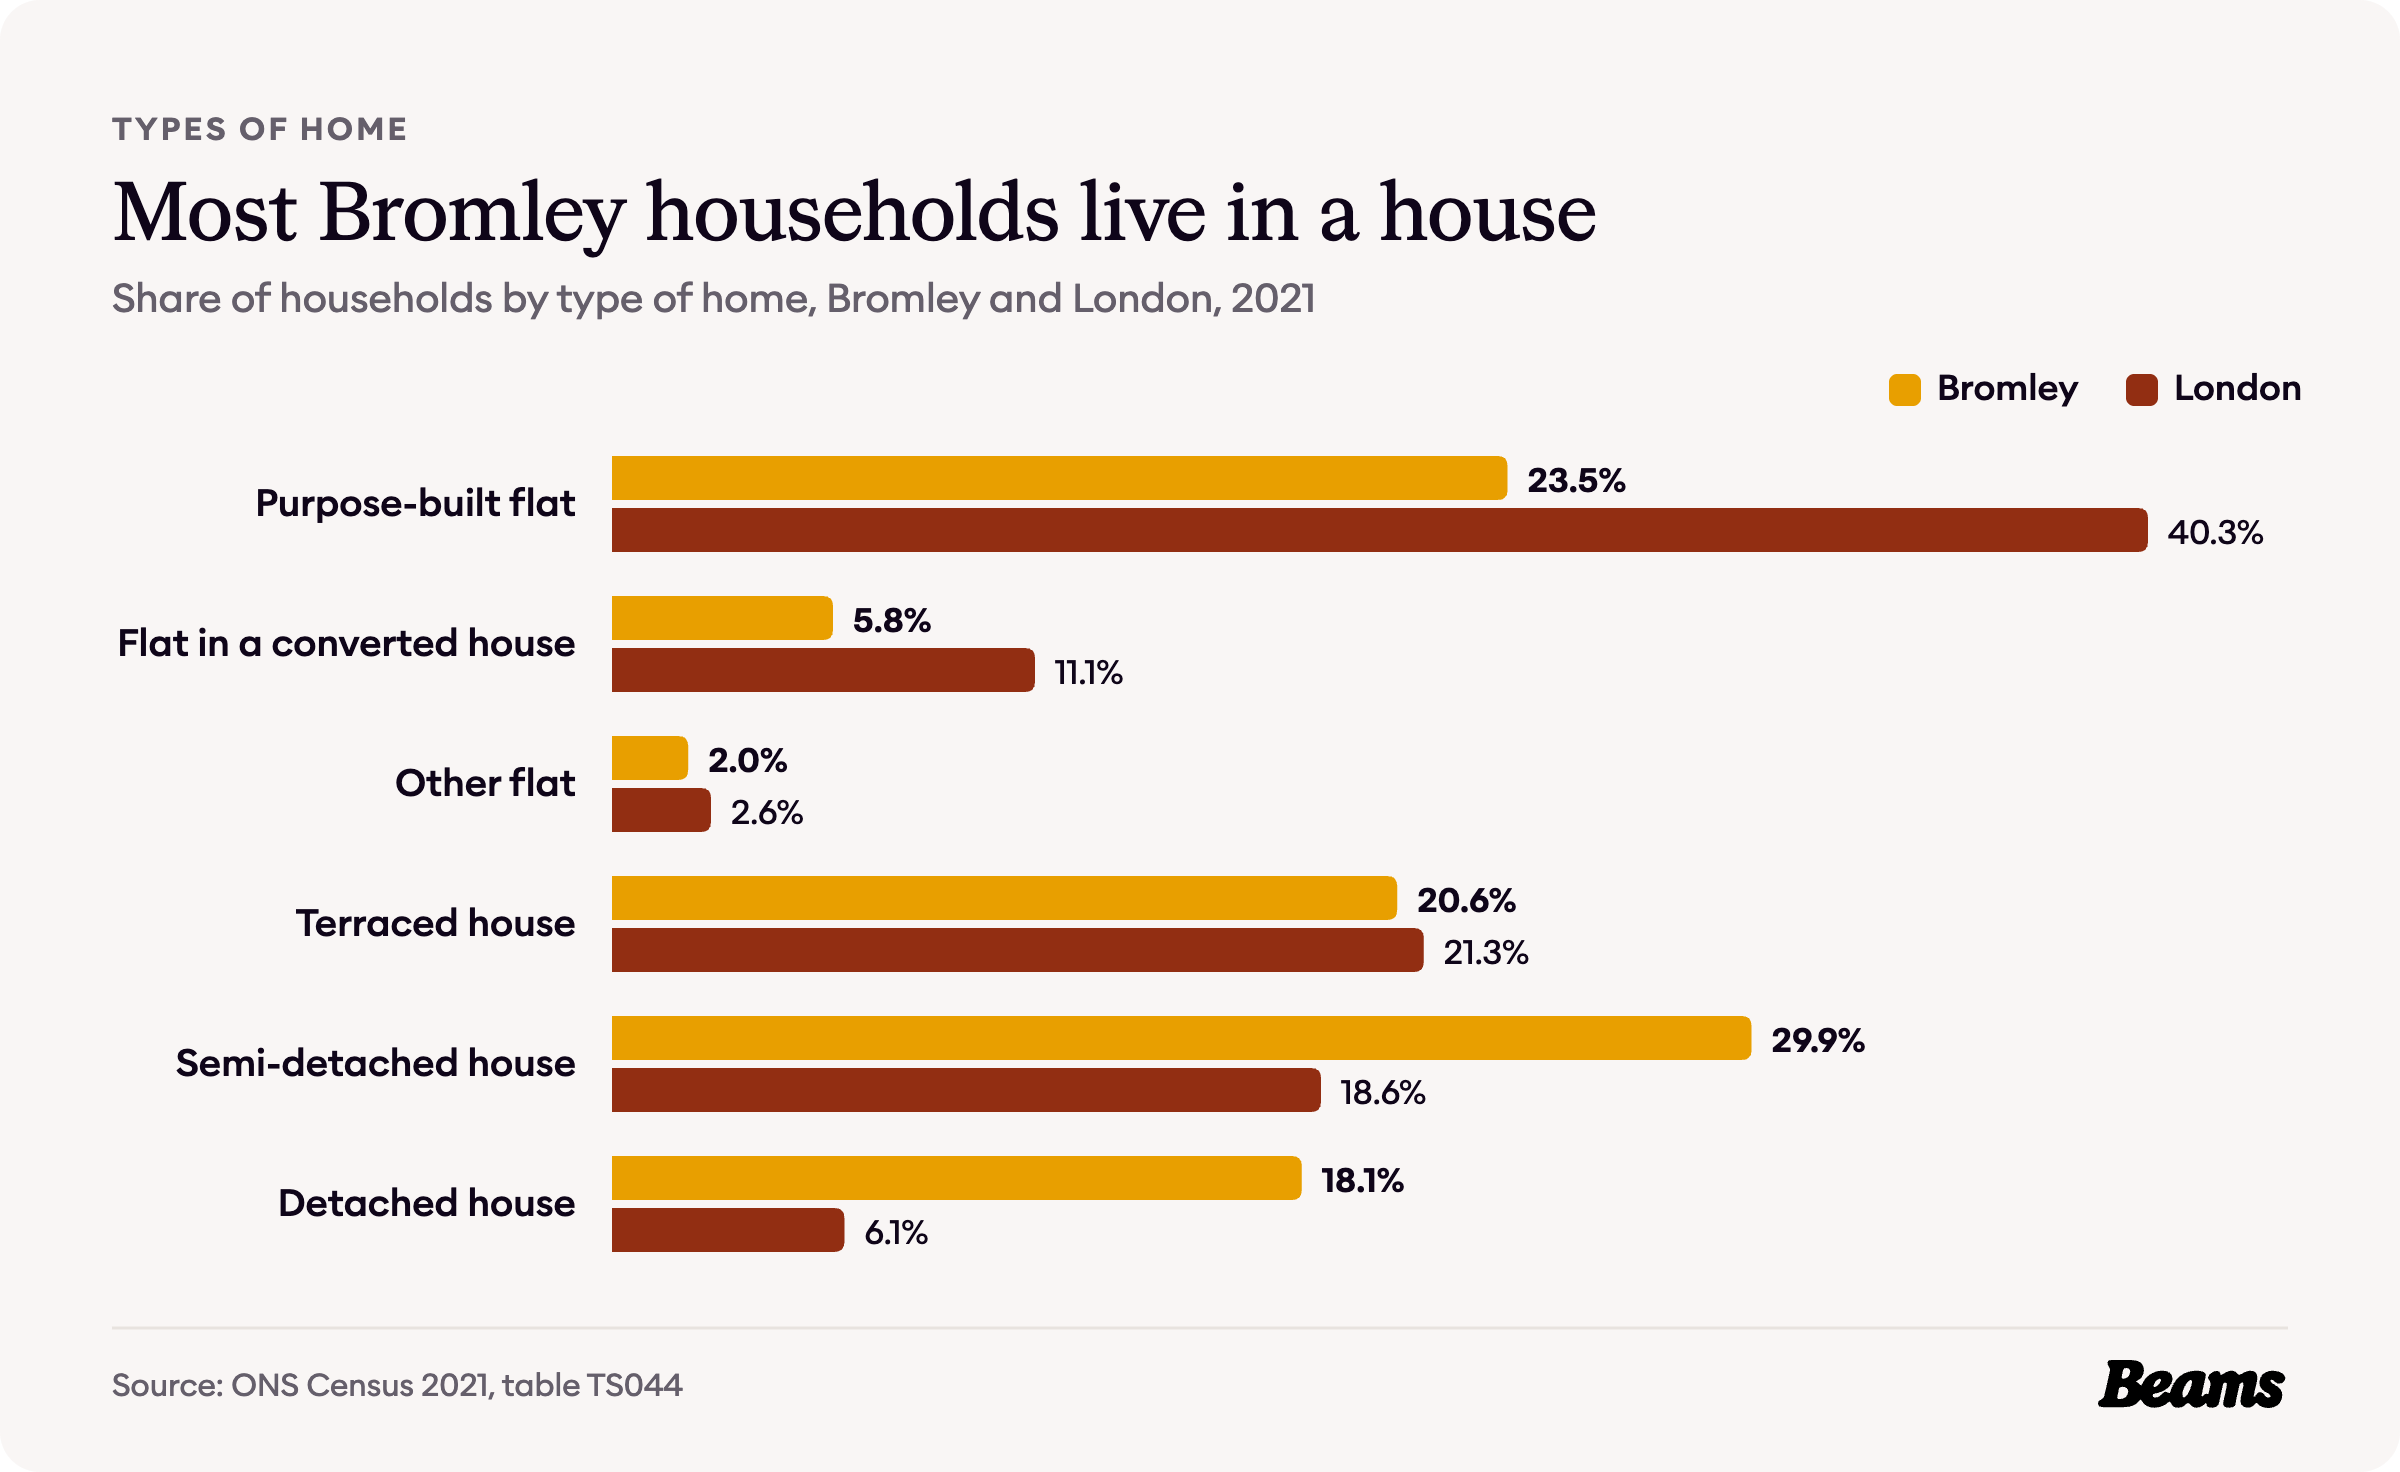
The 2021 Census counted 135,827 households in Bromley, and 68.6% of them live in a house, against 46.0% for London. 29.9% live in a semi-detached house and 18.1% in a detached one, almost three times the London share of 6.1% [4].
Flats make up the other 31.3%, mostly purpose-built. Just 5.8% of households live in a flat inside a converted house, against 11.1% for London [4].
Who owns Bromley's homes
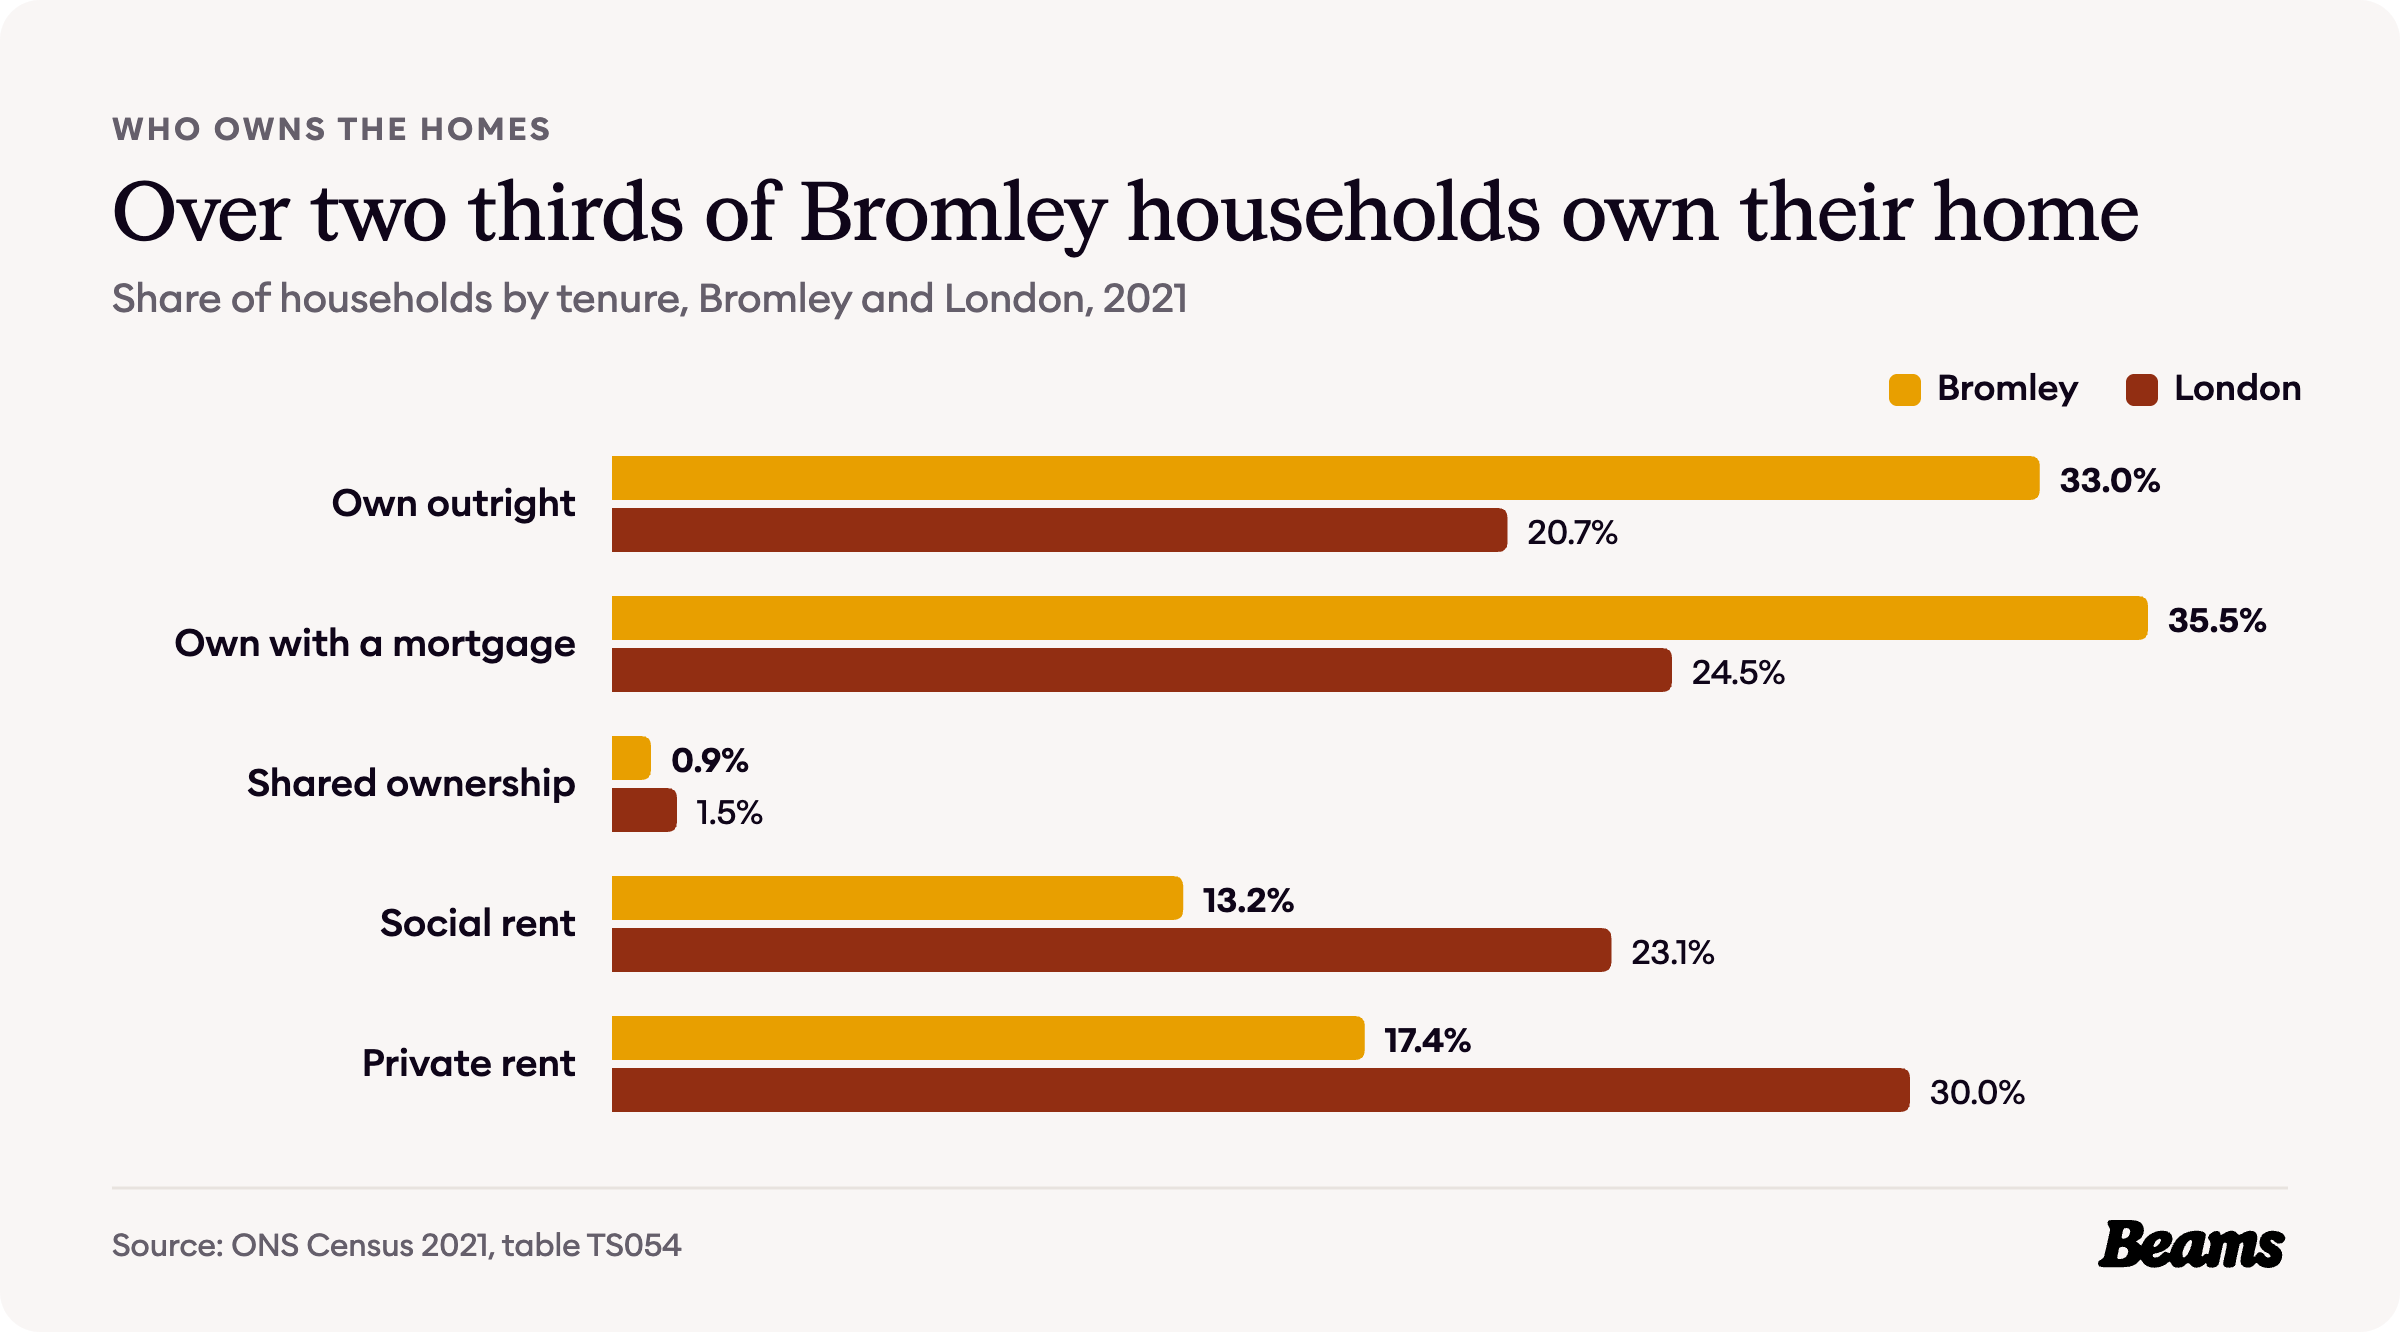
68.5% of Bromley households own their home, against 45.2% across London. A third, 33.0%, own outright, more than one and a half times London's 20.7%, and 35.5% are paying off a mortgage [5].
Private renting accounts for 17.4% of households and social renting for 13.2%, against 30.0% and 23.1% across London [5].
What a Bromley home costs
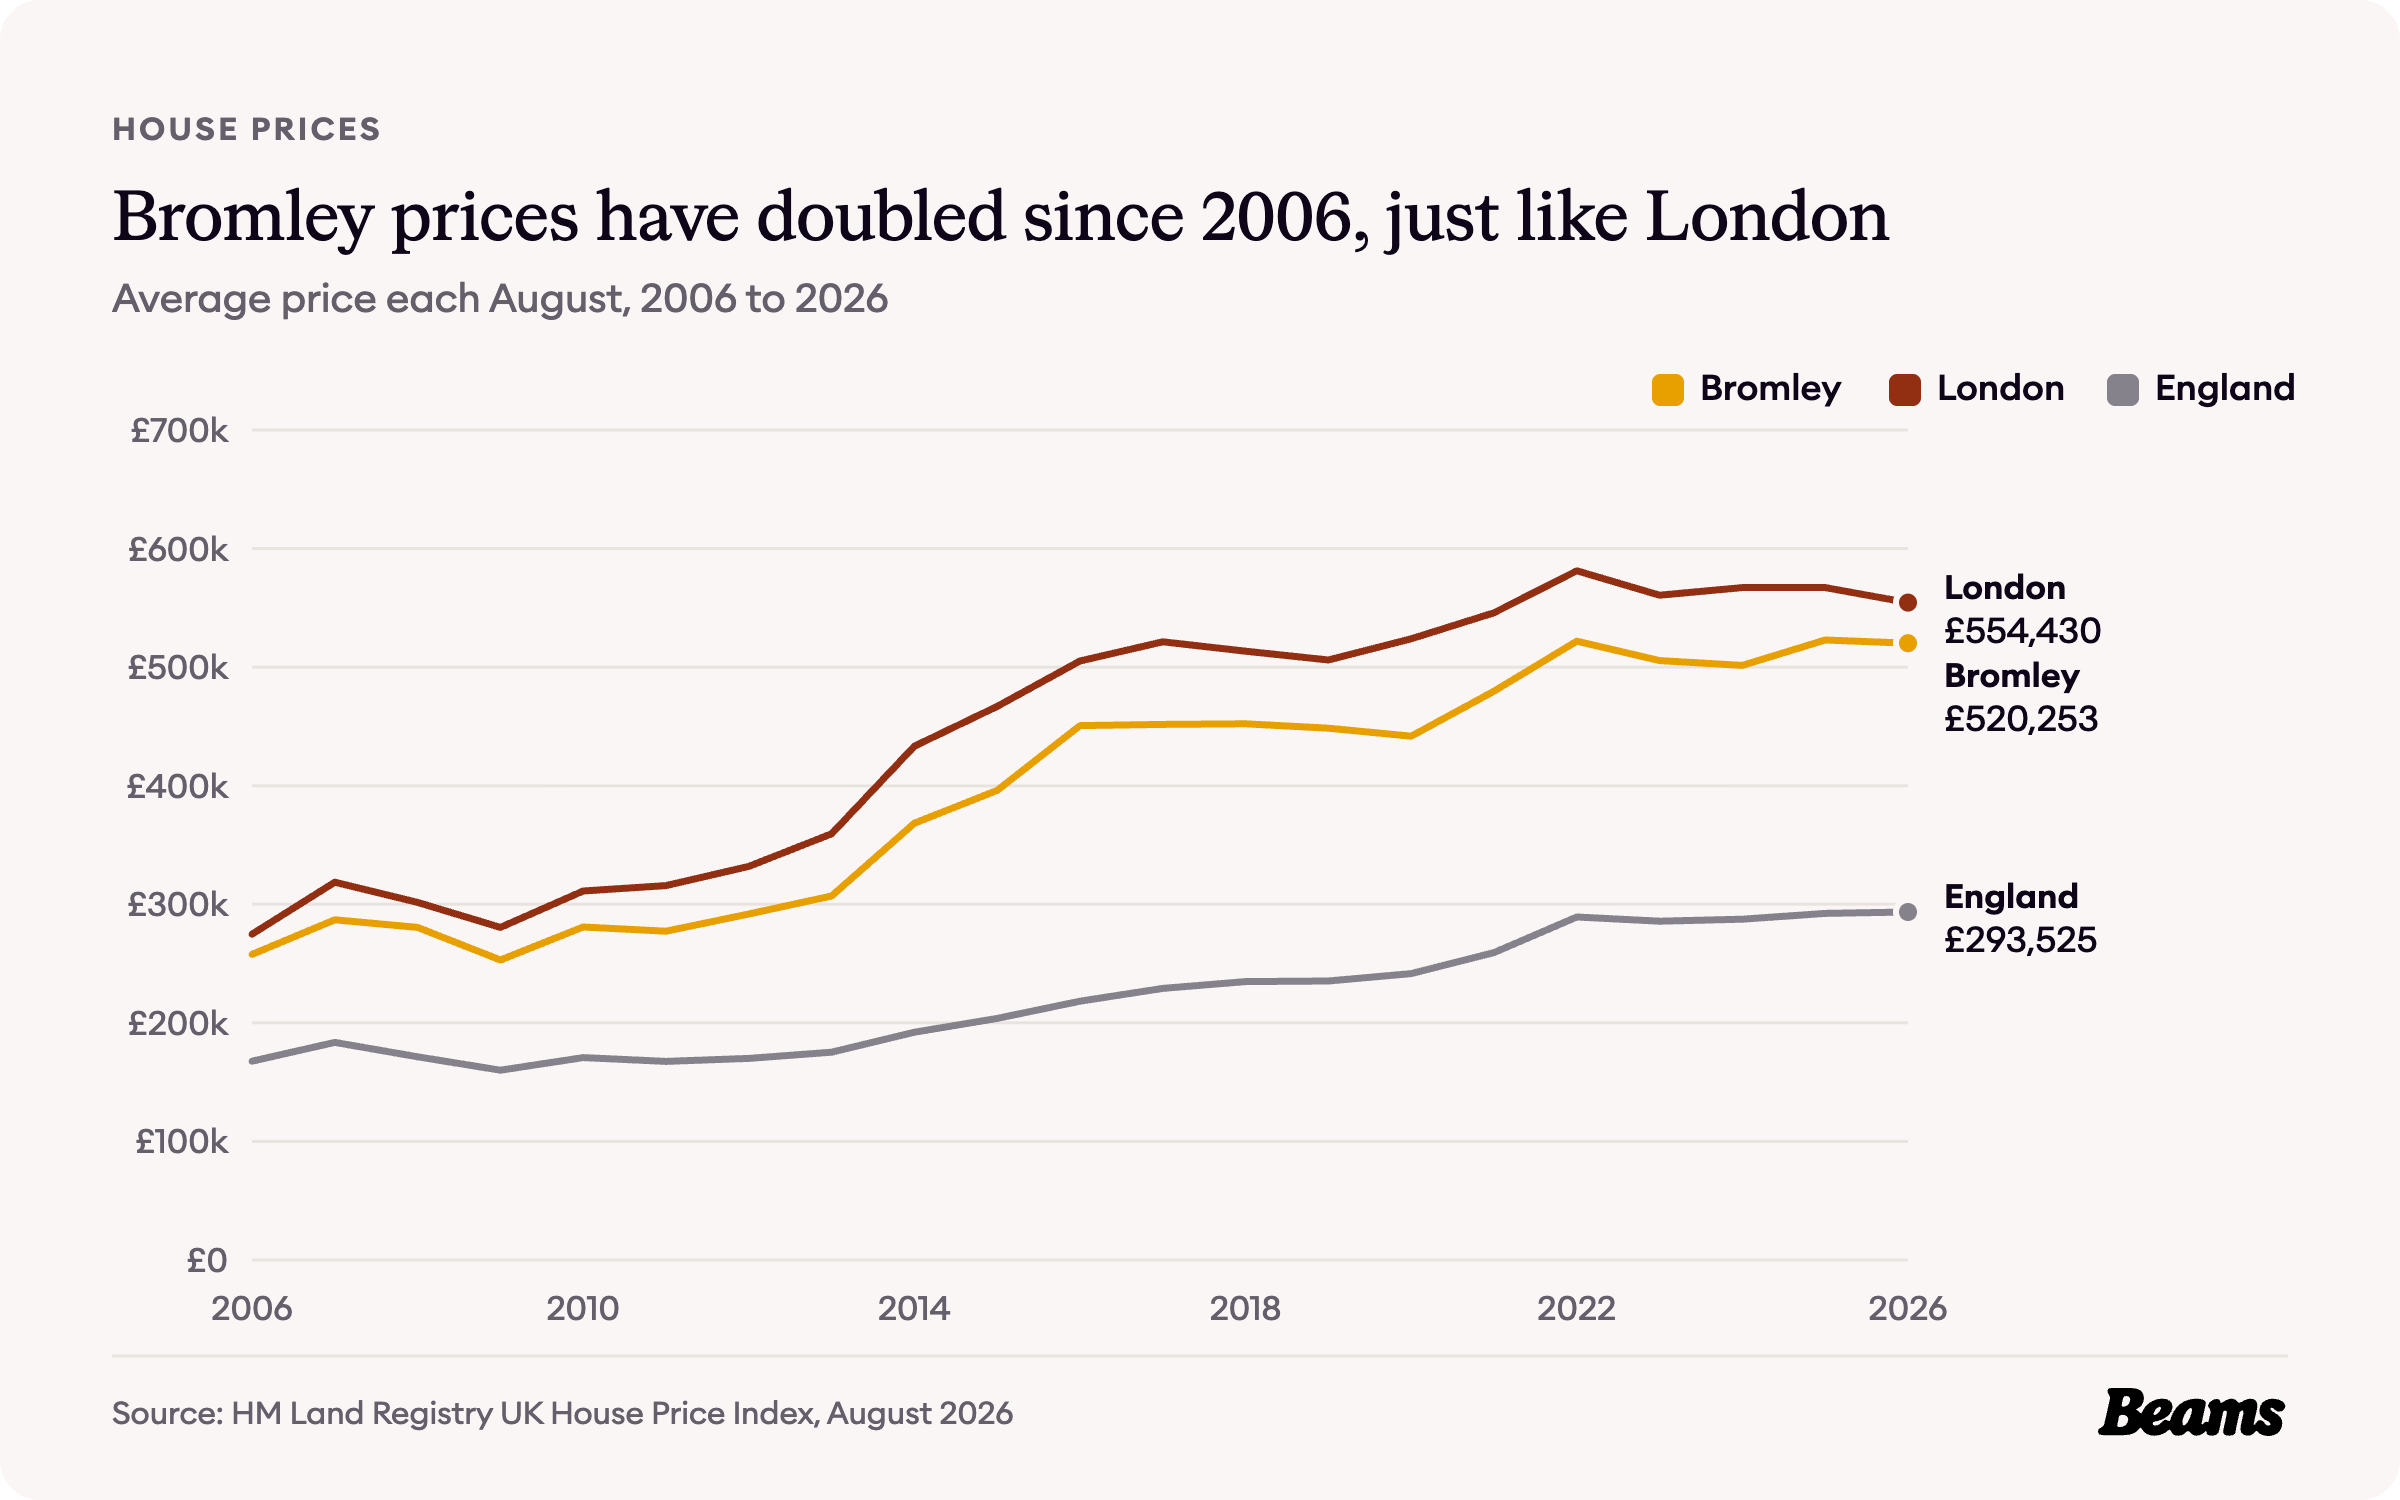
The average Bromley home cost £520,253 in August 2026, 0.5% less than a year earlier [6]. That is about 6% below the London average of £554,430, which fell further, by 2.2%, and about 77% above the England average of £293,525 [7].
Bromley has stayed a little below London throughout the past twenty years, and the two have moved almost in step. In August 2006 the average Bromley home cost £257,782 against £274,815 for London, and both have roughly doubled since. The biggest single rise came between 2013 and 2014, from £306,980 to £368,435 [7].
Each step up the ladder
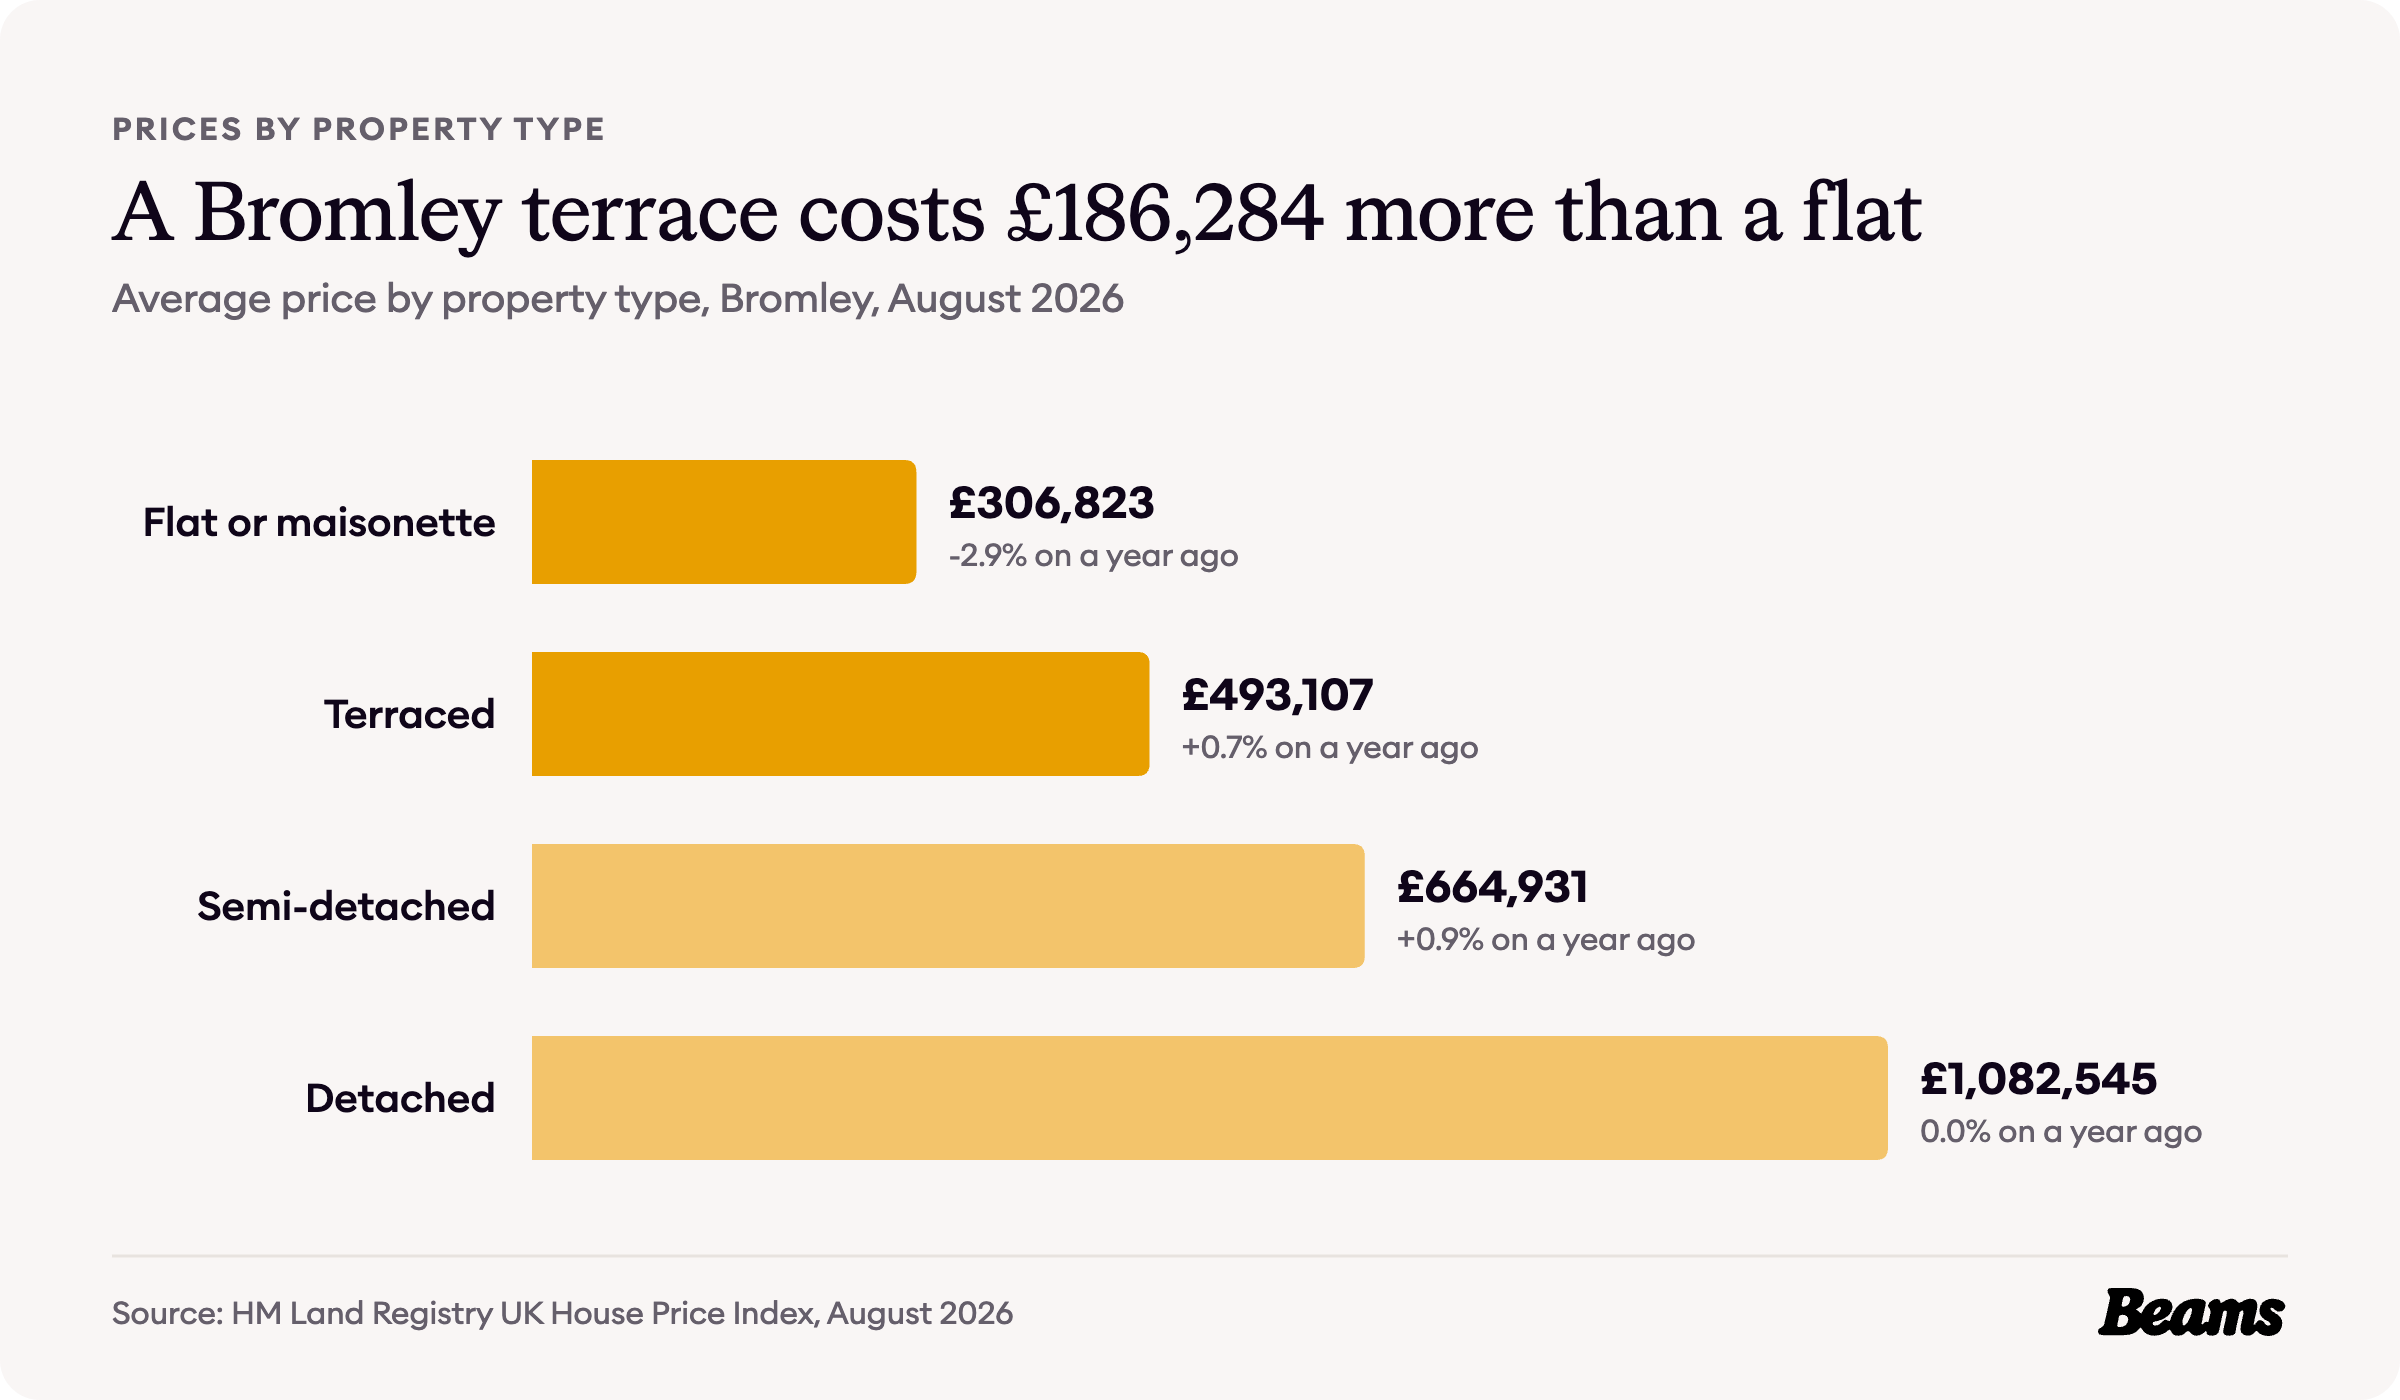
In August 2026 a Bromley flat or maisonette averaged £306,823 and a terraced house £493,107, a gap of £186,284 [6]. A semi-detached house averaged £664,931, another £171,824 on top, and a detached house £1,082,545 [6].
Owners moving home paid an average of £663,626, against £397,470 for first-time buyers [6]. With every step from flat to terrace to semi to detached costing six figures, a house extension in Bromley adds the room a family needs without paying for the next rung.
What it costs to rent
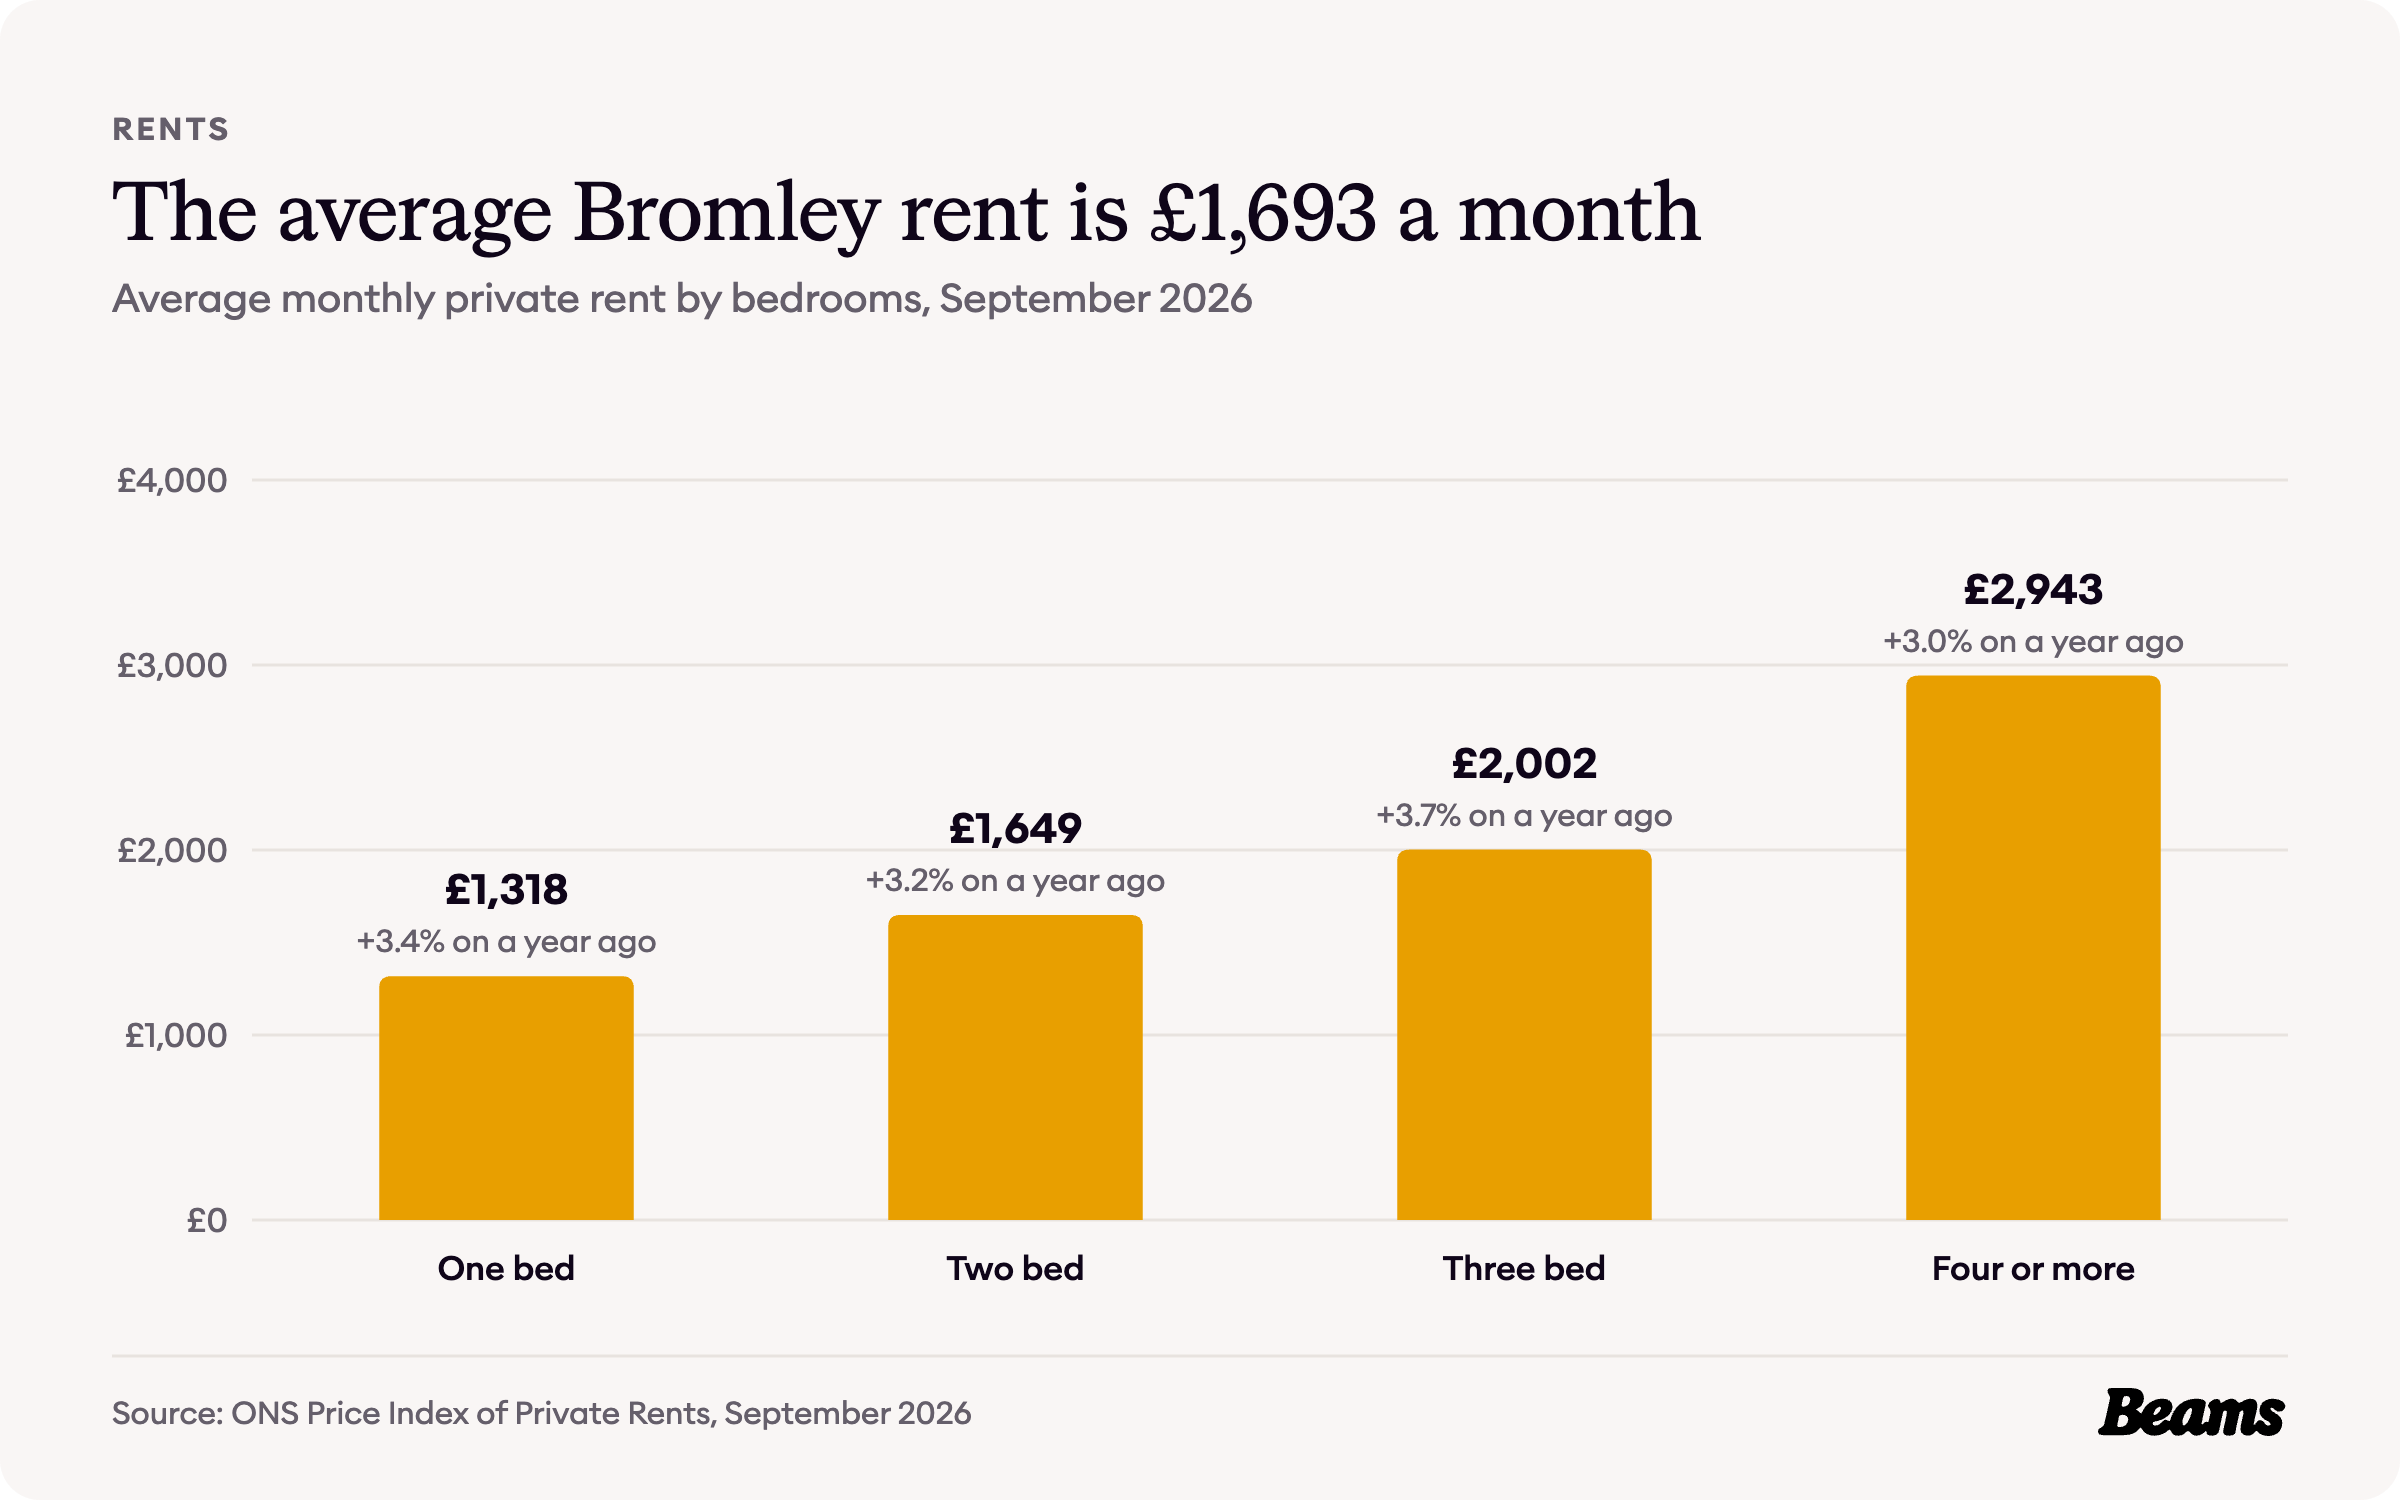
The average private rent in Bromley was £1,693 a month in September 2026, up 3.2% on a year earlier [6]. A one-bedroom home averaged £1,318 a month, a three-bedroom home £2,002 and a home with four or more bedrooms £2,943.
Council Tax in Bromley
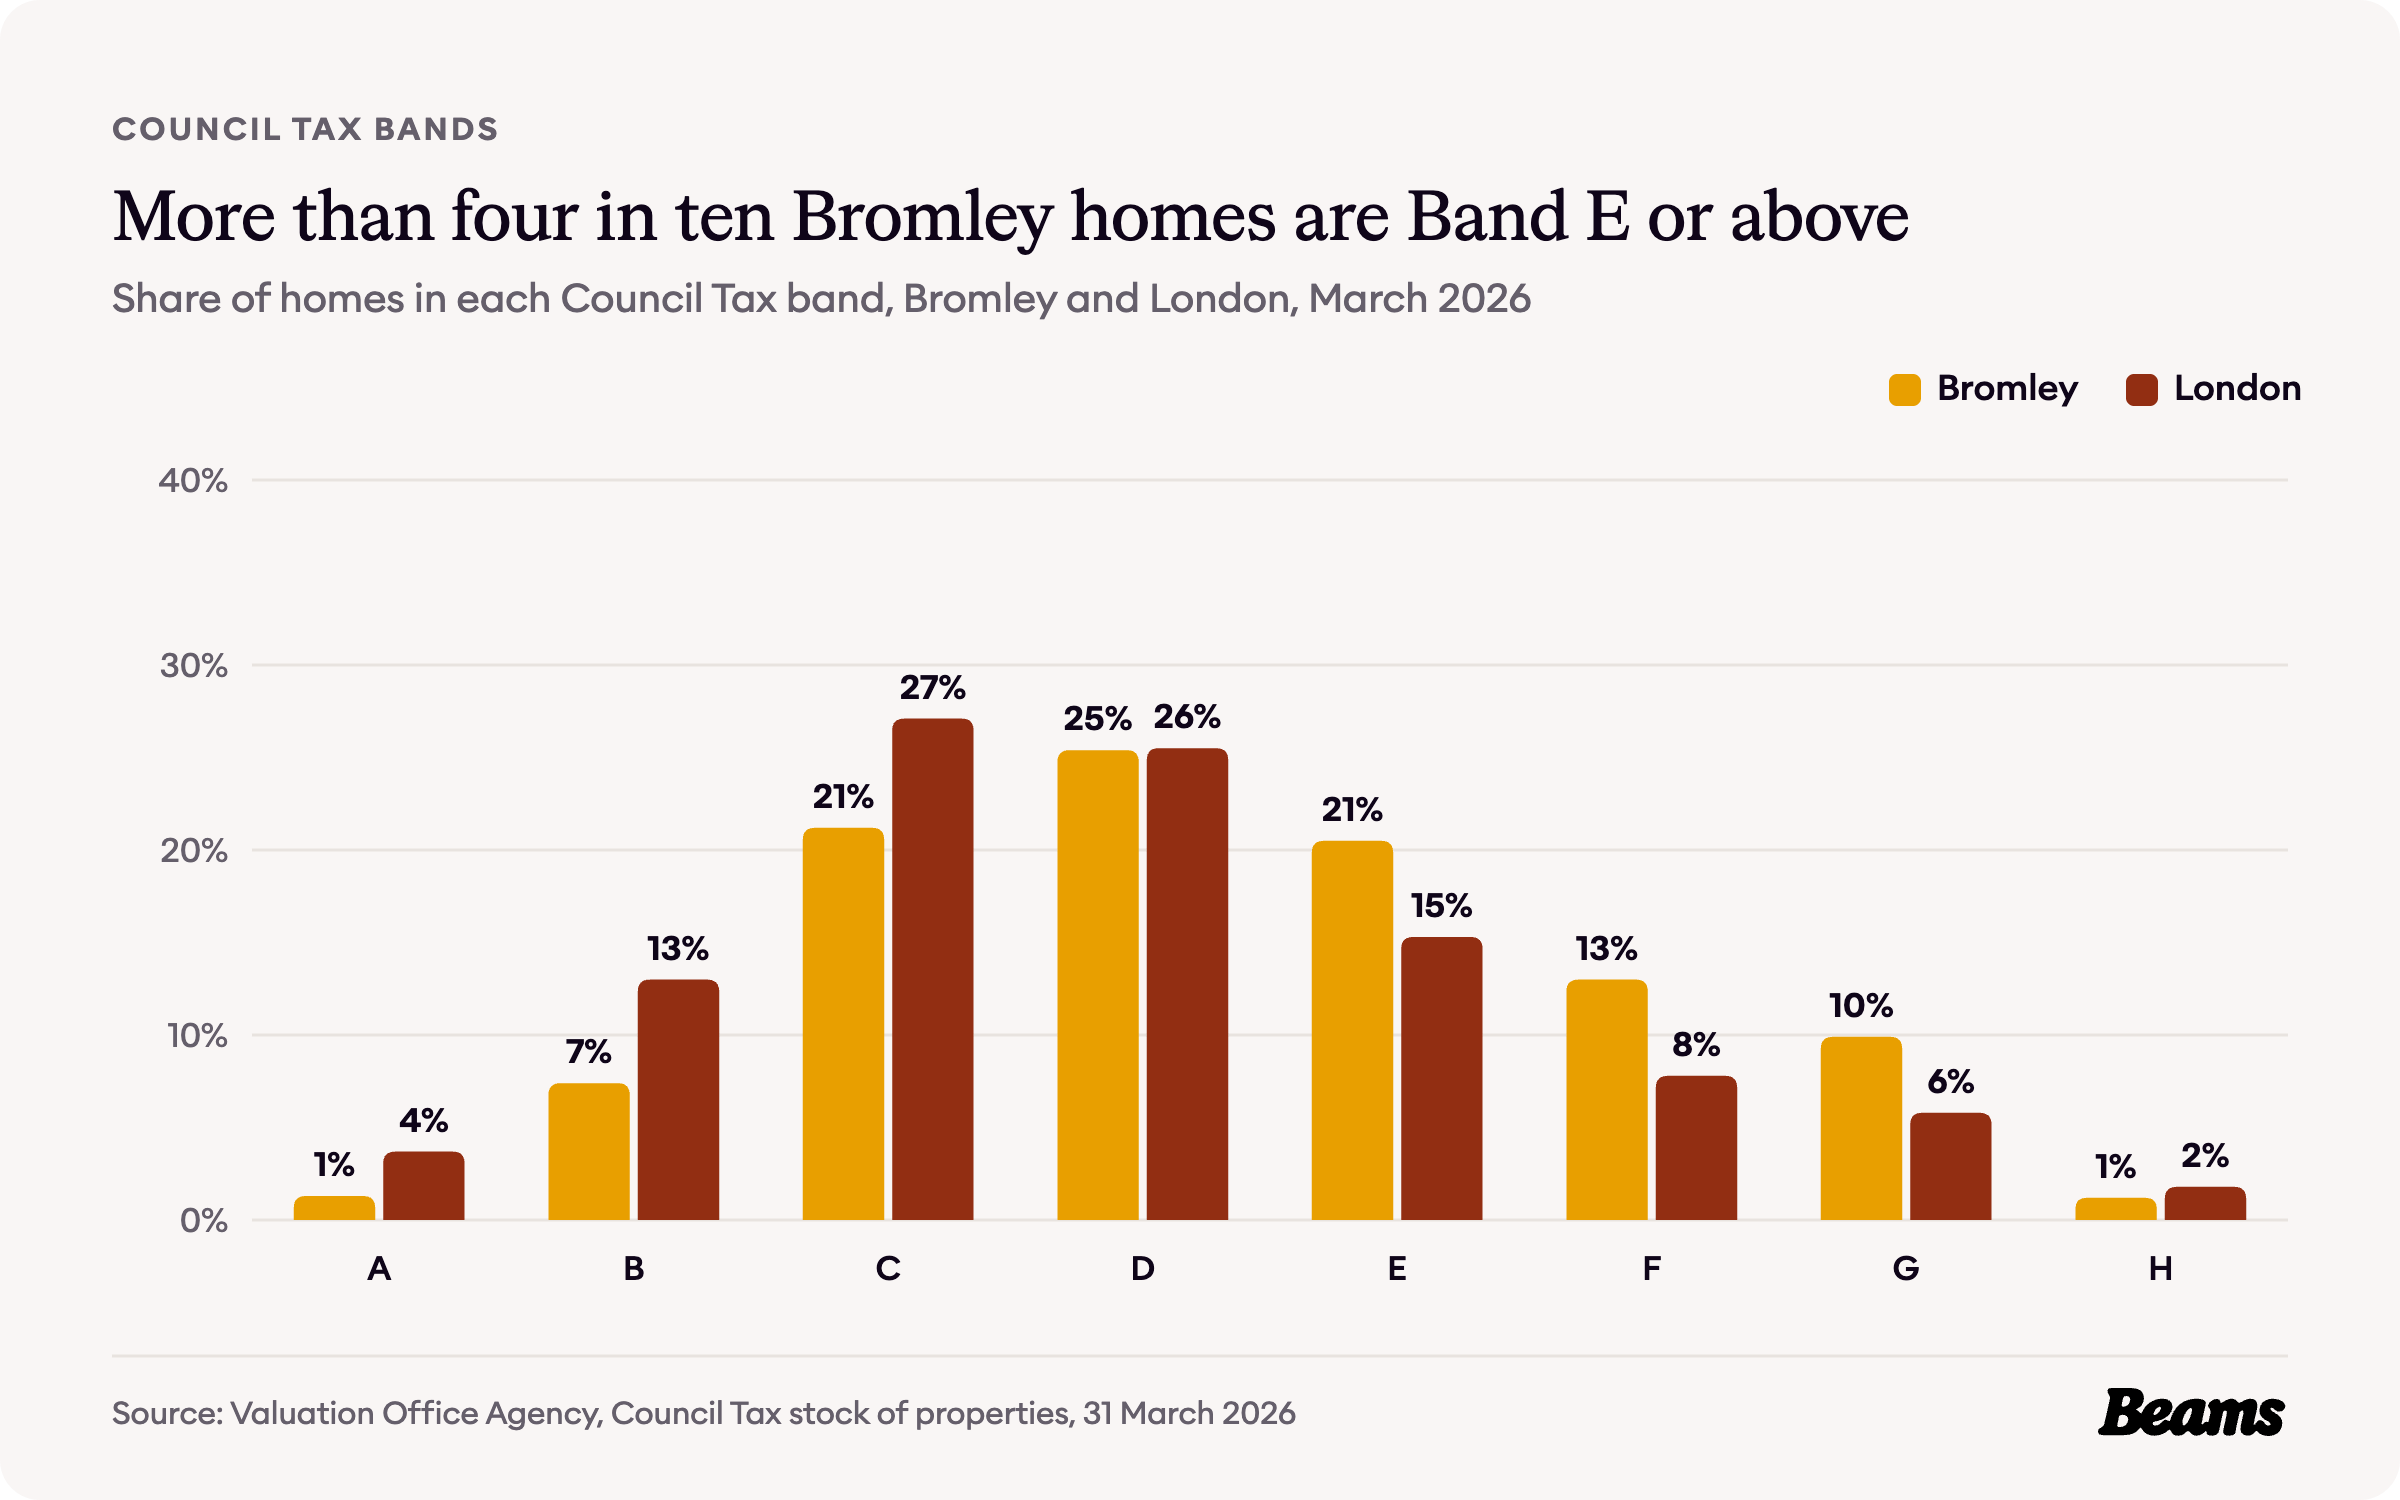
Council Tax bands in England are based on what a home would have sold for on 1 April 1991 [8]. Bromley leans towards the higher bands. 44.6% of homes are in Band E or above, against 30.7% across London, and only 8.7% are in Bands A and B, against 16.7%. Band D is the most common, at 25.4% [3].
Nearly a quarter of homes, 24.1%, are in Band F or above [3]. In the borough's bigger houses, interior design in Bromley can turn a dated layout into a home that lives up to its value.
The rules on your street
Bromley Council says there are 47 conservation areas in the borough, and that they come with additional planning controls, including extra protection for trees [9]. The oldest, Chelsfield and Chislehurst, were both designated on 2 November 1971, and the newest, The Covert and The Thrifts in Petts Wood, on 4 January 2022 [10]. Bigger jobs such as a basement conversion in Bromley start with a check of what applies to the address.
The council also uses Article 4 directions in its Areas of Special Residential Character. On 21 February 2022 it confirmed directions removing the permitted development rights for upward extensions in 11 of them, including Bickley, Bromley Common, Chelsfield Park and Park Langley, and they came into effect on 15 March 2022. Petts Wood has its own direction against adding storeys, confirmed on 19 July 2021 [11].
In the Petts Wood area, a further direction removes the Class B and C rights entirely, and in the Chislehurst Road conservation area the Class C rights, from 19 July 2022 [12]. Those are the national permitted development rights for additions to a roof and other roof alterations [13], so in Petts Wood a roof addition such as a dormer, which might not need permission on another street, does.
Bromley Council says it aims to decide 90 per cent of applications under delegated powers, by officers rather than at a planning committee [14]. The national statutory time limit is eight weeks for most applications and 13 weeks for major development [15]. Builders in Bromley matched through Beams are vetted and quote against the same specification on a fixed-price contract.
Bromley housing statistics at a glance
- Average house price, August 2026: £520,253 (London £554,430) [6] [7]
- Change on a year earlier: -0.5% (London -2.2%) [6] [7]
- Average flat or maisonette: £306,823 (London £427,310) [6] [7]
- Average terraced house: £493,107 (London £648,650) [6] [7]
- Average private rent, September 2026: £1,693 a month [6]
- Homes built between 1919 and 1939: 29.7% (London 22.0%) [3]
- Households living in a house: 68.6% (London 46.0%) [4]
- Households who own their home: 68.5% (London 45.2%) [5]
- Homes in Council Tax Band E or above: 44.6% (London 30.7%) [3]
- Conservation areas: 47 [9]
Frequently asked questions
References
- University of Greenwich, Ideal Homes: History of Bromley. The market town, the 1858 railway and New Bromley.
- University of Greenwich, Ideal Homes: History of the London Borough of Bromley. How the borough was formed in 1965.
- Valuation Office Agency, Council Tax: stock of properties 2026. Properties by build period and Council Tax band at 31 March 2026.
- ONS, Census 2021 table TS044: Accommodation type. Households by type of home, Bromley and London.
- ONS, Census 2021 table TS054: Tenure. Households by tenure, Bromley and London.
- ONS, Housing prices in Bromley. UK House Price Index for August 2026 and Price Index of Private Rents for September 2026, published 21 October 2026.
- HM Land Registry, UK House Price Index. Average prices for Bromley, London and England, August 2006 to August 2026.
- GOV.UK, Understand how Council Tax bands are assessed. Bands in England are based on values at 1 April 1991. Accessed 29 October 2026.
- Bromley Council, Conservation areas. Number of conservation areas and the controls that apply. Accessed 29 October 2026.
- Bromley Council, Conservation areas and listed buildings datasets. Names and designation dates of the borough's conservation areas. Accessed 29 October 2026.
- Bromley Council, Article 4 Directions to remove upwards extension permitted development rights. Directions confirmed in 2021 and 2022. Accessed 29 October 2026.
- Bromley Council, Article 4 Directions to remove Part 1, Class B and C PD rights. Petts Wood and Chislehurst Road directions. Accessed 29 October 2026.
- legislation.gov.uk, The Town and Country Planning (General Permitted Development) (England) Order 2015, Schedule 2, Part 1. Classes B and C, additions and other alterations to the roof of a house.
- Bromley Council, Determination of planning applications. Delegated powers and committee decisions. Accessed 29 October 2026.
- GOV.UK, Determining a planning application. National statutory time limits for planning decisions. Accessed 29 October 2026.
Thinking of improving rather than moving?
Tell us about your Bromley home and what you want to change. We'll give you a free estimate, then up to three vetted builders quote against the same specification.